The class Porphyridiophyceae of the division Rhodophyta forms a monophyletic group based on molecular data and is distinguished from other unicellular red algae by having specific ultrastructural features: Golgi bodies always associated with mitochondria and peripheral thylakoids absent in the plastid (Yang et al. 2010). Currently the class is comprised of four genera:
In
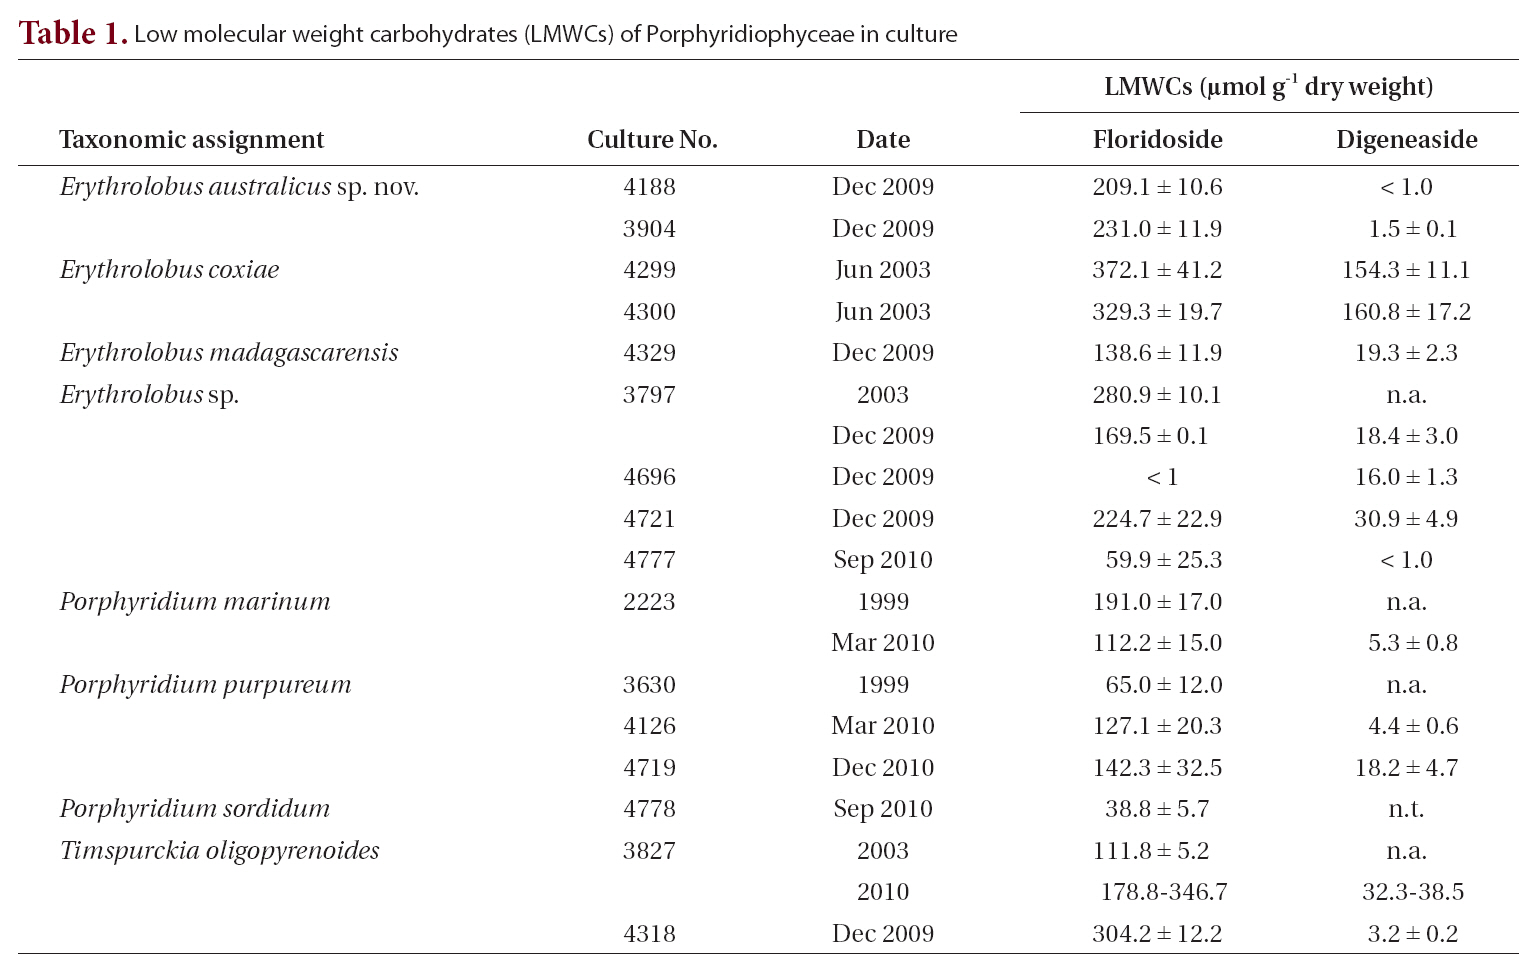
The application of chemical characters has long been important in algal systematics. The distribution of low molecular weight carbohydrates (LMWCs) are useful chemotaxonomic characters particularly in red algae (Karsten et al. 1999, 2003). For an organic molecule to be useful as a chemotaxonomic character, it must be specific to a certain taxon or group of organisms. The distribution patterns of the main LMWC floridoside (α-D-galactopyranosyl-[1?2]-glycerol) and digeneaside (α-D-mannopyranosyl-[1?2]-glycerate), have been applied as chemotaxonomic characters in various red algae (Karsten et al. 1999, 2003, Eggert and Karsten 2010, Yang et al. 2010).
We have chosen the name
Methods for collection, isolation and maintenance of cultures are presented in West and Zuccarello (1999) and West (2005). To promote growth of target unicellular red algae low nutrient levels were used initially (2 mL modified-Provasoli-media [MPM] enrichment per liter of sterile seawater). The seawater was adjusted to 30 psu with Milli-Q water (Millipore Corp., Billerica, MA, USA). Careful weekly observations with a dissecting stereomicroscope detected developing unicell colonies that were removed by a 100 μL micro-pipet and subcultured in 50 × 70 mm crystallizing dishes containing 30 psu seawater with 10 mL MPM enrichment per liter. Most cultures were maintained in 18-22ºC, 5-20 ㎛ol photons m-2 s-1 cool white fluorescent lighting with a 12 : 12 LD daily cycle. For low molecular weight carbohydrate analysis cultures were dried at 60ºC and sent to UK.
A small drop of cultured cells was placed on a glass slide, covered with a coverslip and sealed on the edges with VALAP (Pickett-Heaps et al. 2001). Motility of individual cells was followed for 5-10 min but no videomicroscopy was done. Images of live cells were taken on a Zeiss GFL microscope (Carl Zeiss, Thornwood, NY, USA) with a Canon G3 digital camera (Canon, Tokyo, Japan). Images were processed with Adobe Photoshop CS4 (Adobe Systems Incorporated, San Jose, CA, USA) for publication figures.
Isolates were cultured with 10 mL ESM medium (Okaichi et al. 1982) in glass culture tubes for two weeks before fixation. Cultured cells were then transferred to 1.5 mL microtubes with 0.5 mL of culture medium, fixed with equal volume of 3% paraformaldehyde in PHEM buffer [60 mM PIPES, 25 mM HEPES, 10 mM EGTA, 2 mM MgCl2(6H2O), pH 7.4] for 15 min. Ten μL of the fixative solution were placed on a glass slide coated with 0.1 w/v% poly-L-lysine and incubated for 10 min at room temperature.Then equal volumes of SlowFade® Antifade (Invitrogen,Carlsbad, CA, USA) and 1,000× diluted SYBR® Green I (Invitrogen) were added and incubated for 15 min. Confocal images were taken with an inverted microscope Axiovert 100M with LSM 510 laser scanning equipment (Carl Zeiss AG, Jena, Germany). Plastid autofluorescence and SYBR Green I fluorescence were detected with a 585 nm long pass filter, 505 to 530 nm band pass filter, respectively,in the excitation line of a 488 nm argon laser and 543 nm He/Ne laser using single-track mode as described in Hirakawa et al. (2010).
>
Transmission electron microscopy
Cells from culture were filtered onto poly-L-lysine coated 0.45 ㎛ Millipore™ filters and fixed for 2 h at ambient temperature in 2% glutaraldehyde in a 0.1 M phosphate buffer solution (pH 6.8) with 0.15 M sucrose. Following buffer rinses samples were post-fixed 1 h in the same buffer with 1% OsO4 at 4ºC, rinsed thoroughly in H2O, left in 50% acetone for 30 min and stored in a 70% acetone-2% uranyl acetate solution at ambient temperature for 20 h. Samples were then further dehydrated in a graded acetone series, infiltrated gradually and embedded in Spurr’s resin and polymerized at 70ºC for 2-3 days. Thin sections were cut with an RMC MT6000-XL ultramicrotome(RMC Inc., Tucson, AZ, USA). Sections were stained 1 min with lead acetate. A Zeiss EM 109 electron microscope was used for observation and photography.
Genomic DNA was extracted from each culture strain using a DNeasy Plant Mini Kit (Qiagen, Hilden, Germany),according to the manufacturers’ instructions. PCR and sequencing were performed as described in Yang et al. (2010). Specific primer sets for two plastid genes were used: psaA130F-psaA1110R and psaA971F-psaA1760R for
Appropriate evolution models for DNA and protein data were selected by the program ModelGenerator v.0.85 (Keane et al. 2006). Based on Akaike Information Criterion(AIC) and Bayesian Information Criterion (BIC), general time reversible (GTR) substitution model for DNA and LG (Le and Gascuel 2008) for protein were selected as the best fit evolution models, respectively. Maximum likelihood (ML) analyses were performed using RAxML version 7.2.6 (Stamatakis 2006). Tree likelihoods were estimated using 100 independent replications using an unfixed GTR with rate heterogeneity among sites (gamma distribution, Γ) parameter. Automatically optimized Sub-tree Pruning and Reconnection (SPR) rearrangement with rapid hill climbing algorhythm was used for the best tree search. Maximum parsimony (MP) analyses were conducted using the PAUP* version 4.0b10 (Swofford 2002). The heuristic search was carried out with 1,000 replicates, random sequences addition and Tree Bisection Reconnection (TBR) branch swapping. Bootstrap analyses were carried out with 1,000 replicates to test of monophyly under the same ML (MLBt) and MP (MPBt) condition.
Bayesian analysis for DNA data was conducted with MrBayes version 3.2 (Ronquist and Huelsenbeck 2003) using GTR + Γ parameter, which was same evolution model in ML analyses. The GTR rates and Γ values were not fixed. Two independent runs of 2 million generations were performed with four chains and trees were sampled every 100 generations. The burn-in point was identified by the average of standard deviation from split frequencies(< 0.01) between two independent runs. Trees sampled after the burn-in point were used to infer the Bayesian posterior probability (BPP).
>
Low molecular weight carbohydrates (LMWC) analyses
Both heterosides (floridoside and digeneaside) were separated and quantified by high-performance liquid chromatography (HPLC). For the chromatographic analyses,10-15 mg dry weight (DW) of red algal samples were extracted in 1 mL of 70% (v/v) ethanol and heated for 3 h in a waterbath at 70°C. After centrifugation for 5 min at 6,200 ×g, 700 mL of the supernatant were evaporated to dryness under vacuum (Speed Vac Concentrator SVC 100H; Savant, Farmingdale, NY, USA). Dried extracts were redissolved in 700 mL of distilled water, sonicated for 1 min and vortexed for 30 s. After centrifugation at 16,000 ×g, the supernatants were analysed with an isocratic Agilent HPLC system equipped with a differential refractometer.The LMWCs were separated (floridoside and digeneaside) using a resin-based Phenomenex (Rezex ROA-Organic Acid, 300 × 7.8 mm O.D.) column protected with a Phenomenex Carbo-H+ guard cartridge (4 × 3 mm I.D.) and quantified with an isocratic Agilent HPLC system equipped with a differential refractometer (Karsten et al. 2005). On this column both heterosides were eluted with 5 mM H2SO4 at a flow rate of 0.4 mL min-1 at 75°C. Peaks on both columns were identified by comparison of the respective retention times with those of standard compounds and quantified by peak areas. The concentrations were expressed in ㎛ol g-1 DW.
Cells spherical, 10-20 ㎛ in diameter, extracellular matrix (< 1 ㎛ thick), rose-red to red, phototactic. Single plastid with numerous lobes extending from multiple pyrenoids located throughout the cell. Pyrenoids containing numerous tubular thylakoids border the cytoplasm and usually surrounded by starch granules. Peripheral thylakoids are absent. Arrays of small (30-60 nanometers) uniform electron dense globules often occur between thylakoids. Each Golgi body always associated with a mitochondrion and located near the cell periphery. The nucleus peripheral with a single central to eccentric nucleolus. LMWCs are floridoside and digeneaside. Holotype: Cryopreserved culture - CCMP 3123 (JAW3904). Paratype: Cryopreserved culture - CCMP 3124 (JAW4188). Bigelow Laboratory for Ocean Sciences, P.O. Box 475, 180 McKown Point Road, West Boothbay Harbor, ME 04575, USA.
Iconotype: Fig. 1-3 of this paper.
Live culture specimens: holotype, CCAP 1393/7 (JAW 3904); paratype, CCAP 1380/8 (JAW4188). Culture Collection of Algae and Protozoa, Scottish Association for Marine Science, Scottish Marine Institute, Dunstaffnage Marine Laboratory, Dunbeg, Oban, Argyll, PA37 1QA, UK.Holotype locality: Culture 3904 was isolated from a cultured specimen of
Paratype locality: Culture 4188 was isolated from a cultured specimen of
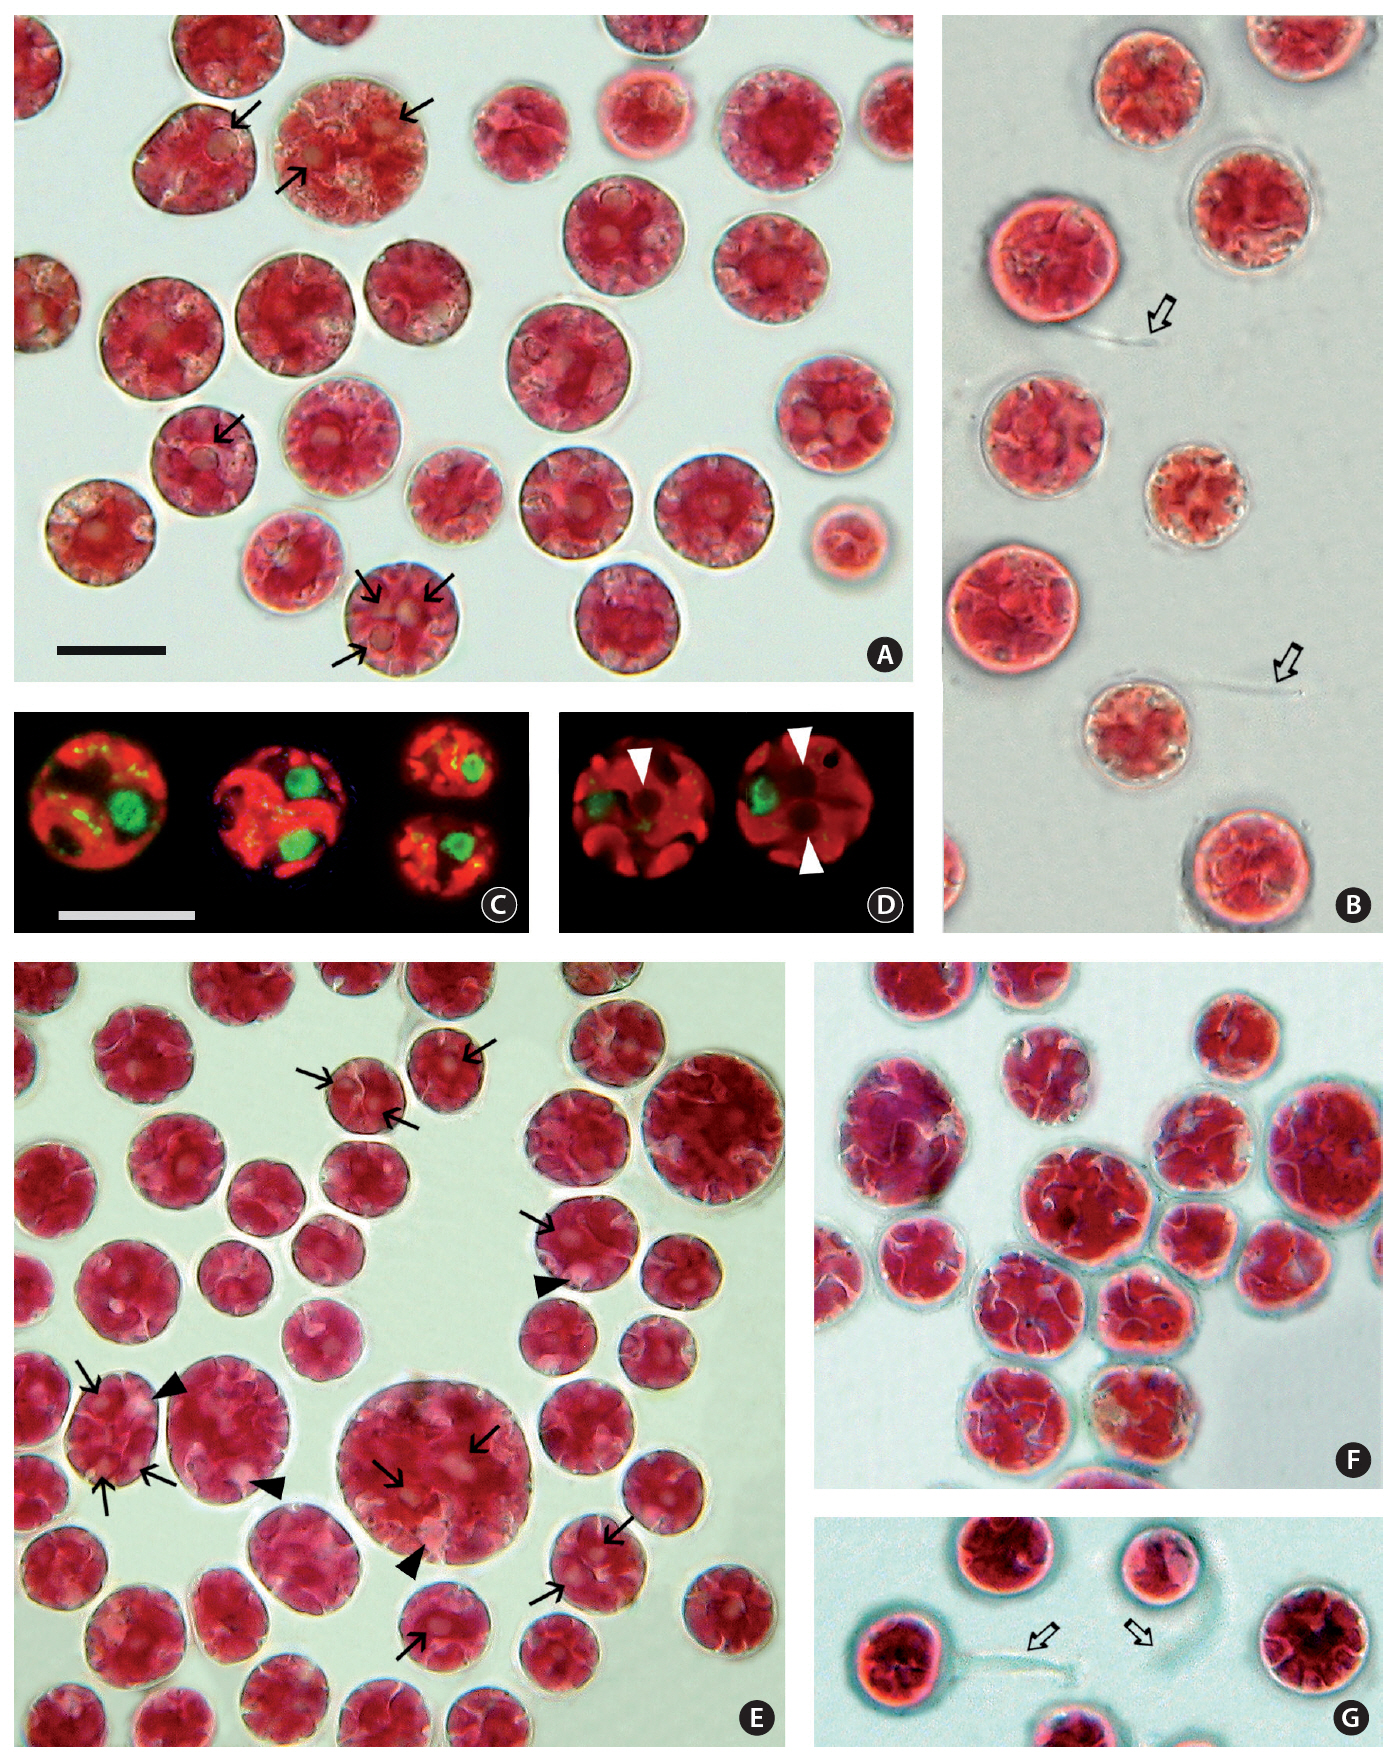
The cell diameter of both isolates varied from 10-20㎛ in diameter. The cellular details were difficult to discern with conventional brightfield microscopy. Even with a careful through-focus it was hard to see more than one pyrenoid in many cells but when the cell preparation was fully flattened by the weight of the coverslip, pyrenoids (Fig. 1A & E) and the nucleus (Fig. 1E) were more visible. The dark refractive outline of starch grains around the pyrenoid aided in their identity. The narrow fissures between plastid lobes were especially visible when focused at the outermost level (Fig. 1F). During observations on cell motility the cells remained spherical and rotated slowly while gliding without substrate contact. Polysaccharide tails visible on some cells (Fig. 1B & G) did not appear to be involved in movement.
Late stages of cell division were observed in cells of 3904 (Fig. 1C). The nucleus was 3.2-3.5 ㎛ in diameter and positioned near the perimeter between plastid lobes. The plastid divided after the nucleus. Plastid genophores were spherical to elongate up to 0.37-0.55 ㎛ long. As many as 15 genophores were visible in a single optical section but it was not possible to determine if they were connected. In isolate 4188 3 pyrenoids (Fig. 1D) were visible as dark areas (2.4-2.8 ㎛ in diameter) when a series of focal levels were photographed.
>
Transmission electron microscopy
Since both isolates of
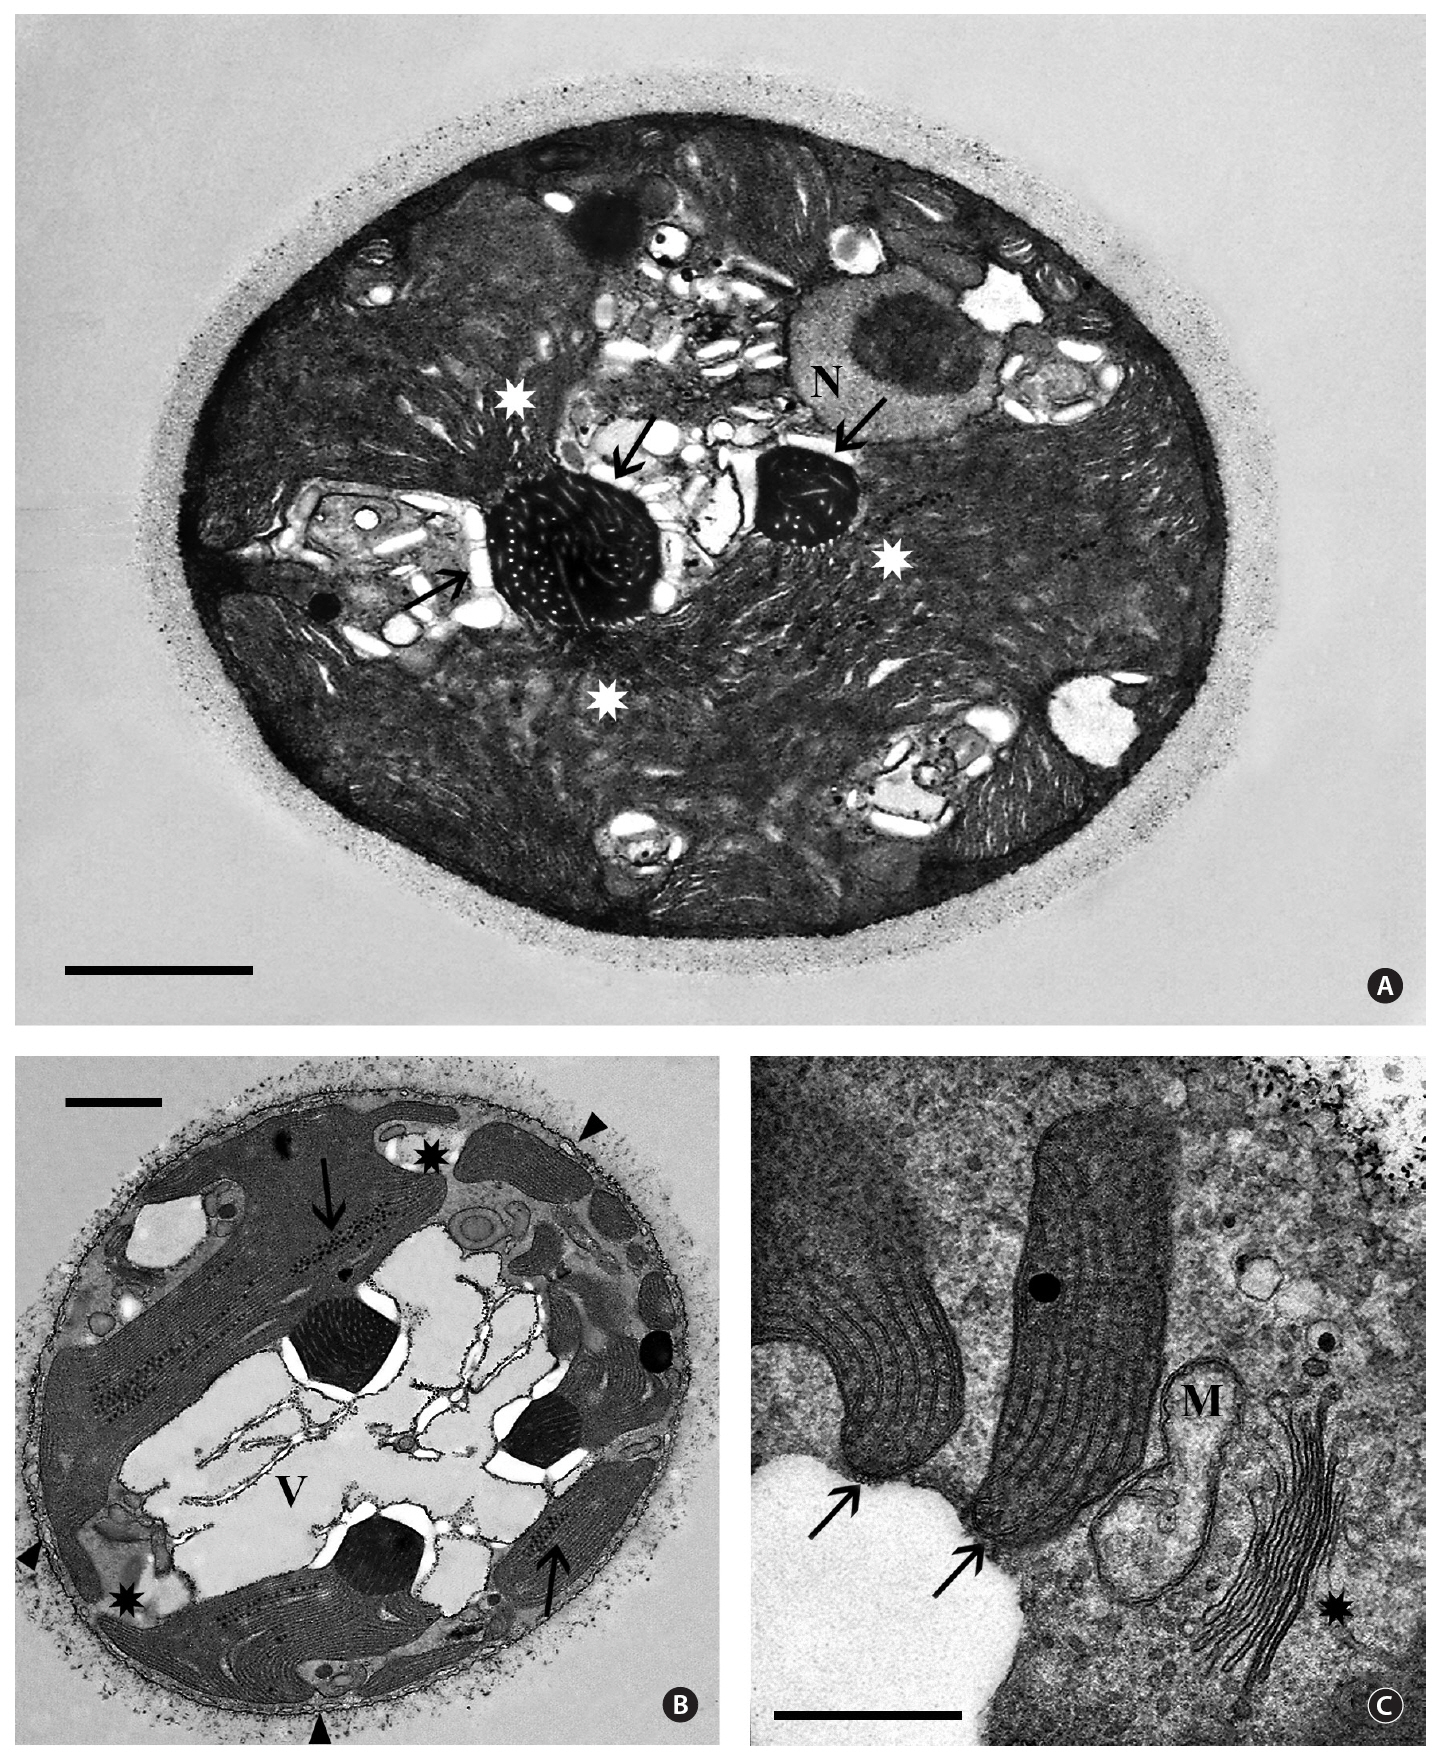
Isolate 3904 - Queensland. Most transmission electron microscopy (TEM) observations revealed cells showing either a single pyrenoid and / or nucleus. However, examination of numerous thin sections and hundreds of cells provided views of cells with a medially sectioned nucleus and one or more pyrenoids (Fig. 2A). Occasionally three pyrenoids were seen in a single non-dividing cell (Fig. 2B). The extracellular sheath is faintly visible and approximately 0.5 ㎛ thick. A peripheral endoplasmic reticulum (ER) system was just beneath the cell membrane(Fig. 2B) but short tubules that interconnected this system with the cell membrane, as seen in many red algal unicells (Scott et al. 2006), were not detected. The 2.5-3.0 ㎛ nuclei (Fig. 2A) contained a single central to eccentric nucleolus and were usually near the cell periphery but
interior to other cellular components, mainly the plastid. Electron dense heterochromatin was never seen.
The plastid occupied the majority of the cell interior and was quite variable in shape (Fig. 2A & B). It was obvious that plastid morphology was strongly influenced by pyrenoid numbers since plastid lobes extended from naked pyrenoids that projected into the cytoplasm. We could not determine if all cells contained multiple pyrenoids since serial thin-sectioning was not attempted. Pyrenoids appeared variable in size in thin sections, the largest being about the same size as nuclei. Many pyrenoids showed two or more connections to the plastid lobes (Fig. 2A & B). The pyrenoids were electron dense with numerous tubular electron transparent thylakoids extending from the plastid lobes (Fig. 2A & B). Cytoplasmic starch grains commonly were associated with the pyrenoids but were also found in other cell regions. Linear arrays of electron dense globules, 40-60 nm in diameter and of unknown function, were frequently seen in random locations between the thylakoids in plastids (Fig. 2B). Peripheral thylakoids were absent (Fig. 2B & C).
Golgi bodies were found usually at the cell periphery, always in close association with a mitochondrion (Fig. 2C). Unlike most red algal unicells (Broadwater and Scott 1994), a lobed vacuolar region occurs in most cells (Fig. 2B).
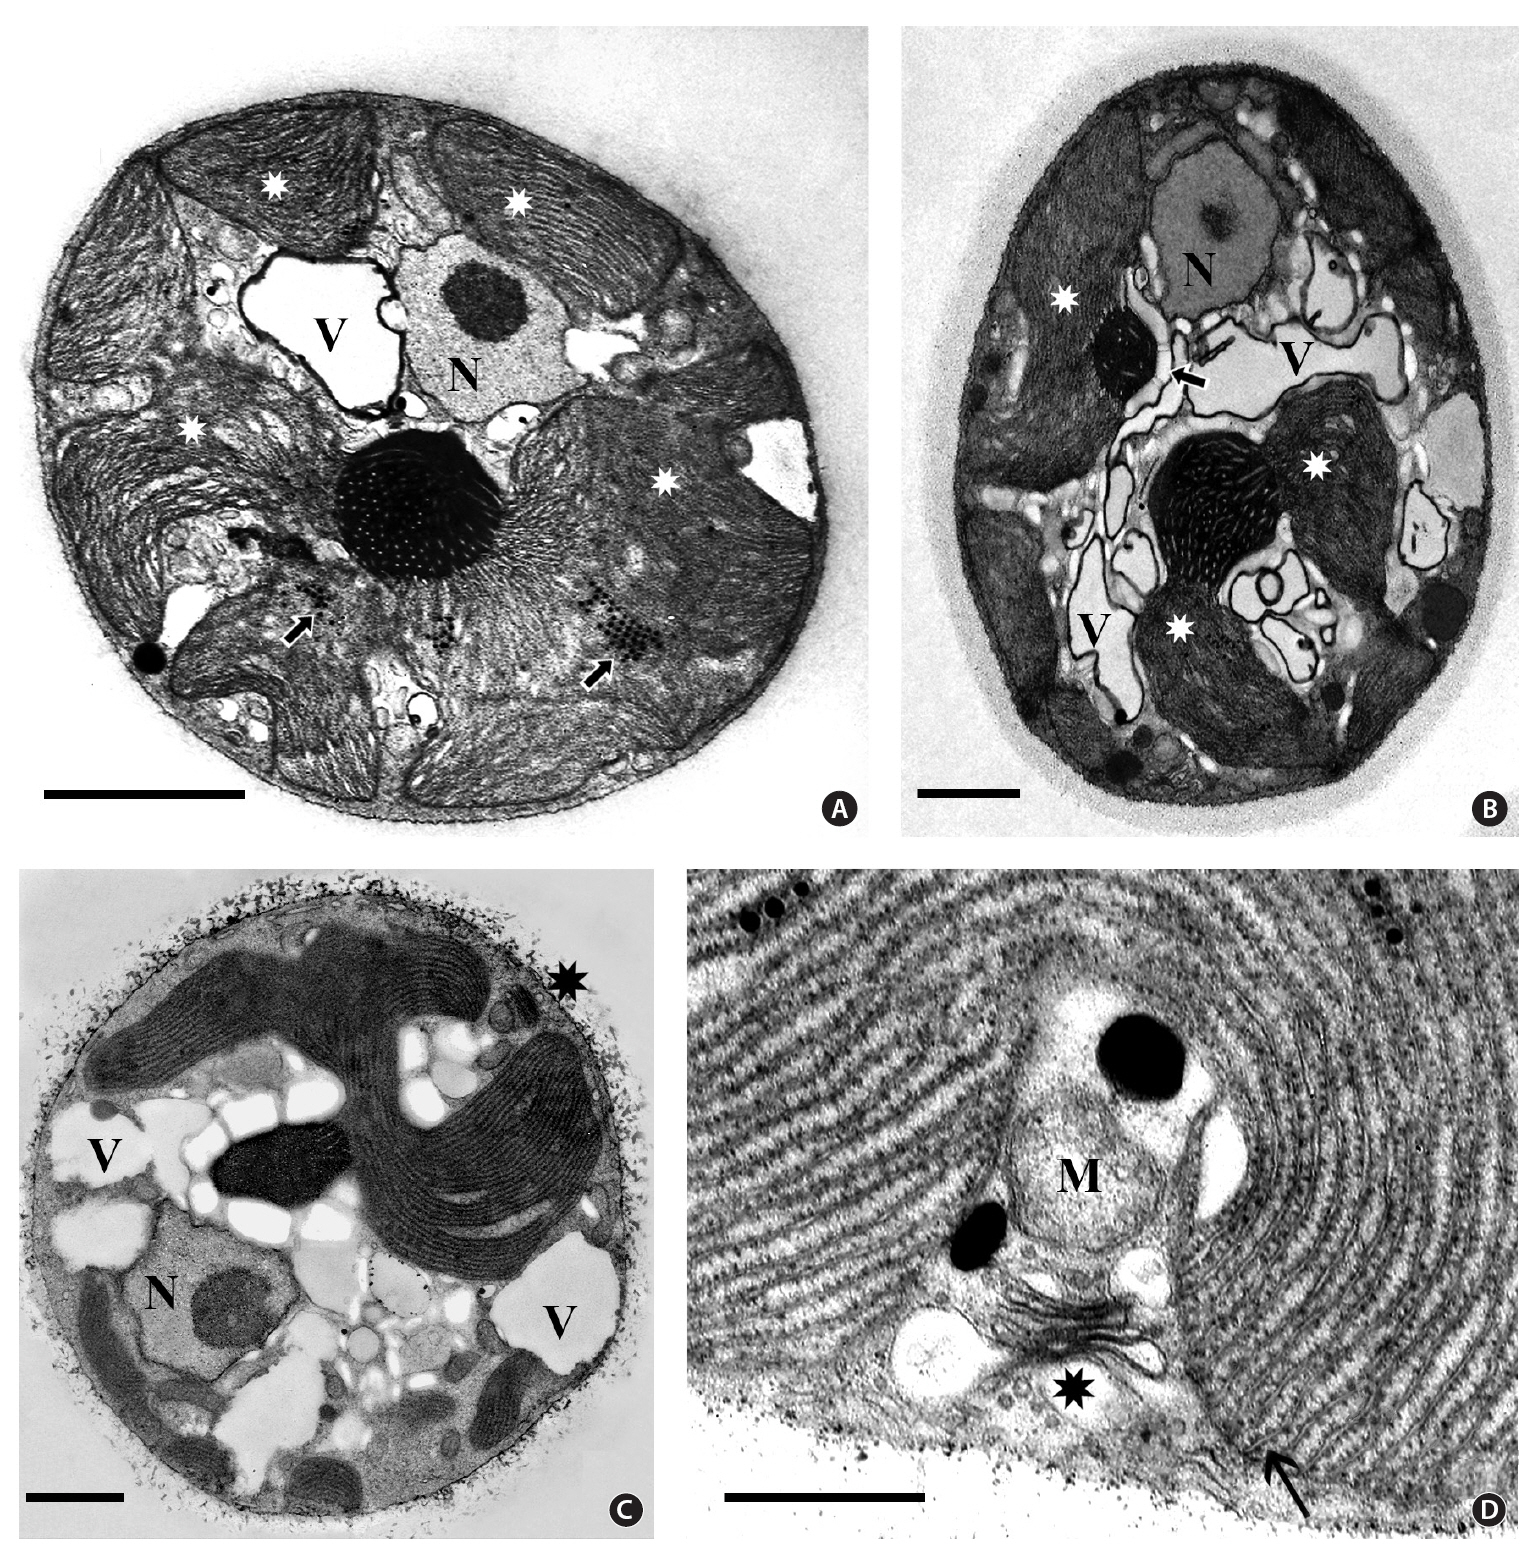
Isolate 4188 - New South Wales. Cell ultrastructure of this isolate (Fig. 3) was virtually identical to that of isolate 3904. The peripheral ER system was seen in some cells but was not well preserved. Although many sectioned cells were observed, none was seen with more than two pyrenoids. The naked pyrenoids were electron dense and filled with numerous thylakoids. Some pyrenoids (Fig. 3A & B) were associated with fewer starch grains than others (Fig. 3C). Peripheral thylakoids were not seen but hemidiscoidal phycobilisomes were more obvious (Fig. 3D) than in 3904. The nucleus was near the periphery with a single central to eccentric nucleolus (Fig. 3A, B & C) and no visible heterochromatin. Linear arrays of electron dense globules were present between thylakoids and a vacuolar region was conspicuous. Golgi bodies associated with a mitochondrion were near the cell periphery.
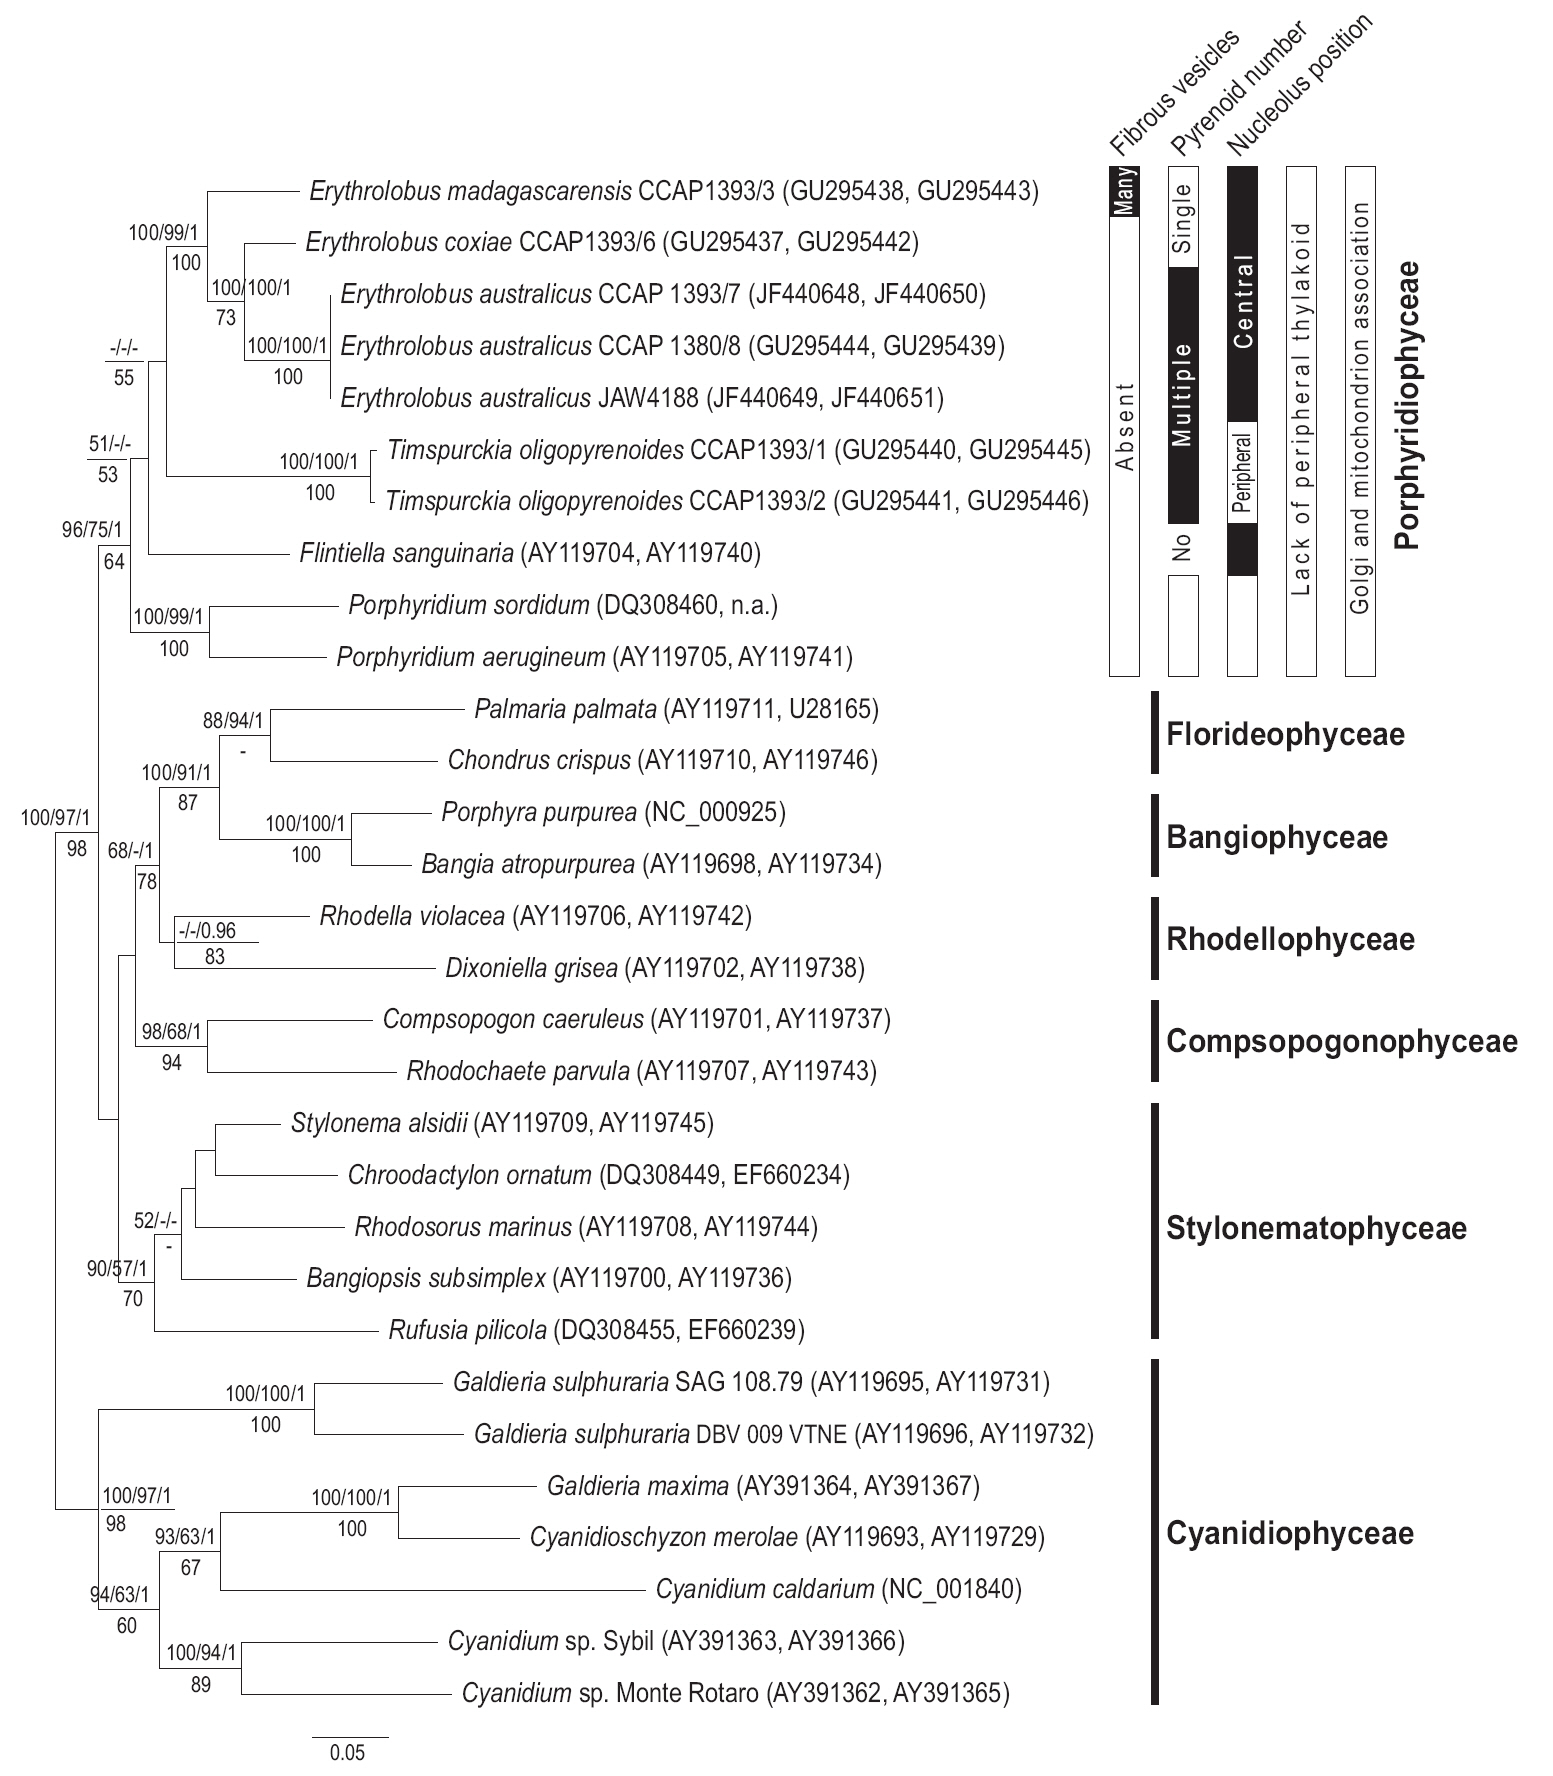
Newly determined sequences were aligned with 27 sequences from Genbank, which included seven red algal classes. The
ML phylogeny using concatenate
The LMWC data clearly indicate that members of the Porphyridiophyceae typically contain floridoside as their main LMWC along with digeneaside as a minor, sometimes even as a trace, component except in both
Although video microscopy of cell motility was not done for either 3904 or 4188 the spherical cells showed slow gliding motility. Some cells showed long polysaccharide tails. These movements were similar to those seen in the other porphyridiophycean algae,
Plastid genophores of
>
Transmission electron microscopy
TEM has significantly enhanced our knowledge about red algal unicells. Several new genera and species have been described since the middle of the 20th century and have been shown to differ, often subtly but sometimes dramatically, in their subcellular architecture. These differences, of course, have been a part of the basis for describing new taxa. More recently, molecular techniques
[Table 1.] Low molecular weight carbohydrates (LMWCs) of Porphyridiophyceae in culture

Low molecular weight carbohydrates (LMWCs) of Porphyridiophyceae in culture
have greatly contributed to unicellular red algal systematics (e.g., Yoon et al. 2006, Yang et al. 2010). Biochemistry of LMWCs also is important (Karsten et al. 1999, 2003, Scott et al. 2008, Yokoyama et al. 2009, Yang et al. 2010). These three approaches have worked in concert to establish a useful and rational explanation of unicellular red algal systematics.
Currently red algae are placed in two subphyla of the phylum Rhodophyta, the Cyanidiophytina and Rhodophytina.The three rather unusual genera,
Several ultrastructural features have proven to be of greater value than others in distinguishing the Rhodellophyceae and Porphyridiophyceae. A very simple, straight forward character is that Golgi bodies are always closely associated with a mitochondrion in the Porphyridiophyceae while they are not in the Rhodellophyceae. In the Rhodellophyceae Golgi bodies are associated either with ER or with the functionally equivalent outer membrane of the nuclear envelope (Scott et al. 2008, Yokoyama et al. 2009). Also, peripheral thylakoids are absent in plastids of all members of the Porphyridiophyceae while they are present in
Two genera of the four relegated to this class,
While evolutionarily distant from each other based on molecular analysis, at first appearance
The topology of
The monophyly of the genus
>
Low molecular weight carbohydrates
In all the Porphyridiophyceae isolates tested so far (Table 1) floridoside is the primary LMWC varying from 38 to 330 ㎛ol g-1 DW and digeneaside ranging from < 1.0 to 154 ㎛ol g-1 DW with the exception of
Floridoside is the most common LMWC and photoassimilatory product in almost all red algal orders. In contrast, members of the Ceramiales (Florideophyceae) generally synthesize and accumulate digeneaside in
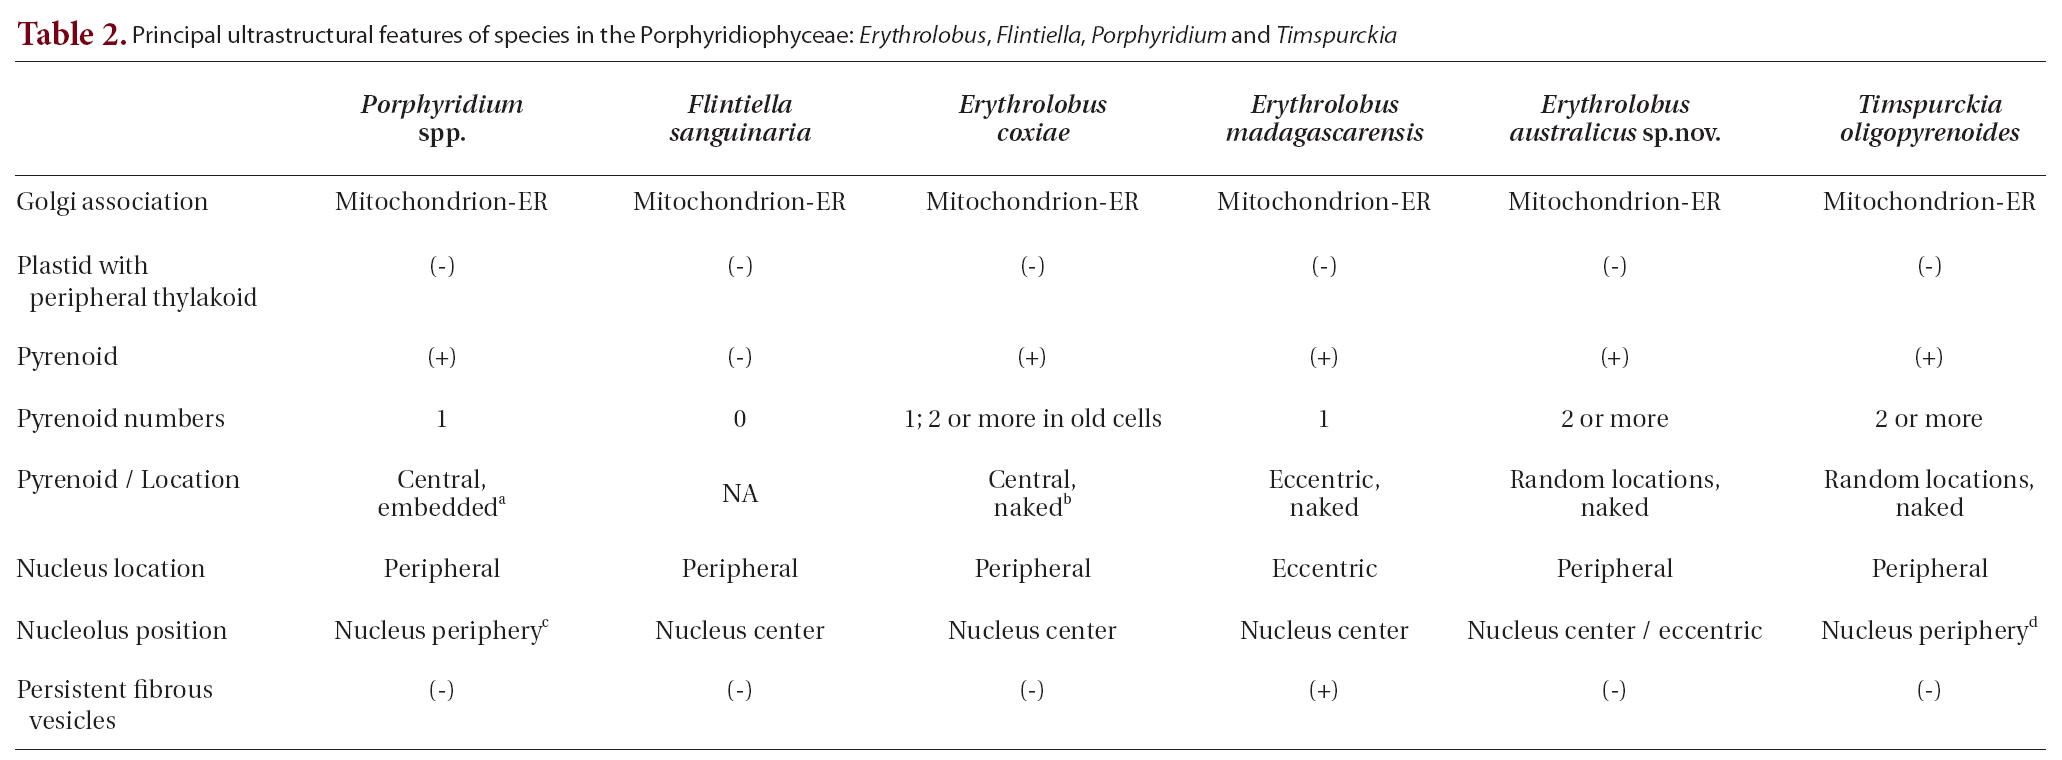
Principal ultrastructural features of species in the Porphyridiophyceae: Erythrolobus Flintiella Porphyridium and Timspurckia
stead of floridoside, and hence the latter heteroside was proposed as chemotaxonomic marker for the Ceramiales (Kremer 1978, Eggert and Karsten 2010). However, it has been demonstrated that the ceramialean genera
Nevertheless, LMWC patterns are useful in defining each of the three classes containing unicellular red algae. Digeneaside and the sugar alcohol sorbitol (
>
Appendix A. Key to Porphyridiophyceae species using ultrastructural features
1. Nucleolus appressed to nuclear envelope???????????????2
1. Nucleolus in nucleus center ???????????????4
2. Multiple pyrenoids bordering cytoplasm???????????????
2. Single pyrenoid embedded in plastid???????????????3
3. Phycobilisomes hemispherically shaped???????????????
3. Phycobilisomes hemisdiscoidally shaped???????????????
4. Pyrenoids absent???????????????
4. Pyrenoids present???????????????5
5. Predominantly multiple pyrenoids bordering cytoplasm???????????????
5. Predominantly single pyrenoid bordering cytoplasm???????????????6
6. Cytoplasm with abundant, persistent fibrous vesicles???????????????
6. Cytoplasm without abundant, persistent fibrous vesicles???????????????