The life history of Chondrus crispus Stackhouse (Irish moss) consists of isomorphic generations in which gametophytic(male and female) and tetrasporophytic thalli produce clonal individuals in which numerous fronds arise from a crustose base (Taylor 1962, Mathieson and Prince 1973, Mathieson and Burns 1975, Sharp 1987, McLachlan et al. 1989, McLachlan 1991). The thalli are perennial and have a wide range of frond sizes and morphologies, with only the few largest fronds on each thallus being reproductive (e.g., Bhattacharya 1985, Bird and McLachlan 1992). Following reproduction, the large fronds are lost from the thallus to be succeeded by other fronds that will replace them, and in turn become reproductive.The species is abundant in eastern Canada where it is economically important based on wild harvests that are collected in both Nova Scotia and Prince Edward Island for extraction of carrageenan (e.g., MacFarlane 1952,McLachlan et al. 1987, McLachlan 1991, Bird and van der Meer 1993). Furthermore, land-based aquaculture of C.crispus has proven successful in the production of food for human consumption (Acadian Seaplants Ltd., www.acadianseaplants.com).
Like other members of the Gigartinaceae, C. crispus produces different forms of carrageenan in the two life collechistory phases, i.e., primarily kappa-carrageenan in gametophytic thalli and lambda-carrageenan in tetrasporophytic thalli (Chen et al. 1973, McCandless et al. 1973, McCandless 1981, Chopin 1986). Yaphe and Arsenault (1965) initially proposed a colorometric method for distinguishing the 3, 6-anhydrogalactose that characterizes kappa-carrageenan, and this was later modified for general applications by Craigie and Leigh (1978), Dyck et al. (1985) and Garbary and De Wreede (1988). The technique has proven invaluable in many ecological studies of Gigartinaceae where there is an interest in determining the relative abundance of haploid and diploid phases and the causal factors behind apparent differences in their abundance (e.g., Bhattacharya 1985, Hannach and Santelices 1985, Lazo et al. 1989, Shaughnessy and De Wreede 1991, Scrosati et al. 1994, Dyck and De Wreede 1995, Lindgren and Aberg 1996, Scrosati and DeWreede 1999, OtaIza et al. 2001, Mudge and Scrosati 2003, Scrosati and Mudge 2004a, 2004b, Bellgrove and Aoki 2008, McLachlan et al. 2011). This methodology has proven to be equally as effective at identifying life history phase as Fourier transform infrared spectroscopy (Brown et al. 2004), and more reliable than the iridescence criterion described by Fournet et al. (1993).
Here we present an empirical study of life history phase variation over wide temporal and spatial scales in Nova Scotia. Our objective was to determine if environmental factors could be resolved as causal agents in determining the relative abundance of gametophytic and sporophytic thalli. Several previous studies suggested that wave exposure, salinity or water depth could influence relative dominance in the life history phase of C. crispus (e.g., Craigie and Pringle 1978, Lindgren and Aberg 1996, Guidone and Grace 2010). Here we evaluate these hypotheses in the context of new data from Nova Scotia and an analysis of previous accounts.
#Dedicated to the memory of Jack L. McLachlan ? friend and mentor
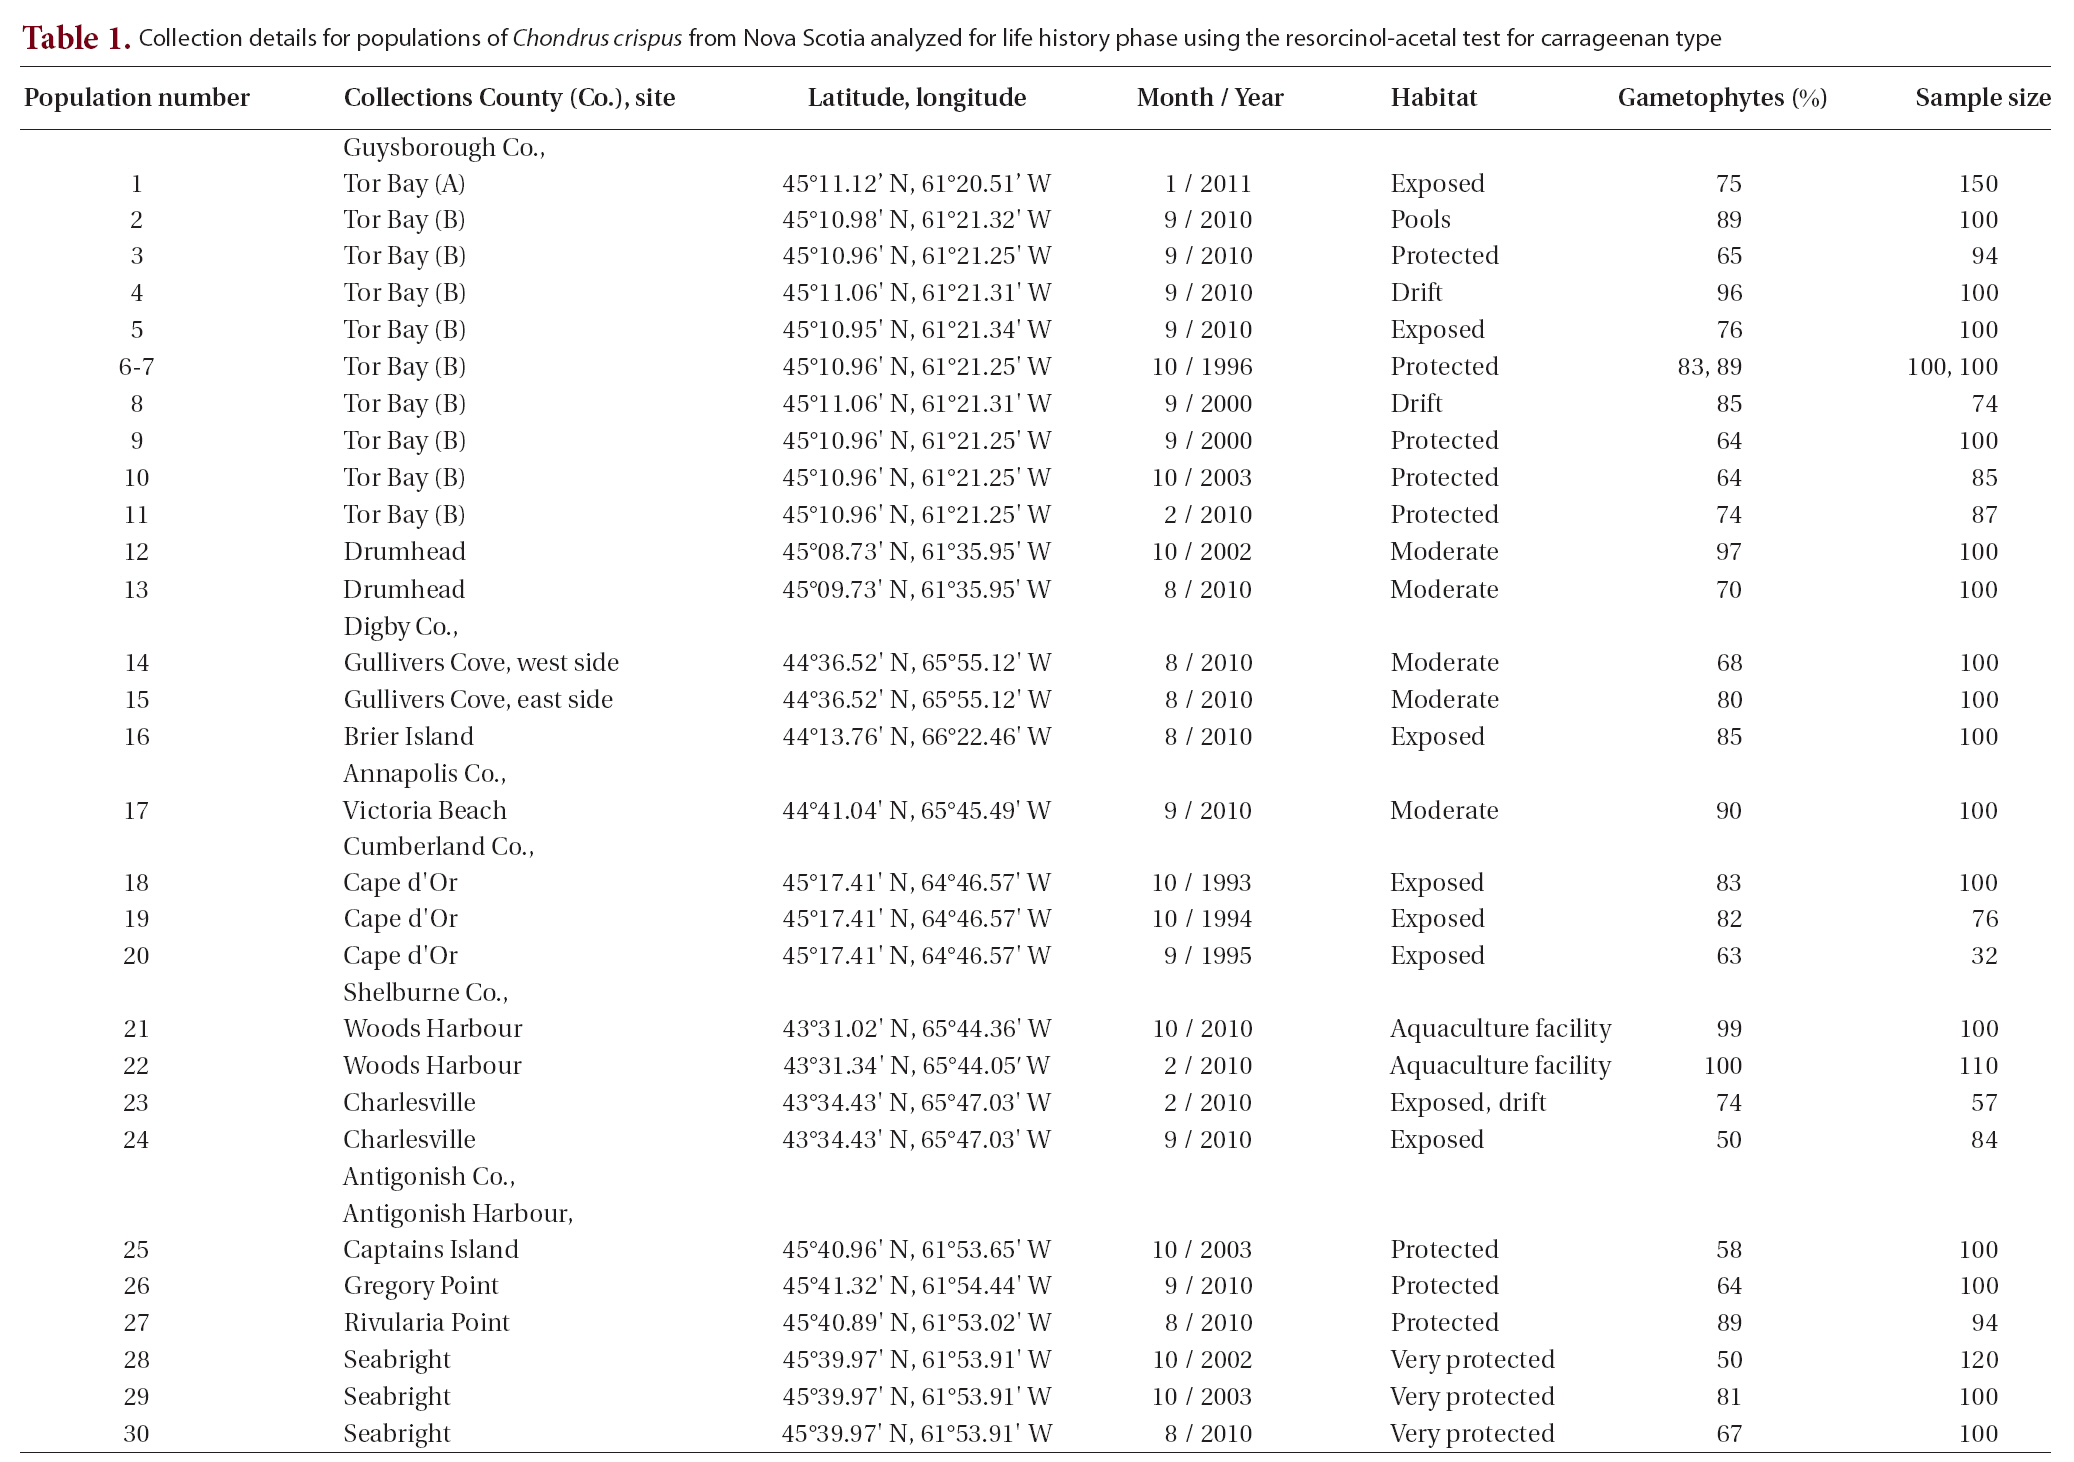
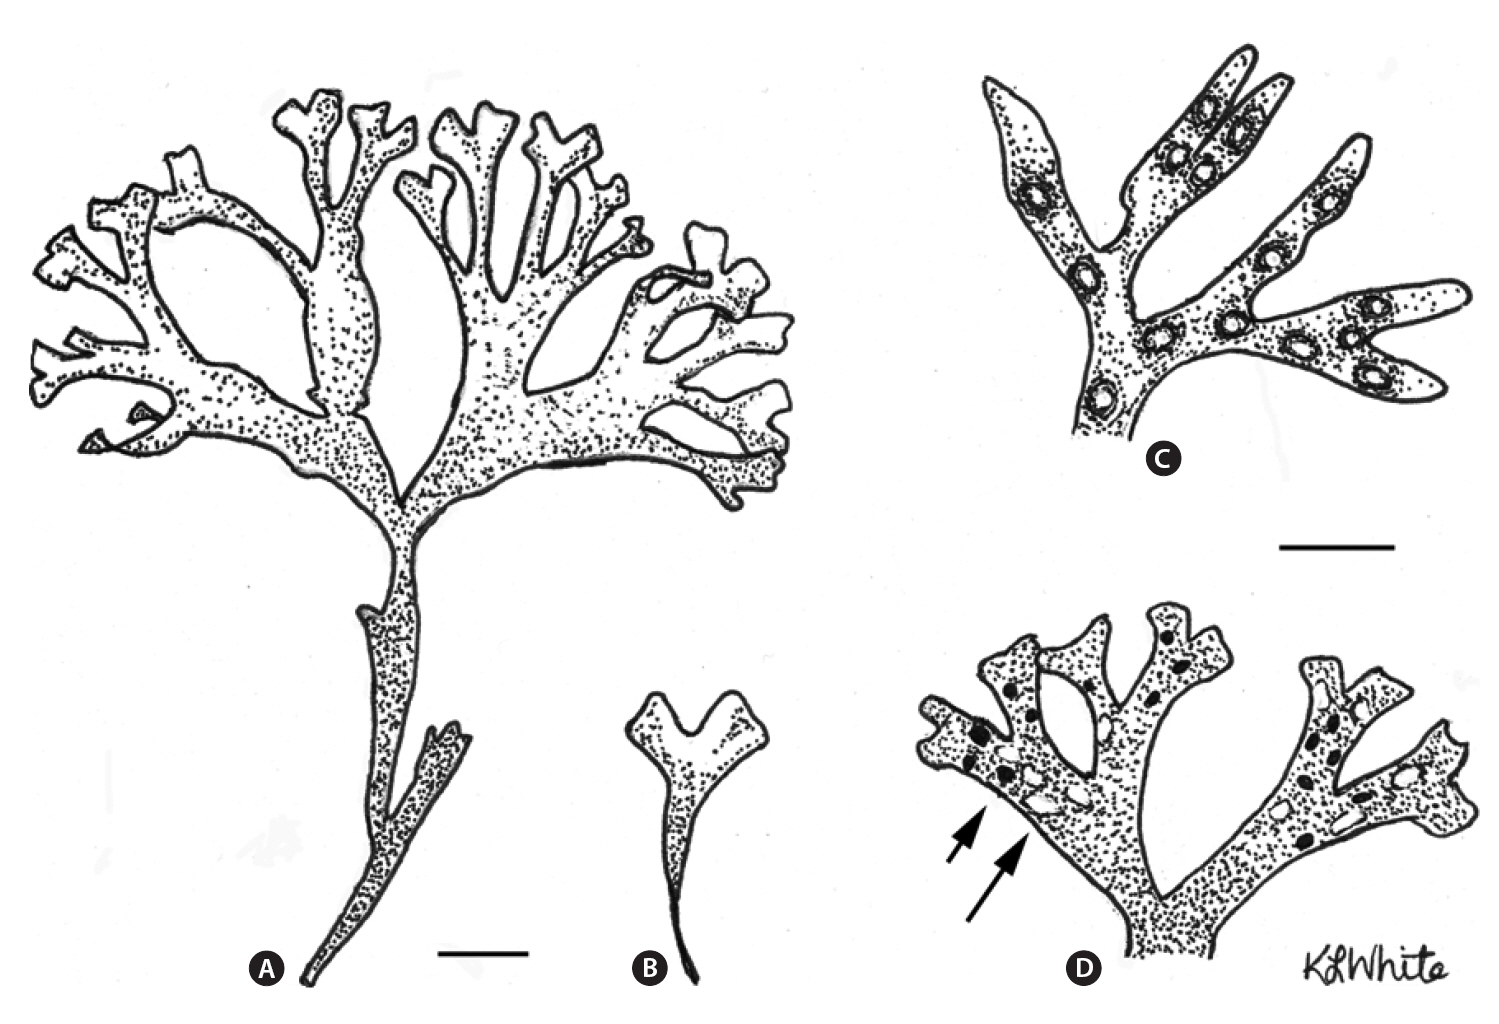
Populations of C. crispus (Fig. 1) were collected from around Nova Scotia at various times from 1993 to 2011 and at spatial scales from 10 m to over 500 km (Table 1). At most sites and times 100-150 single fronds were haphazardly collected from separate thalli at least 10 cm apart. On return to the laboratory small pieces of each frond were removed, allowed to dry on paper towels and stored at room temperature.
As a test of reproducibility of results from a given site / collection, two separate analyses were carried out. In the 62first, two collections of 100 fronds were processed from an aquaculture facility (Scotian Halibut Ltd., Woods Harbour, shelburne Co.) based on fronds originally isolated from an apparently asexual population in Basin Head, Prince Edward Island (Sharp et al. 2010), and grown in mass culture for two years. These fronds have only ever produced cystocarps and the two analyses separated by eight months showed 99 and 100% gametophytes. The single frond segment not conclusively a gametophyte gave an ambiguous result and was scored accordingly. In a second experiment, two independent lots of 100 fronds were processed from a larger collection of fronds from Tor Bay collected in October 1996. These samples gave 83% and 89% gametophytes, values not significantly different from each other (χ2 at p < 0.05). In addition to our own populations, published percentages of life history phases from previous analyses in eastern Canada and elsewhere were also evaluated to resolve whether or not particular environmental variables could be implicated as causal factors to explain the variation in abundance of life history phase.
Life history phases of fronds of C. crispus were determined based on the resorcinol method as described previously (Dyck et al. 1985, Garbary and De Wreede 1988). This is a simple chemical test in which a small piece of dried thallus (about 10 mg) is heated at 85-90°C in the presence of 1-1.5 mL of resorcinol-acetal reagent prepared according to Craigie and Leigh (1978) and Garbary and De Wreede (1988). Samples were processed in groups of 10, with additional frond pieces of known life history phase run as controls. Results from each population were expressed as percent gametophytic fronds.
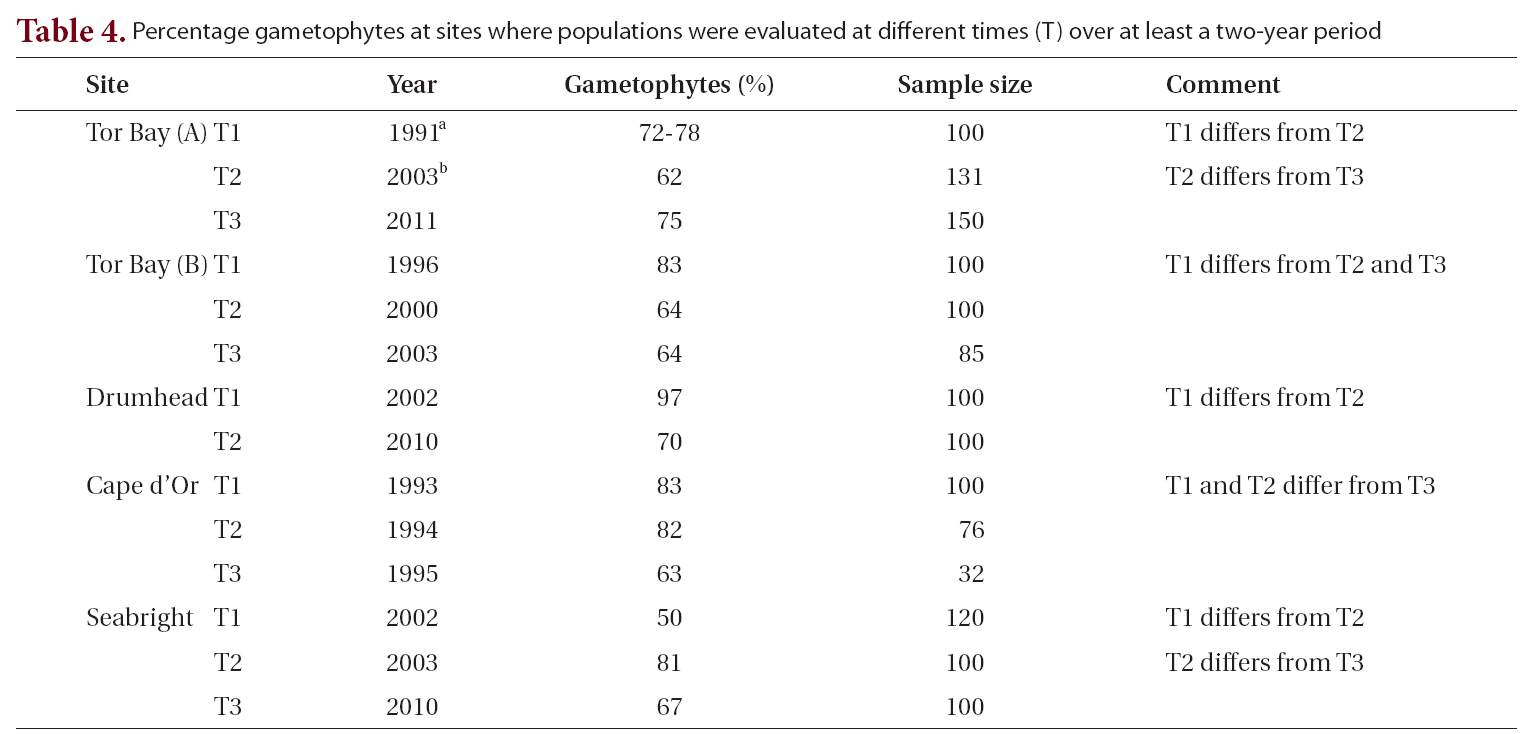
The mean percent gametophytes of the 30 populations processed was determined along with the 95% confidence interval. A series of single sample t-tests (Zar 1999) showed that this value (76.4 ± 5.2, mean ± 95% confidence interval) was significantly greater than 70 (p < 0.05). Accordingly, we ignored the question of which life history phase was dominant in a given population, as it was patently the case that gametophytes dominated these Nova Scotia populations. The evaluation of our data in combination with previously published data was to look for patterns of differential gametophyte dominance that could be related to particular environmental gradients, i.e., wave exposure, salinity and water depth. Furthermore, if environmental factors were the primary cause of different life history ratios, then we would predict that the ratios of gametophytic to sporophytic thalli would remain relatively constant at a given site. This was done at five sites, with four of these consisting of collec-
tions from three different years and time spans of two to 20 years.
To determine if different environmental variables affected the relative abundance of gametophytes, we selected relevant populations from our data set along with previously published accounts. We then evaluated the extent to which differences in ratios were present along gradients of salinity, wave exposure, and depth. To evaluate hypotheses that gradients of abundance were present, we conducted a series of χ2 analyses (Zar 1999) to determine whether differences in percentages from different pairs or groups of populations representing different ranges of a gradient were significant. In these tests, the value of one population was used as the predicted value and tested whether the other proportion was significantly different (at p < 0.05). In the temporal analysis where more than two populations were examined, the Bonferroni correction was used to avoid Type I error (Quinn and Keough 2002).
The 30 populations from six counties of Nova Scotia collected over a 20-year period from diverse habitats showed extensive variation in the ratio of gametophytic to tetrasporophytic fronds. While the mean was 77% gametophytic fronds (with 95% confidence intervals ± 5%), most samples had 67-89% gametophytic fronds (Table 1). Only three populations were below 60% gametophytes, and none of the collections showed a dominance of tetrasporophytes. Thus most of the samples ranged from a ratio of about 2 : 1 to 9 : 1 (gametophytes : sporophytes). Use of χ2 statistic to compare pairs of values showed that differences of 10% were sufficient to show significance at p < 0.05.
The lowest value of 50% gametophytic fronds was found twice. One site was a wave exposed shore at Charlesville (September 2010). These fronds were collected near the upper limits of their distribution on the shore from beneath a canopy of Ascophyllum nodosum. This collection with its low sample size (n = 50) may not
be representative of the general community at Charlesville as evidenced by a collection seven months previous (i.e., February 2010) taken from the drift that gave 74% gametophytes (Table 1). The second collection of 50% gametophytes came from an estuarine site in Antigonish Harbour; this population was significantly lower than two other collections from the same site taken in different years (i.e., 67%, 81%).
Another low value for gametophyte dominance (i.e., 58%) came from near Captains Island, in Antigonish Harbour. This is an estuarine site adjacent to the main channel through the harbour. The C. crispus is permanently submerged and grows on rocks in a bed of Zostera marina. Here, thalli are challenged by strong currents, low wave action and occasional periods when the salinity can drop to 10 psu or less. Ice scour during spring break up would be a major stress on this population. Two other populations from nearby areas in Antigonish Harbour grew on shallow subtidal rocks and gave higher values (i.e., 64%, 89%). The remaining samples in Antigonish Harbour (all at Seabright) are extremely protected from wave exposure, and their location further up the estuary would give greater exposure to low salinities (i.e., <10 psu during spring runoff and following heavy rains). The three values for this site at 50%, 67% and 81% gametophytes were all significantly different from each other (p < 0.05), and the high value also differs from the Captains Island sample (Table. 1 & 2).
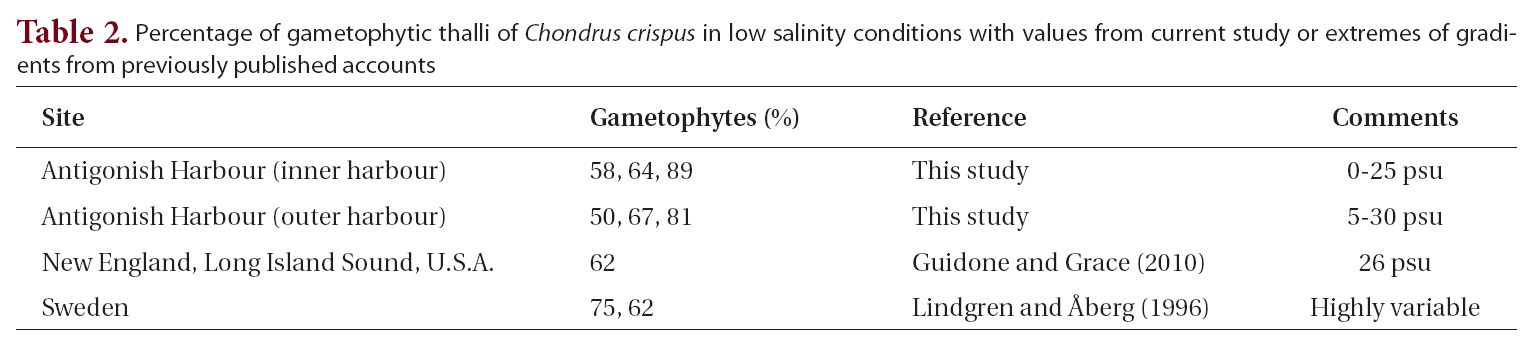
The possibility that estuarine, or low salinity conditions might influence gametophyte:sporophyte ratios was examined by taking all of our samples from Antigonish Harbour where salinities can vary from 0-28 psu and combining these with the values from low salinity samples in the literature (Table 2). These nine values were then compared with the overall mean from our complete data set of 30 samples. The mean of the low salinity sites was 68 ± 12% (mean ± standard deviation). A t-test showed no significant difference between these populations and the overall mean in our entire analysis. A further attempt
to resolve a salinity gradient within Antigonish Harbour, performed by separating populations from the more saline outer harbour (58%, 64%, 89% gametophytes) from the more brackish inner harbour (50%, 67%, 81% gametophytes), showed no apparent trend with salinity.
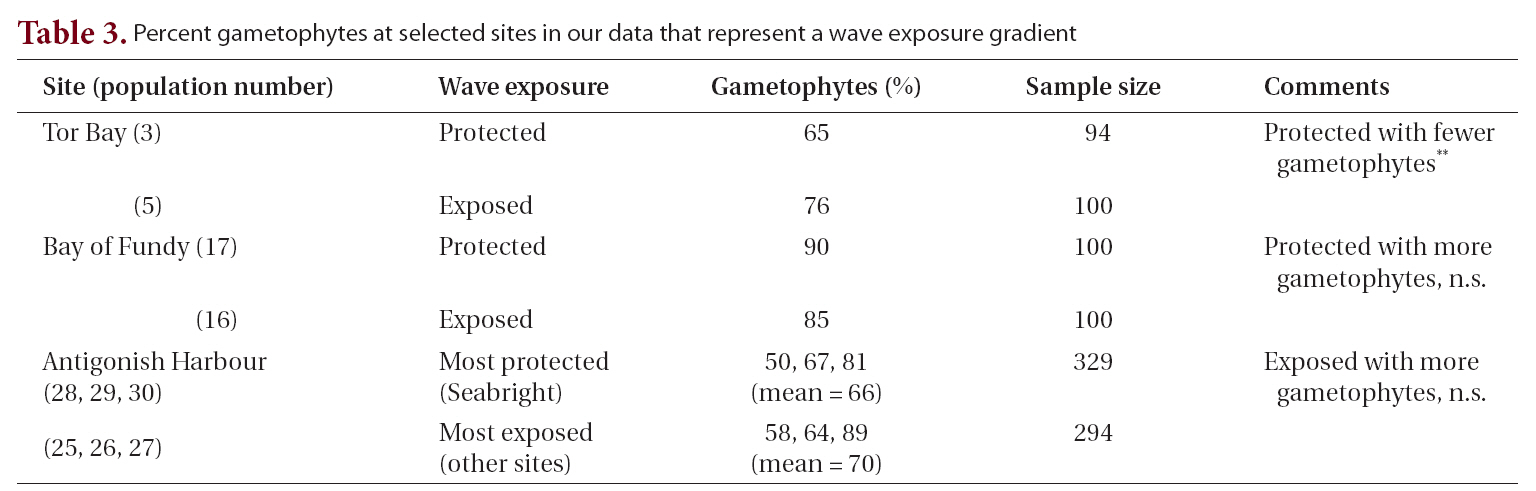
The possibility that life history phase was modified by wave exposure was examined in three sets of populations from Tor Bay, the Bay of Fundy and in Antigonish Harbour (Table 3). Within each region the pairs of populations (wave protected vs. wave exposed) were collected in the same season. At Tor Bay where the two populations were selected along the wave exposure gradient of Heaven and Scrosati (2008), the protected site had fewer gametophytes (significant at p < 0.05) whereas the difference in values from the other sites was not significant.
The most intensively sampled location temporally (i.e., 1996-2011), spatially (ca. 1 km) and ecologically (i.e., wave protected to wave exposed, rock pools to low intertidal and drift) was at Tor Bay, a fully marine area on the Atlantic coast. Values ranged from 64 to 89% gametophytes for attached populations, and two drift collections had values of 85% and 96% gametophytes (Table 1). Additional samples from Tor Bay by Scrosati et al. (1994) and Scrosati and Mudge (2004a) extended the temporal sampling to 1991 and provided an additional intermediate sample from 2003 (Table 4). Even excluding the high intertidal rock pool population (89% gametophytes) and the two drift collections (85% and 96% gametophytes), temporal sampling and populations collected over a wave exposure gradient showed significant differences. Thus, the remaining collections had a strong dominance of gametophytic thalli with the lowest value (64%) not significantly different from 2 : 1 (gametophytes : sporophytes).
Other sites (Drumhead, Charlesville) along the Atlantic coast of Nova Scotia showed a similar pattern of strong gametophytic dominance as well as significant differences in the proportions of gametophytes among collections. The two collections from Drumhead (70% and 97% gametophytes) are consistent with other values from the Atlantic coast of Nova Scotia by Bhattacharya (1984) (90-93% gametophytes) and McLachlan et al. (2011) (58-92% gametophytes).
Our collections from fully marine sites in the Bay of Fundy showed variation from 63-90% gametophytes, i.e., ca. 2 : 1 to 9 : 1. Significant differences occurred with small spatial separation (i.e., east and west sides of Gullivers Cove, 80% and 68% gametophytes, respectively) and with temporal sampling over one year (63 to 83% gametophytes).
Gametophytic thalli clearly dominate in Nova Scotian populations of C. crispus. While individual populations and sites in Nova Scotia may have near equality of phases or tetrasporophyte dominance (e.g., Craigie and Pringle 1978), these are clearly exceptions. Thus, means of multiple populations from our study across ranges of environments gave values of 66-76% gametophytes. Furthermore, many sites in the literature show ?90% gametophytes (e.g., Bhattacharya 1984, 1985). A simple explanation for the dominance of gametophytes over tetrasporophytes derives from the fact that C. crispus forms both male and female thalli. Since only the female and tetrasporophytic thalli produce spores (i.e., cystocarps and tetrasporangial sori, Fig. 1), and since some of the gametophytes would be expected to be males (Chen and McLachlan 1972, Taylor and Chen 1973), then a ratio of 2 : 1 (gametophyte : sporophyte) could be expected if males and females occurred in equal numbers (but see Mathie-
son and Prince 1973). The underlying assumption here is that female gametophytes (i.e., carpospore producing) and tetrasporophytes have equivalent fecundities. This assumption is consistent with results of Bhattacharya (1984, 1985) and Ferna ndez and Menendez (1991). Given the similarities in size and shape of cystocarpic and tetrasporophytic fronds, and the apparent absence of biomechanical properties leading to selective frond removal that might be associated with carrageenan differentiation in C. crispus (Carrington et al. 2001), gametophytic dominance of 2 : 1 would be an expected ratio. The biomechanical properties of life history phases in Gigartinaceae cannot be entirely excluded as a potential explanation, as they were correlated with distributions of Mazzaella spp. (Shaughnessy et al. 1996, Mach 2009) and C. verrucosus (Bellgrove personal communication). Regardless, we did not find any association between wave exposure and phase ratios in C. crispus.
Developing a realistic model that explains life history demography of C. crispus is problematic. We have limited data on the fecundity of tetrasporophytic and cystocarpic thalli. Also lacking are factors that might differentially affect tetraspore and carpospore viability on a seasonal basis and their subsequent survival as they interact with each other, and in a complex biotic and abiotic environment. These factors were emphasized in theoretical models developed by Scrosati and DeWreede (1999), Fierst et al. (2005) and Thornber and Gaines (2003, 2004). There have been attempts to deal with these issues specifically in C. crispus from Nova Scotia and northern Spain (Bhattacharya 1984, 1985, Fernandez and Menendez 1991, Scrosati et al. 1994). The latter concluded that spore production in the two phases was roughly equivalent (8 × 10¹⁰ m-2 y-1), and Bhattacharya (1984) concluded with Nova Scotia populations that “the numerical dominance of haploid fronds was established during the initial stages of sporeling growth.” Nonetheless, a culture study by Scrosati et al. (1994) found that tetraspores were more viable than carpospores, and Lindgren and Aberg (1996) found greater incidence of reproductive structures on tetrasporophytic plants than on gametophytes.
Populations collected from the drift high in gametophytes may be explained by the tendency of gametophytic plants to degenerate more readily than tetrasporophytes. Bhattacharya (1984) found survivorship of tetrasporophytes to be greater than cystocarpic plants observed simultaneously. A population of C. crispus occurring at Basin Head, Prince Edward Island, Canada is more than 99% gametophytic, reproducing vegetatively (Sharp et al. 2010).
Two other studies of C. crispus were conducted at Tor Bay approximately 1 km east of the current concentration of sampling sites. Scrosati et al. (1994) found 72-78% gametophytes in three monthly samples in 1991. Resampling of the same area in 2003 gave 62% gametophytes (Scrosati and Mudge 2004b). The first set of samples fall within the mean and 95% confidence interval for all our analyses. χ2 analysis demonstrates that the 2003 collection is significantly different from the average of the 1991 population. The intervening period between 1991 and 2003 had at least two major environmental disturbances from pack ice and a severe fall storm. The former removed much of the vegetation in the lower intertidal zone, whereas the latter destroyed a seashore boardwalk and carried major pieces at least 100 m into spruce forest (Garbary, unpublished observations). Resampling of the same site in 2011 (population 1, Table 1) showed that the site had returned to the original values from 1991.
Wave exposure has been implicated as a regulatory mechanism for abundance of life history phases in Mazzaella species (Mudge and Scrosati 2003, Scrosati and Mudge 2004a). Two of our samples at Tor Bay (samples 3 & 5, Table 1) were specifically chosen to represent the extremes of the wave exposure gradient defined by Heaven and Scrosati (2008). These two samples yielded 69% and 76% gametophytes (i.e., from 2 : 1 to 3 : 1, not significant at p ? 0.05) for the protected and exposed samples, respectively, and are nowhere near the extremes represented in our data and in the literature (i.e., almost 1 : 1 to ?9 : 1). Table 3 summarizes our data on wave exposure and life history phase in C. crispus, and we did not recover any consistent trend.
The possibility that there might be a depth gradient for abundance of gametophytic thalli in Irish moss was proposed by Craigie and Pringle (1978). While they found an increase in tetrasporophytes with depth in Nova Scotia and Prince Edward Island, more comprehensive sampling by Lazo et al. (1989) did not uncover this pattern. This pattern was also not apparent in the subtidal sampling of Chopin et al. (1988), who found an increase in tetrasporophytes in a bed of C. crispus that had been dragraked. Bhattacharya (1984) also found extremely high gametophyte abundance (i.e., ?90%) in both subtidal and intertidal samples much like a similar sampling by Wright (1981; not seen, cited by Bhattacharya 1984).
Given that conspicuous gametophyte dominance is the rule in C. crispus (i.e., 2 : 1 or greater), how can we account for those samples in which the ratio is skewed towards 1 : 1 or has a dominance of tetrasporophytes as in Lazo et al. (1989)? We suggest two mechanisms: one based on occasional catastrophic loss of localized populations, and the second based gradual spread at the periphery of established populations. Catastrophic loss might occur from storm damage or major ice abrasion. The bulk of the remaining thalli will be gametophytic; hence the potential spore rain will be largely comprised of carpospores that will produce tetrasporophytic thalli. The sporadic nature of the tetrasporophyte dominated samples (e.g., Craigie and Pringle 1978, Lazo et al. 1989, Guidone and Grace 2010) may be accounted for by stochastic events that created new space for colonization. This was also suggested by Lindgren and Aberg (1996), and demonstrated experimentally by Bhattacharya (1984) who cleared space in the upper part of the C. crispus zone with a high proportion of gametophytes (95%); this space was recolonized by a population with a much lower proportion of gametophytes (63%).
Our explanation is consistent with the conclusion of Lazo et al. (1989) and McLachlan et al. (2011) to account for the near equality and occasional predominance of tetrasporophytes in Prince Edward Island. Here new space for colonization is being produced because the sandstone is so friable and whole thalli are being removed along with the underlying substratum. Parker and McLachlan (1990) also showed that large proportions of the C. crispus population are epiphytic on the crustose coralline Phymatolithon, that may also shed whole cell layers along with the epiphytic Irish moss.
A second mechanism that could be responsible for tetrasporophyte dominance involves the periphery of a population that is undergoing gradual spread. Such spread might be a consequence of environmental change (e.g., climate change or competitive interactions). In such situations the marginal sites would have a greater spore rain of carpospores from the gametophyte dominated population as in Bellgrove and Aoki (2008). This could account for the tetrasporophyte dominated populations at the deeper edges of beds in Prince Edward Island (Craigie and Pringle 1978). It could also explain the 50% gametophytes from the September 2010 population at Charlesville. This population was collected from the upper margin of the C. crispus zone when fronds were difficult to reach because an incoming tide precluded collection from the lower part of the C. crispus zone. Sea level rise on gradually sloping shores could theoretically produce the necessary new habitat for colonization.
Over time, we suggest that, barring a high frequency of catastrophic events, that populations that were initially tetrasporophyte dominated, would subsequently return to the 2 : 1 (or higher) ratio that characterizes most populations. In light of the inability to relate relative abundance of a life history stage of C. crispus to environmental gradients of depth, salinity or wave exposure, we suggest that such adaptive gradients do not exist, and that a dominance of gametophytes (2 : 1 or higher) represents the equilibrium for this species. Furthermore, we suggest that studies of C. crispus or other species using populations from only a few sites risk recovering purely stochastic differences that do not test the adaptive significance of life history phase to the very real environmental
gradients to which they are being related. This is consistent with the temporal variation we found in that all five sites sampled in more than one year showed significant differences among years (Table 4). Our study shows that changes in periods as short as one year may lead to significant changes in the proportion of life history phases, and that these changes may be greater in extent than differences associated with environmental gradients.
We suggest a series of environmental and biotic factors that might account for these stochastic changes. First, storm action can severely modify the lower intertidal zone by displacing boulders into or out of the habitat or even just turning them over. Secondly, ice scour from pack ice can effectively remove a large expanse of intertidal algae. With respect to biotic factors, abundant sea urchins can effectively remove the entire flora from the subtidal zone. This will leave intertidal populations of C. crispus that may have extremely high percentages of gametophytes (i.e., 90% or more) that will recolonize tetrasporophytes. A second biotic factor that may contribute to dominance of gametophytes in C. crispus is the differential impact of green algal endophytes that have greater negative effects on tetrasporophytic thalli (Correa and McLachlan 1992). While these are independent processes, they may function synergistically to create the gametophyte dominance that is apparent in Nova Scotia.