Coarse woody debris (CWD) is an important component of temperate forest ecosystems, and is relevant to biomass, habitats for plants, animals, and microorganisms,the nutrient cycle, and micro-geomorphology(Sollins 1982, Harmon et al. 1986). In particular, CWD performs an important function as a long-term carbon stock in the terrestrial carbon cycle because of its slow decomposition and long residence time (Harmon et al.1986, Ganjegunte et al. 2004, Zhou et al. 2007, Garrett et al. 2008). Therefore, the National Greenhouse Gas Inventory Report for the Intergovernmental Panel on Climate Change (IPCC) requires a carbon stock of dead wood,which is one of the forest carbon stocks contained in forest ecosystems (Intergovernmental Panel on Climate Change 2006). Additionally, CWD dynamics reflect regeneration and succession processes in forests (Sturtevant et al. 1997, Motta et al. 2006).
CWD studies have generally focused on managed forests in which harvesting, clear cutting, or thinning have been practiced (Stone et al. 1998, Pedlar et al. 2002, Densmore et al. 2004, Janisch et al. 2005). However, only limited study has been conducted thus far into mass dynamics in natural forests (Carmona et al. 2002, Wilcke et al. 2005, Sefidi and Marvie Mohadjer 2010). Additionally, little data is currently available on CWD in Korea, although some previous studies have been conducted on this subject (Jang and Youn 2003, Kim et al. 2006, Noh et al. 2010). Thus, the study of CWD mass and its dynamics on temperate natural forests in Korea is clearly important.
For the measurement of CWD dynamics, chronosequencing and long-term survey methods are generally used (Harmon and Sexton 1996, Tobin et al. 2007). The chronosequence method could be readily applied to trace the long-term CWD dynamics when the age of CWD and several sites of comparable conditions are available (Sturtevant et al. 1997, Idol et al. 2001, Carmona et al. 2002, Tobin et al. 2007, Sefidi and Marvie Mohadjer 2010). However, the chronosequence method is difficult to apply in natural forests because CWD in natural forests is not composed of homogenous age, history, and species. Moreover, the environmental conditions for each forest are hardly comparable. Thus, long-term surveys conducted in Long-Term Ecological Research (LTER) sites are clearly necessary for CWD mass dynamics studies in natural forests.
In this study, CWD mass dynamics in three temperate natural forests dominated by
Study site
This study was conducted on the KNLTER site of Mt. Jumbong (38°0'-38°5' E, 128°25'-128°30' N,) located in
[Table 1.] Characteristics of three forests at KNLTER site of Mt. Jumbong
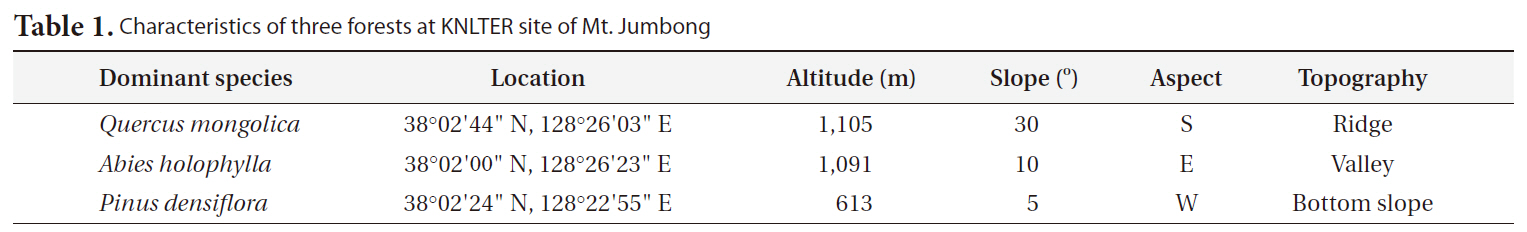
Characteristics of three forests at KNLTER site of Mt. Jumbong
the Mt. Sorak Biosphere Reserve, designated by United Nations Educational, Scientific and Cultural Organization (UNESCO) in 1982 (http://www.unesco.org). At Mt. Jumbong, undisturbed and mature natural forests have developed well, allowing a variety of forest ecological studies including vegetation (Cho 1999, Lee and Cho 2000), regeneration (Kim and Kim 1995, Suh and Lee 1998), succession (Kim and Kim 1995, Lee et al. 2000, Jin and Kim 2005, 2006), and soil respiration (Kang et al. 2003) to be conducted. This site was included as one of the KNLTER sites since 2003 under the auspices of the KNLTER research project (http://www.knlter.net). The 30-year (1970-2000) mean temperature and annual precipitation of Inje, where the closest meteorological station from Mt. Jumbong is located, were 9.9°C (monthly mean temperature ranging from -5.2°C to 23.1°C) and 1,114 mm, respectively (http://www.kma.go.kr).
To compare the differences in CWD dynamics among forests of Mt. Jumbong, three forests were selected (Table 1). The first was a naturally regenerated deciduous forest dominated by
>
Field survey and CWD sampling
In each forest, plots of different number and size were designed based on the forest structure and CWD distribution. In the
Two 20 m × 20 m plots and one 10 m × 10 m plot with an area of 0.09 ha for the
>
Determination of initial CWD volume and mass
CWD mass was calculated from its initial volume and the wood density of cross-sections sampled every 6 months. The initial volume of logs and stumps was calculated via Newton’s formula (Harmon and Sexton 1996) which requires length and diameter measurements at three positions (base, middle, and top):
V = L(A
in which
V = BA × H × 0.5
in which
The volume and dry weight of cross-sections were measured in order to calculate the wood densities. Diameters of each sample were measured at three points (base, middle, and top) with digital calipers and then their volumes were calculated. The samples were dried at 75°C to a constant mass and weighed. The wood density was calculated as the dry mass divided by the volume of each sample
>
Analysis of CWD mass dynamics
The CWD mass obtained using the initial volume of CWD and wood density of each sample was classified into forest type, season, species, CWD type, and decay class. CWD mass input was calculated from the sum of newly tagged and recorded CWD mass at each survey. The mass loss rate of CWD was estimated from the difference in CWD mass between each survey interval. The decay rate constant was estimated based on a single exponential model:
where
All descriptive statistics and natural logarithmic regression analysis to examine the relationship between decay class and wood density of CWD were conducted using SAS ver. 9.2 (SAS Institute Inc. 2009).
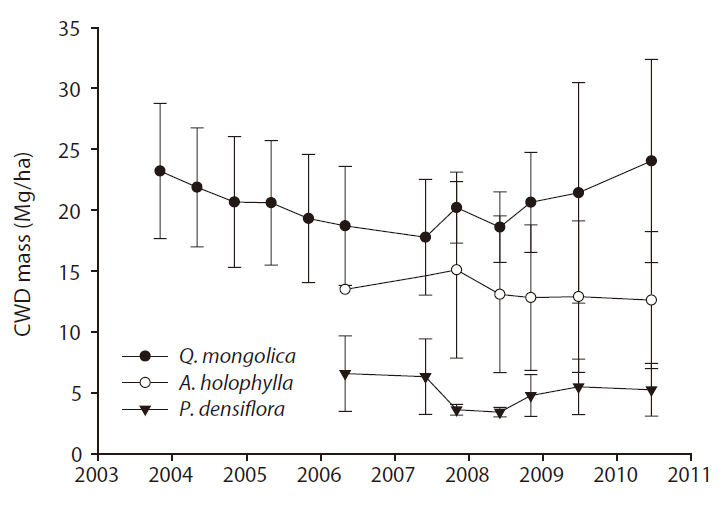
CWD mass (Mg/ha) ranged from 17.7 to 24.0 for the
The input rates of CWD mass (Mg ha-1 y-1) for the
y-1) were 1.07 for the
Table 3 describes the contribution of CWD by species for each forest.
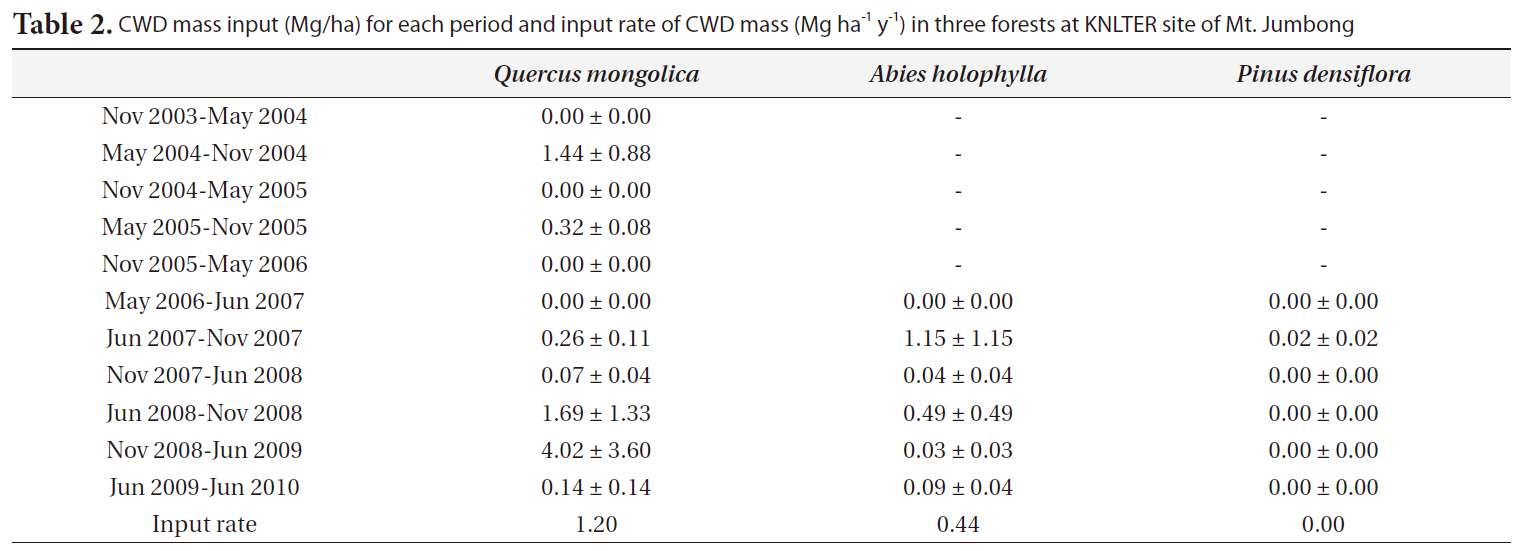
CWD mass input (Mg/ha) for each period and input rate of CWD mass (Mg ha-1 y-1) in three forests at KNLTER site of Mt. Jumbong
proportion (1.8%) of the total CWD mass, considering that they occupied a large proportion (20.3%) of the total number of CWD pieces. In the case of the <
CWD mass by CWD type differed greatly among the three forests (Table 4). The proportion of CWD mass for logs was much higher than the other CWD types in the
The distribution of CWD by decay classes for three forests in each period is shown in Table 5. In general, class II and class III comprised the majority of CWD mass in the
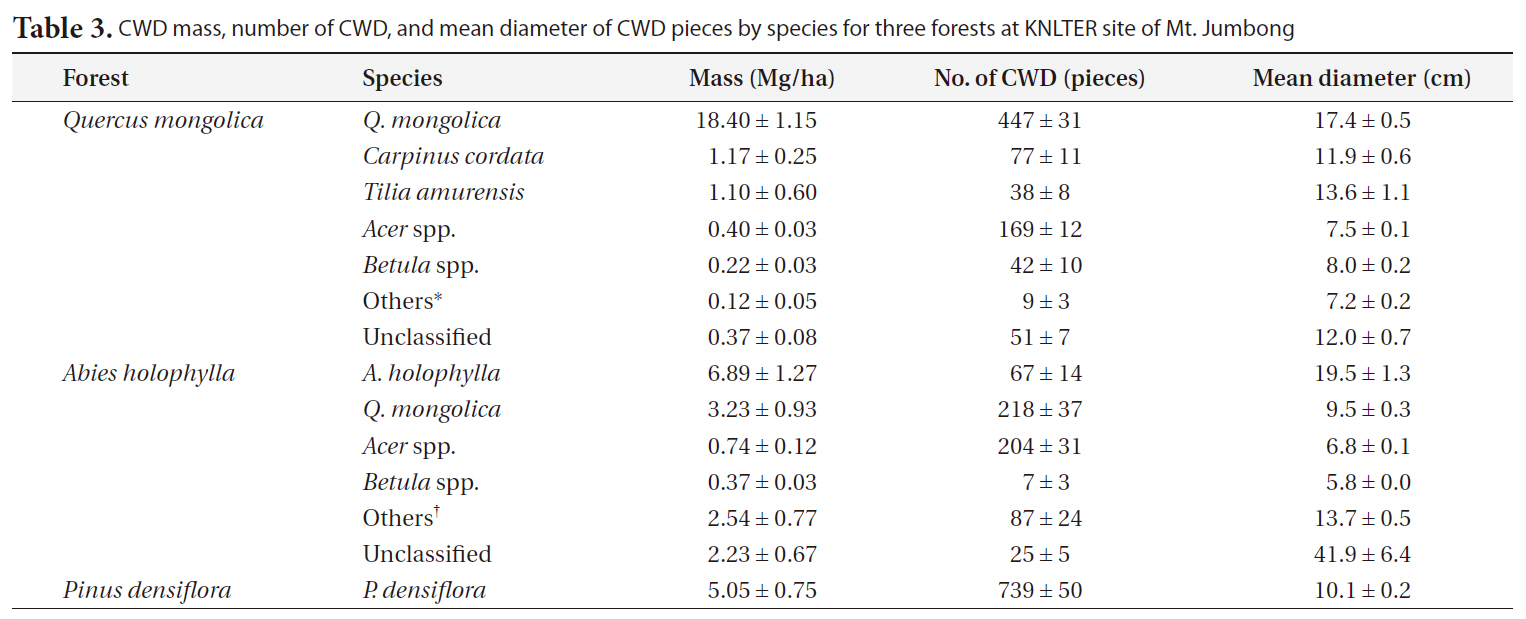
CWD mass number of CWD and mean diameter of CWD pieces by species for three forests at KNLTER site of Mt. Jumbong
[Table 4.] CWD mass and number by CWD types for three forests at KNLTER site of Mt. Jumbong
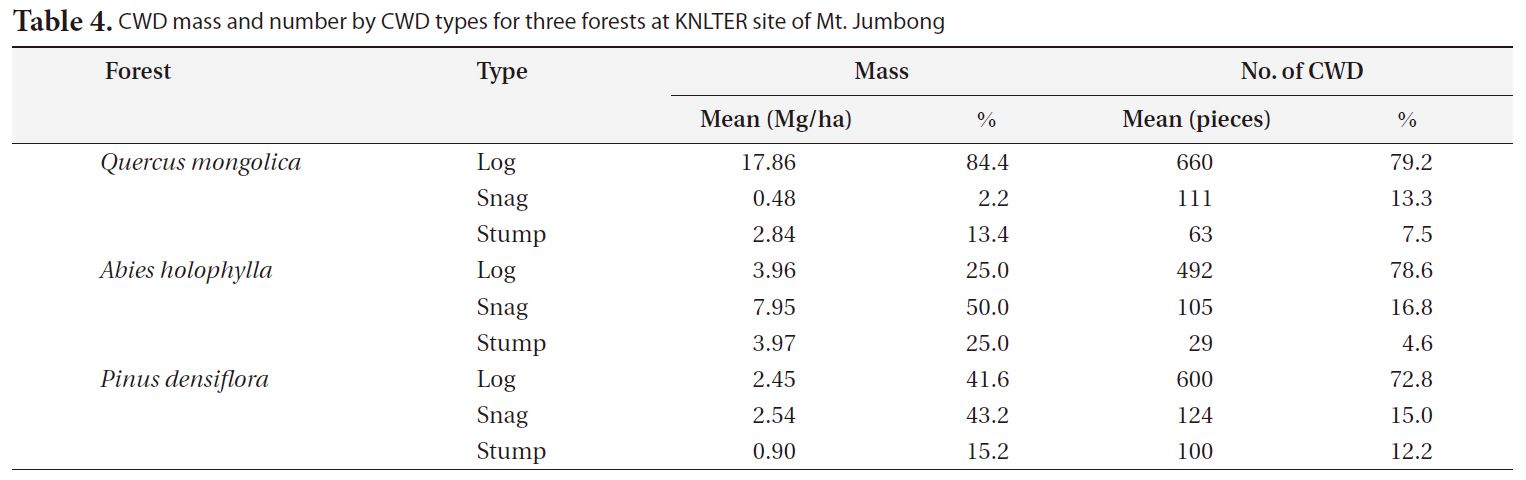
CWD mass and number by CWD types for three forests at KNLTER site of Mt. Jumbong
[Table 5.] CWD mass (Mg/ha) by decay class for three forests at KNLTER site of Mt. Jumbong
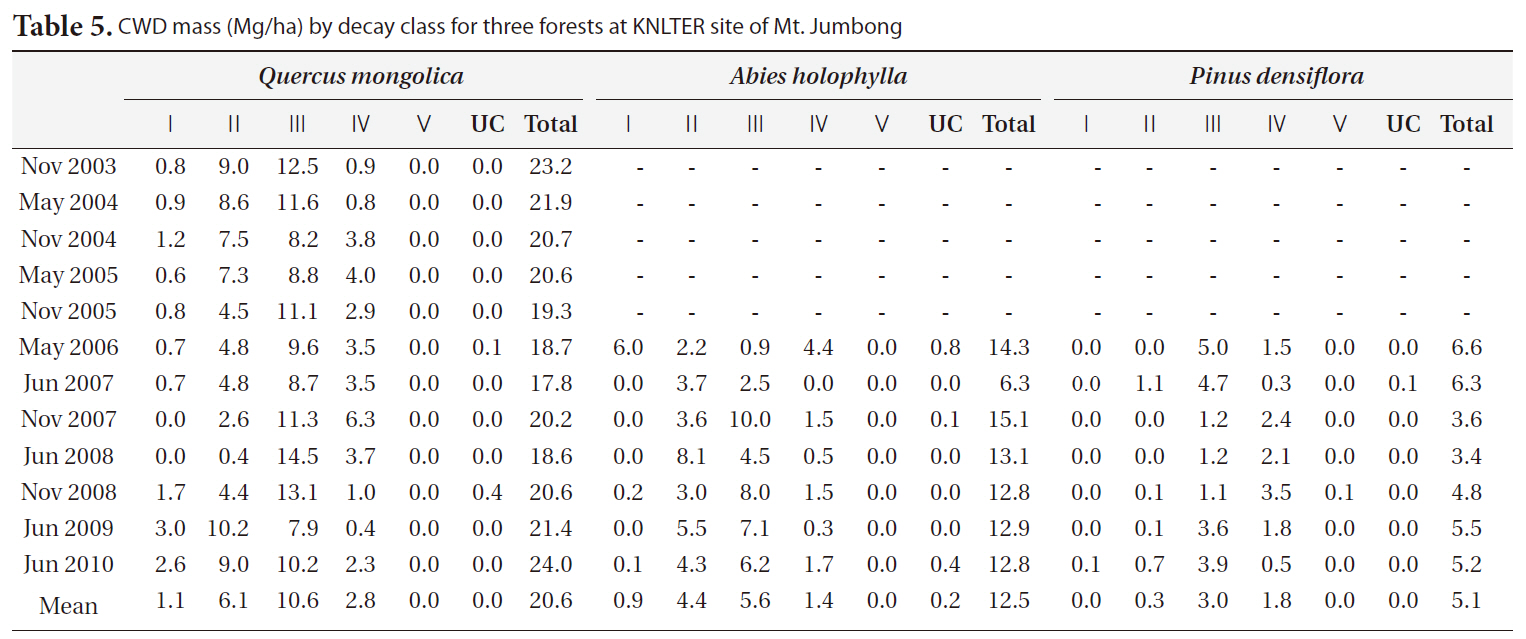
CWD mass (Mg/ha) by decay class for three forests at KNLTER site of Mt. Jumbong
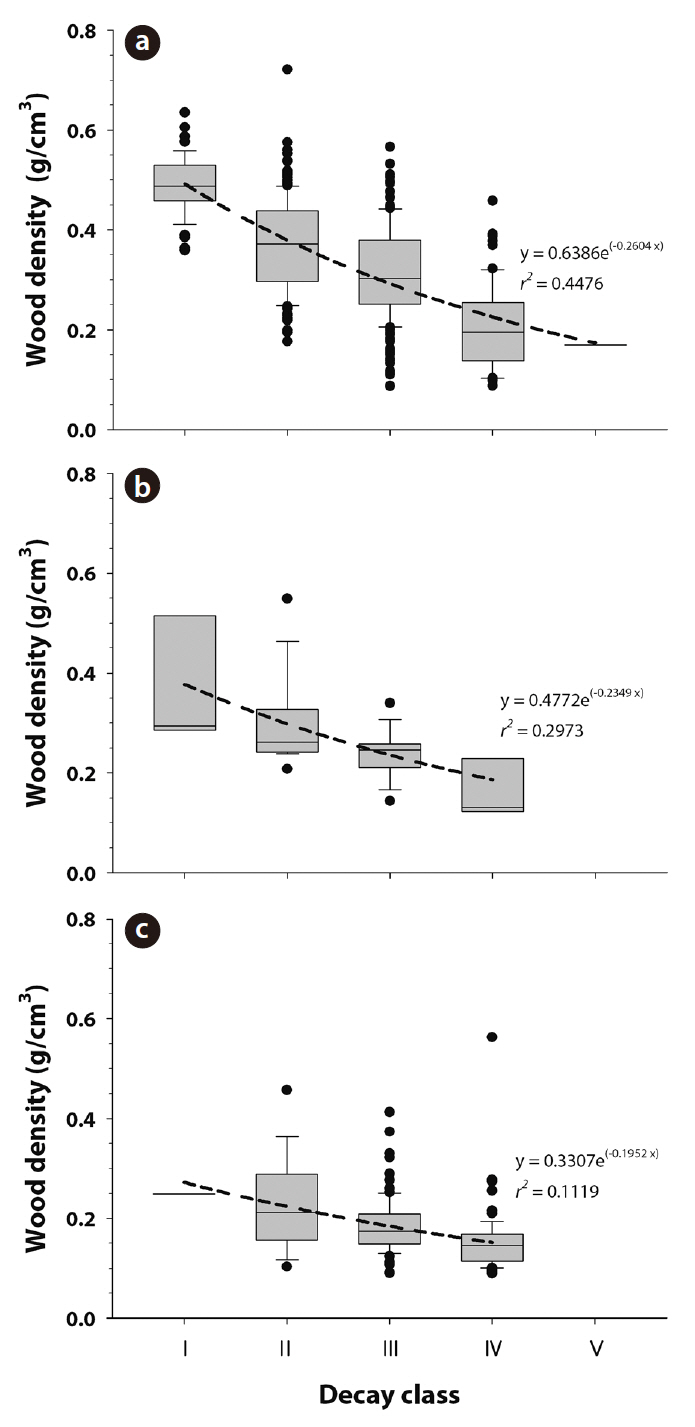
CWD wood density by decay class was calculated for each species. CWD wood density (g/cm3) was 0.49 ± 0.01, 0.37 ± 0.01, 0.31 ± 0.01, 0.20 ± 0.01, and 0.17 ± 0.00 for class Ⅰ, Ⅱ, Ⅲ, Ⅳ, and Ⅴ of
The CWD mass for
Distribution of CWD number and mass by species would be similar to the distribution of living tree number and basal area in
The majority of the CWD in
The proportion of CWD for
CWD mass for the
We collected 20 decay rate constants for coniferous forests from 6 countries and 7 decay rate constants for deciduous forests from temperate ecosystems in 4 countries. Annual precipitation and mean temperature ranged from 660 mm to 2,500 mm and from 3.9°C to 14.8°C, respectively (Table 6). Overall, the decay rate constants (1/y) ranged from 0.015 to 0.157 for coniferous forests and from 0.018 to 0.109 for deciduous forests in temperate ecosystems, regardless of CWD type. We noted no significant differences in decay rate constants between coniferous forests and deciduous forests (P = 0.45). The value for
In this study, the decay rate for the
Decay classification systems are representative of mean wood density for each class with external charac-
[Table 6.] Decay rate constants estimated for temperate forest ecosystems
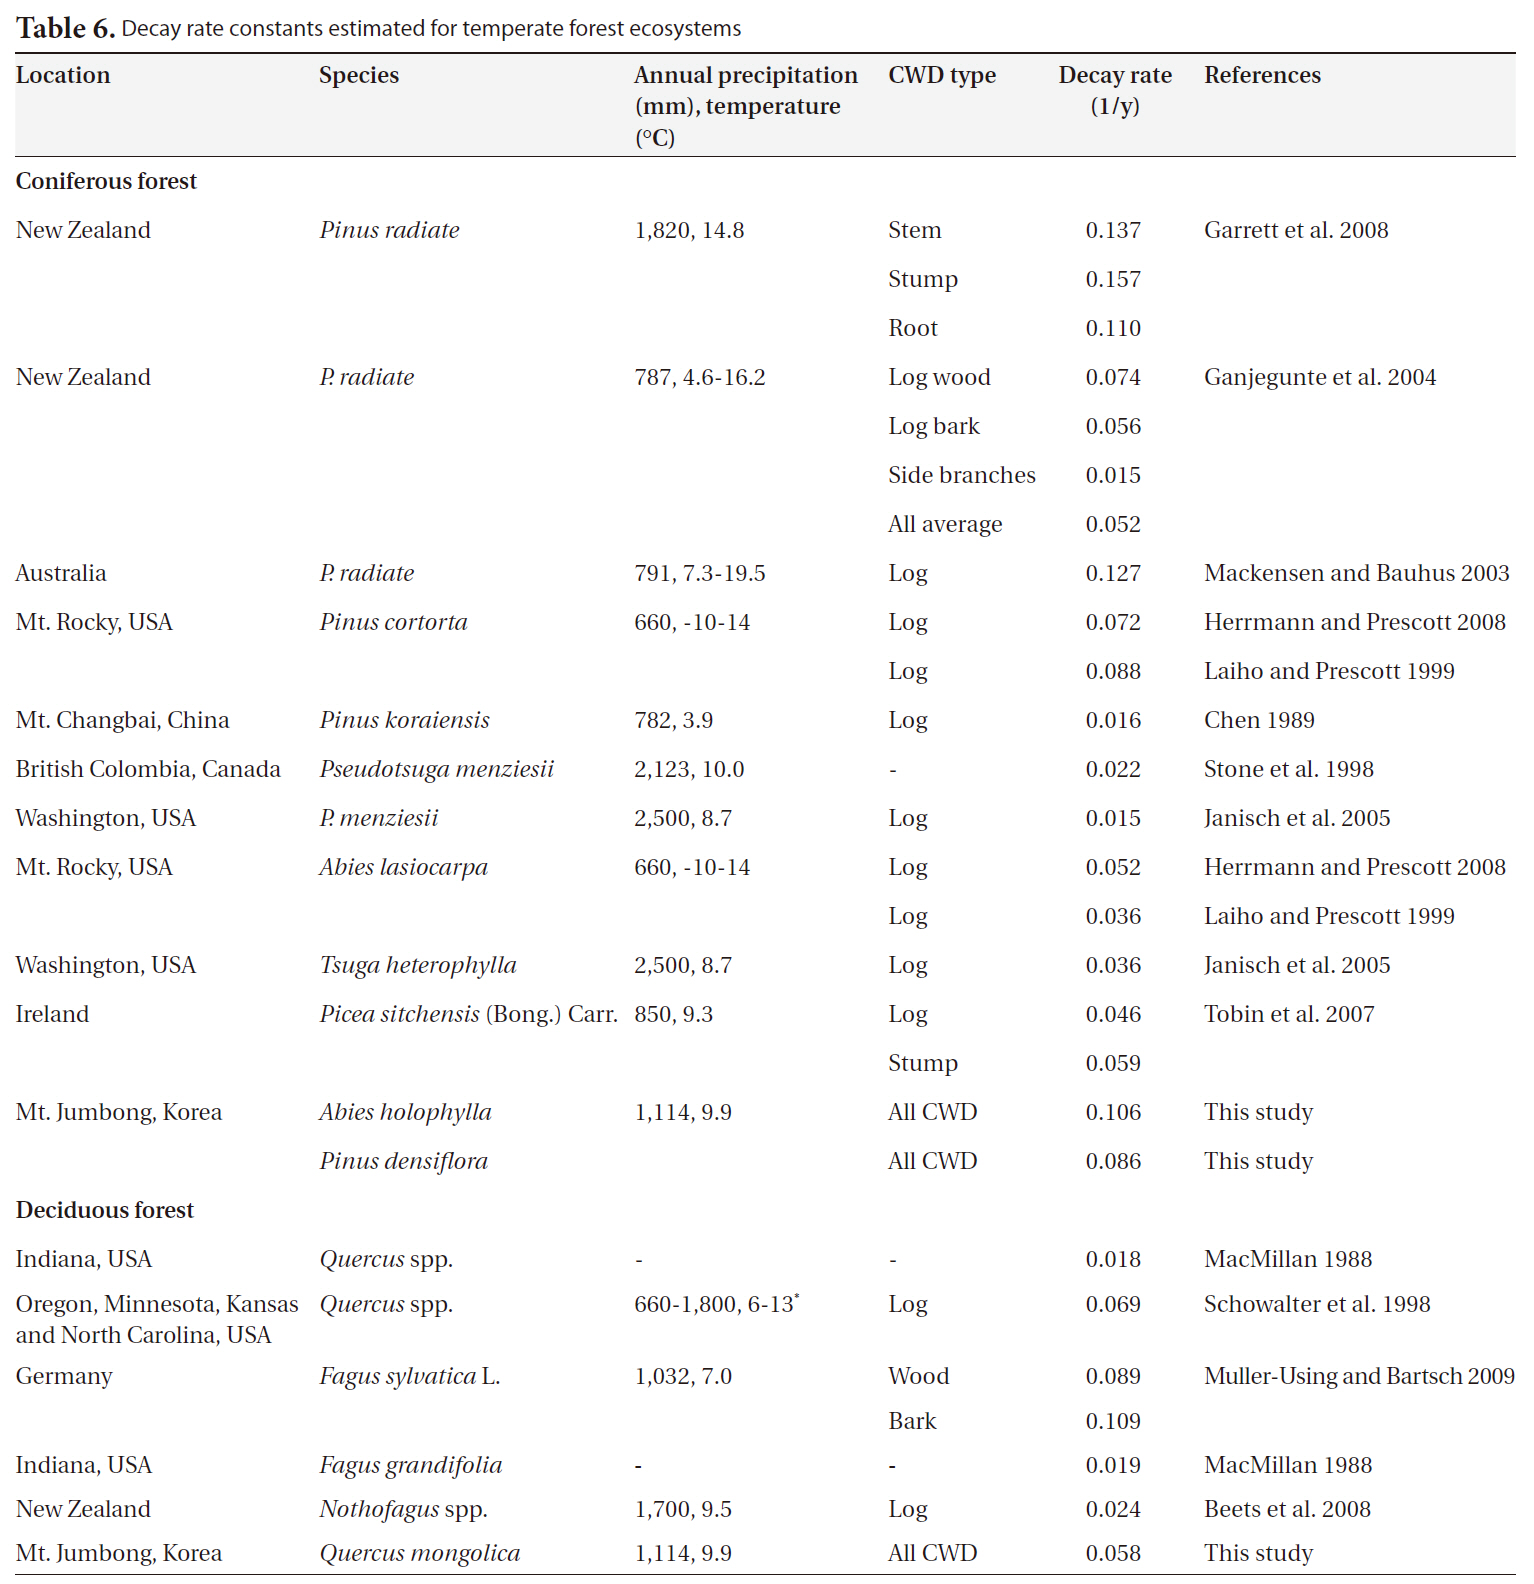
Decay rate constants estimated for temperate forest ecosystems
teristics of CWD such as bark cover, fungal cover, or color (Harmon et al. 1986). In this study, 45%, 30%, and 11% of the variation in CWD wood density was explained by decay classes in the
CV for
The chief objective of this study was to build an inventory of CWD mass and analyze its long-term dynamics in cool-temperate forests located at the Mt. Jumbong site in Korea. CWD mass and its dynamics are affected by microclimate factors including temperature, humidity, O2 and CO2 concentrations inside of CWD, and woody substrate quality including diameter, components, species, and organisms (Harmon et al. 1986, Ganjegunte et al. 2004, Zhou et al. 2007). Topography also affects the distribution of CWD loads across the landscape (Rubino and McCarthy 2003). However, it was difficult to analyze the effects of microclimate or topography in this study, because microclimate and topography data were insufficient and distinguishing the effects of dominant species, topography, and microclimate is difficult in natural forests where these factors are generally related and interact with one another. Thus, further studies will require data of long-term microclimate and CWD mass dynamics in a variety of forest types that can represent a variety of environmental factors.
We developed decay rate constants for each forest regardless of CWD type, decay class, and species in this study. However, decay rate constants could be developed with regard to other factors such as CWD size (Tarasov and Birdsey 2001, Beets et al. 2008), decay class (Tobin et al. 2007) and CWD type (Ganjegunte et al. 2004, Garrett et al. 2008). This study did not install enough CWD replicates to reflect all these factors, principally because it was tightly focused on CWD mass dynamics in natural forests, not developing heterogenous CWD decay rate constants. However, further research into the development of CWD decay rate constants should take into consideration these factors, which affect CWD decomposition. In particular, the development of CWD decay rate constants by decay class may prove essential, as further research into CWD mass inventory and its dynamics is necessary for the development of a CWD mass dynamics model in forests with continuous long-term monitoring. Stage-based CWD decomposition models according to decay classes by different transition rates (Kruys et al. 2002, Ranius et al. 2003, Montes and Canellas 2006) could be applied in the construction of CWD mass dynamics models in the future using the CWD inventory compiled in this study.