The accelerated loss of Thailand’s forest and fragmentation are the most common cited reasons for biodiversity loss in Thailand (Poonswad et al. 2005, Trisurat et al.2010). Overall, Thailand has lost as much as 70% of the original forest cover (Corlett 2009) and was ranked the highest of all countries in the Greater Mekong Sub-region and as the fourth of the Top 10 tropical countries in terms of annual rate of loss in 1995 (CIDA Forestry Advisers Network 2005).
Deforestation results in not only habitat loss, but also increased fragmentation (Turner and Corlett 1996).The effects of fragmentation include decreased species richness, increased habitat edges which favor species adapted to edge habitats but prevent species living in core areas, and diminished species distribution and gene flow (Raabova et al. 2007, Lehouck et al. 2009). Another consequence of habitat fragmentation is the alteration of physical fluxes of radiation, wind and water across the landscape (Saunders et al. 1991).
A number of modeling methods have been developed for predicting land-use change and species distributions. Land-use change models range from simple system representations including a few driving forces, to simulation systems based on a profound understanding of situation-specific interactions among a large number of factors at different spatial and temporal scales, as well as environmental factors (Verburg et al. 2008). Reviews of different land-use models have been provided by Verburg et al. (2004) and Priess and Schaldach (2008). In addition, species-distribution models are based on the assumption that the relationship between a given pattern of interest (e.g., species abundance or presence/absence) and a set of factors assumed to control it can be quantified (Guisan and Zimmermann 2000). In addition, advances employing geo-informatics technologies allow correlative modeling of species’ distributions for large geographic areas, especially when detailed information about the natural history of species is lacking (Anderson et al. 2002, Peralvo 2004, Brannstrom et al. 2008, Trisurat et al. 2009).
The Sakaerat Environmental Research Stations (SERS) is one of five biosphere reserves and listed as one of two International Long-term Ecological Research (ILTER) sites in Thailand (Trisurat 2010). The management objectives of SERS are to demonstrate sustainable forest management and biodiversity conservation according to the Man and Biosphere Reserve (MAB) concept. In 1982, the Royal Forest Department started to rehabilitate degraded forest and abandoned settlements inside the SERS after resettlement (Sahunalu et al. 1993, Khemnark 1994) and thus, forest cover increased in area. Substantial reforestation areas both inside and outside the SERS were implemented under the Royal Golden Jubilee program started in 1994 (Royal Forest Department 2005). An assessment in 1985 indicated that the percentage of forest inside the SERS was approximately 63.15% (Ongsomwang 1986) and increased to 72.62% in 2002 (Trisurat 2010). However, natural forest in the buffer zone had diminished due to encroachment for agriculture, illegal logging (Maninan et al. 1976, Tangkitjavisuth 1979), road expansion from 2 lanes to 4 lanes (Trisurat 2010), commercial forest plantation (Forestry Research Center 2009) and infrastructure development along road networks. In addition, the SERS has implemented a forest fire suppression policy for three decades and this policy has caused a changed structure and composition of the dry dipterocarp forest. More tree species associated with mixed deciduous and dry evergreen forests have invaded the dry dipterocarp forest (Marod 2009).
The SERS contributes many ecosystem services to local communities and public societies. The SERS has been determined as a food bank for local communities surrounding the research station (Pinkasorn 1990). Forty-five villages situated within a 5-km radius from the SERS are dependent on water supply, non-wood products, etc. In addition, approximately 12,000-15,000 visitors join scientific camps for conservation awareness each year and a popular outdoor activity is bird watching. Thus, it is important to evaluate how past, current and future land-use/land-cover configurations affect ecosystem services provided from the SERS. The objectives of this research were to predict land-use change in the SERS and to analyze the consequences of land-use change on bird distribution, which is one of the important ecosystem services.
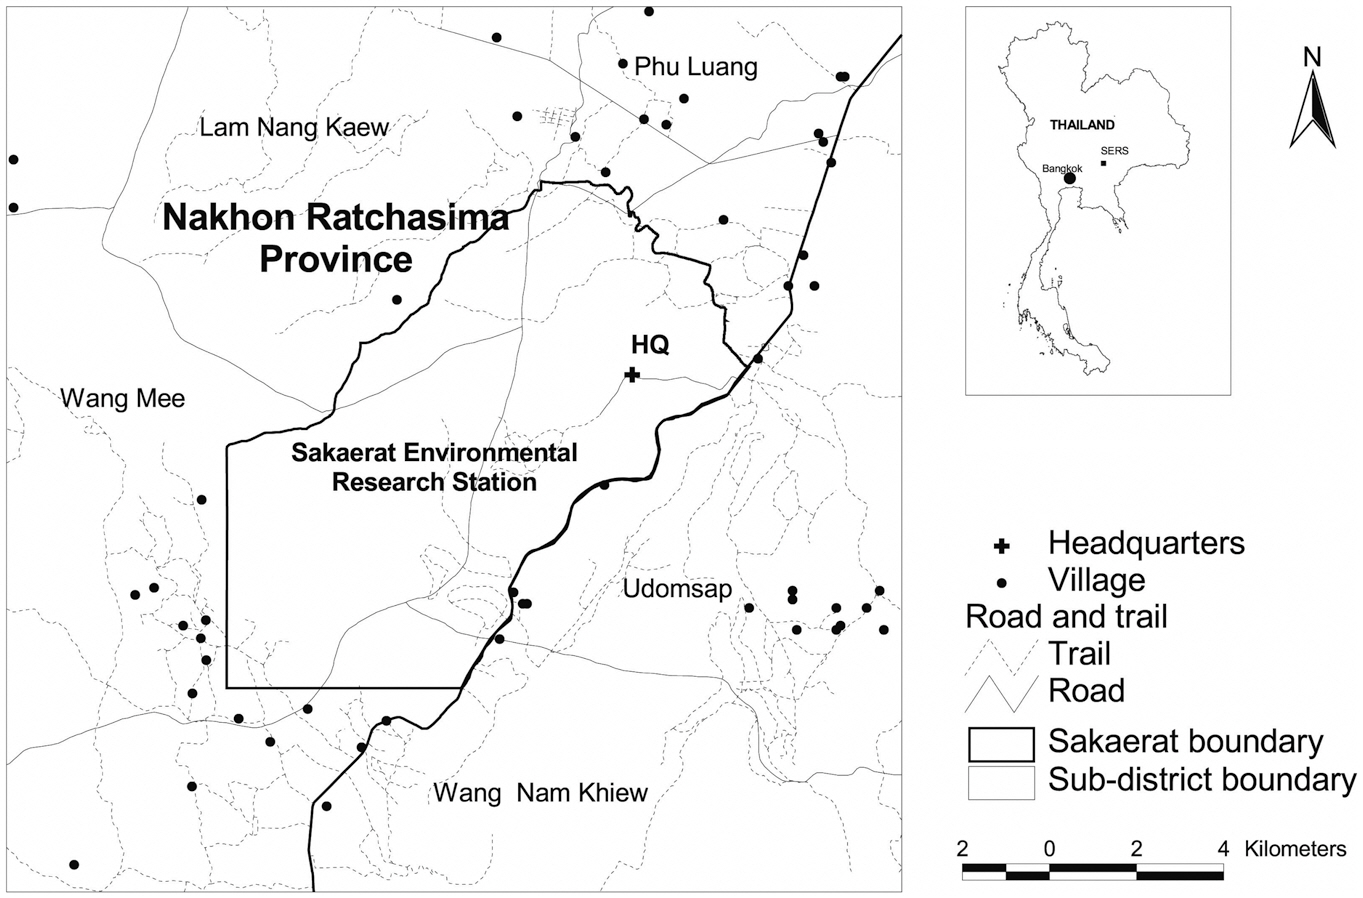
The SERS is situated in the Korat Plateau between latitude 14°25′-14°33′ N and longitude 100°48′-100°56′ E (Fig. 1). The SERS covers an area of approximately 82 km2 (Trisurat et al. 2006) mainly in six sub-districts of Nakhon Ratchasima Province in northeast Thailand, namely Ta Khob, Lam Nang Kaew, Phu Luang, Udomsap, Wang Mee and Wang Ngam Khiew. Its altitude ranges from 250-762 m above mean sea level and approximately 35% of the research station is situated in altitudes between 300-400 m (Thailand Institute of Science and Technology 2000).
The SERS is surrounded by extensive agricultural areas and human settlements. Based on visual image interpretation of Landsat-TM images, nine land-use/land-cover classes were classified, namely, dry evergreen forest, mixed deciduous forest, dry dipterocarp forest, secondary growth, plantation, grassland, old clearing, agriculture & settlement, and water body (Trisurat 2010). Remaining forest cover was found mainly in the SERS and in mountainous areas. Dominant forest types are dry evergreen forest, dry dipterocarp forest and mixed deciduous forest.
The Dyna-CLUE model was used to project land-use transitions because it is one of the most used land allocation models (Verburg et al. 2004). The use of this model in many case studies at local (Trisurat et al. 2010) and continental scale by different institutions (Verburg and Overmars 2009) worldwide has proven its capacity to model a wide range of scenarios and provide adequate information for indicator models.
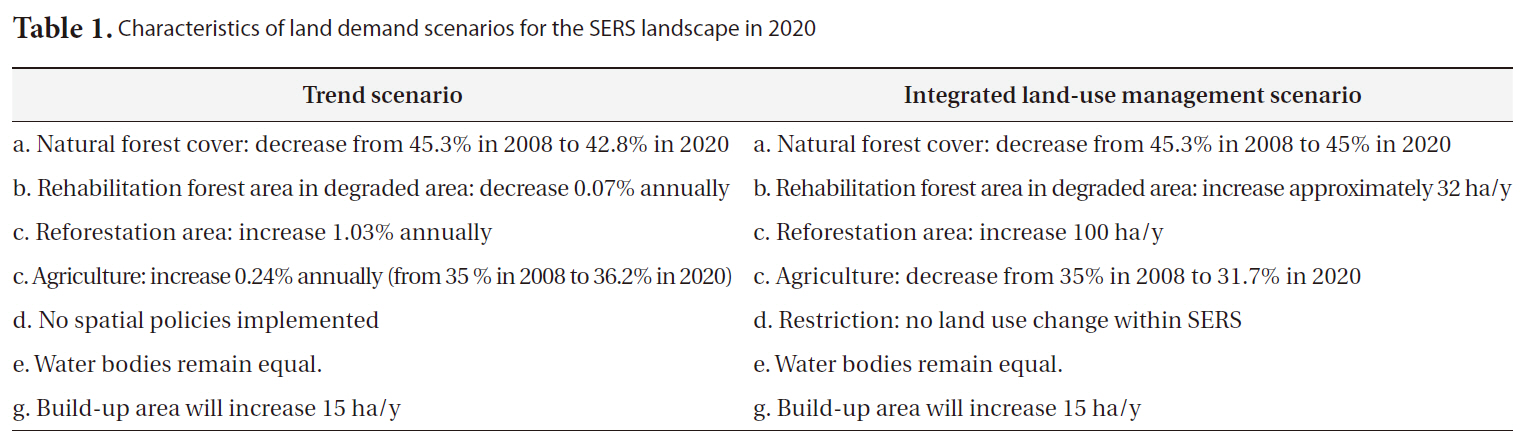
Two land demand scenarios during the period 2008-2020 were determined: (1) trend scenario, and (2) integrated land-use management scenario. The trend scenario was based on a continuation of forest cover change
[Table 1.] Characteristics of land demand scenarios for the SERS landscape in 2020

Characteristics of land demand scenarios for the SERS landscape in 2020
during 2002-2008 (Trisurat 2010), which expects forest cover to be 42.8% in 2020. Forest encroachment in the SERS is possible under the trend scenario. The integrated land-use management scenario aimed to maintain 45% forest cover in 2020 to conserve biodiversity in the SERS, supply raw materials for pulp and paper purposes (Forestry Research Center 2009) and upscale the renewable wood energy policy of the Ministry of Energy currently implemented at Udomsap sub-district, Nakon Ratchasima province to three sub-districts. Therefore, the total requirement of reforestation areas for this project is approximately 1,200 ha by 2020 (Forestry Research Center 2009). In addition, the SERS was designated as a restricted area for agricultural encroachment and infrastructure development, so that no further forest encroachment is allowed (Table 1).
The physical factors to indicate the preference for a specific type of land use were altitude, slope, aspect, distance to available water, and soil characteristics. In addition, the socio-economic factors influencing deforestation were distance to village and distance to main road. Altitude, aspect, slope, distance to main roads, and distance to streams were extracted and/or interpolated from the 1:50,000 topographic maps (Royal Thai Survey Department 2002). Soil groups and their properties were derived from the 1:100,000 soil map (Land Development Department 2001) and technical reports (Land Development Department 2005a, 2005b).
Land-use/land-cover map in 2008 was obtained from a recent study by Trisurat (2010), which was visually interpreted from Landsat-5 TM images. All physical, socio-economic factors and the land use map were converted to raster format at a resolution of 100 × 100 m and all spatial analyses were carried out using ArcGIS ver. 9.2 software (ESRI Inc., Redlands, CA, USA).
The Dyna-CLUE model quantifies the location preferences of the different land uses based on logistic regression models, which determine the relation between occurrence of a land-use type and the physical and socio-economic conditions of a specific location (location factors):
Logit(pi) = ln (pi)/(1-pi) = β0 + β1X1 + β2X2+ … + βnXn
where, pi is the probability of a grid cell for the occurrence of the considered land-use type and the X parameters are the driving factors, which include physical and socio-economic factors. The coefficients (β) are estimated through logistic regression using the occurrence of the land uses in 2008 as the dependent variable.
The goodness-of-fit of a logistic regression model is evaluated using the receiver operating characteristic (Hosmer and Lemeshow 2000). The value of the area under curve (AUC) ranges between 0.0 (completely unfit) and 1.0 (perfect fit), where AUC 0.5 is completely random.
Even though there were nine land-use classes in 2008, in this research, logit models were developed for seven land-use classes, as the water body class was assumed to remain unchanged during the simulation period; and secondary growth was randomly scattered in the SERS landscape after forest encroachment or regrowth not due to location preferences.
>
Species distribution modeling
Black-crested Bulbul (
We used Maxent (version 3.3.0; www.cs.princeton.edu/~schapire/maxent), the maximum-entropy approach for species habitat/distribution modeling (Phillips et al. 2006, Phillips and Dudik 2008) to estimate the probability occurrence of Black-crested Bulbul because it requires only presence data and environmental information. The Maxent is considered to be better than other methods using presence-only data (Elith et al 2006, Tognelli et al. 2009) and performs best when few presence records are available (Wisz et al. 2008).
The geographical locations of Black-crested Bulbul were observed and recorded using a Global Positioning System (GPS) along animal tracks, fire breaks and patrolling routes across SERS landscape during 0700-1000 h and 1600-1800 h in dry season (Feb-Apr 2009) and wet season (Aug-Oct 2009). We divided the presence locations of Black-crested Bulbul into two sets. Eighty percent were classified as training data to build the model and the remaining 20% (testing data) was used to evaluate the predictive accuracy of the model.
Potential habitat factors for Black-crested Bulbul were based on previous studies on species-habitat relationship (Robinson 2002, Lekagul and Round 2005, Gavashelishvili and Javakhishvili 2010). These factors included six biological factors, four physical factors and three anthropogenic factors. Temporal land use maps (years 2008 and 2020 under trend and integrated land-use management scenarios) were obtained from the previous studies (Trisurat 2010). In addition, we derived distance grids to dry evergreen forest, deciduous forest, rehabilitation forest, and plantation & secondary growth and used these distances for model development in addition to typical land cover classes. Physical factors were altitude, slope, aspect, and distance to stream as used in the Dyna-CLUE model. Anthropogenic factors that determined human disturbance and development were distance to agriculture, distance to road and distance to village.
The calculation of distances was done by using ArcGIS module
The predicted continuous probability values derived from the Maxent model were transformed into a binary prediction. The logistic threshold at maximum training sensitivity plus specificity was used for binary classification. This threshold value has been proven as one of the promising approaches for predicting species distributions (Liu et al. 2005, Cuesta-Camocho et al. 2006). If the probability value was equal or greater than this threshold value, it was classified as presence, otherwise absence.
>
Bird habitat patterns and changes
Habitat change detection was assessed by overlaying temporal bird habitat maps. In addition, we used FRAGSTATS ver. 3.0 software (McGarigal and Marks 1995) to assess landscape structure and fragmentation indices of Black-crested Bulbul habitat in 2008 and 2020 in terms of mean patch size, number of patches, total core area and largest patch index. These landscape indices imply direct and indirect impacts of forest fragmentation on biodiversity (Forman 1995).
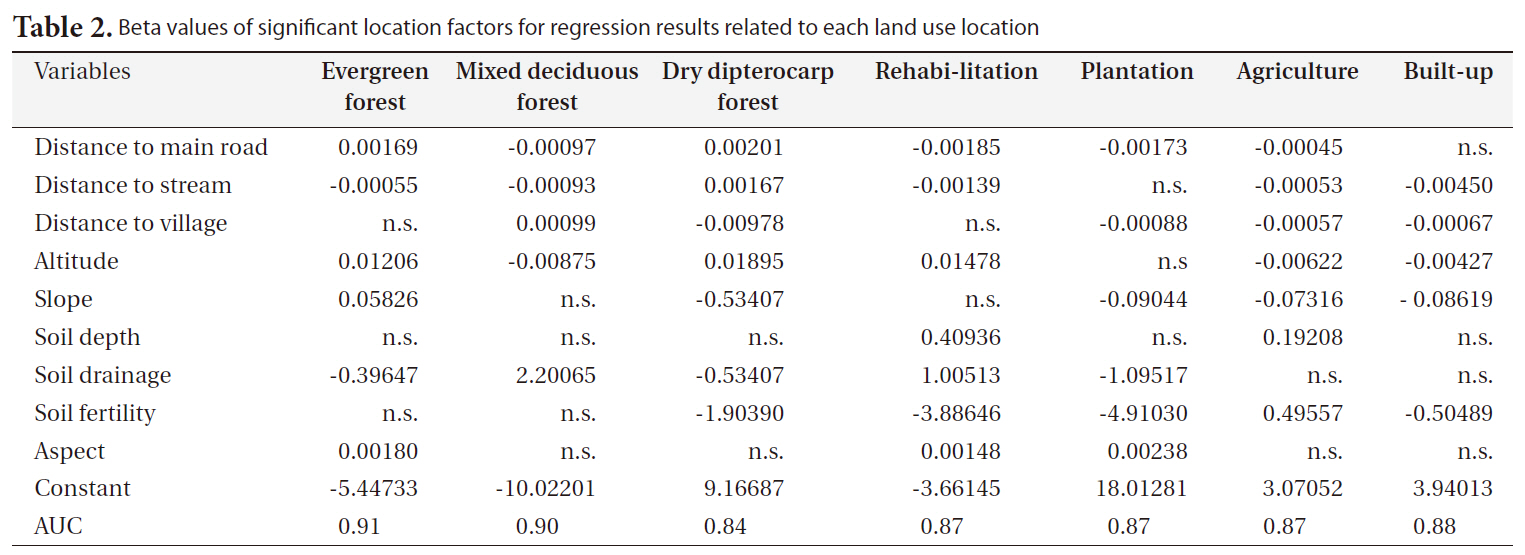
Beta values of significant location factors for regression results related to each land use location
>
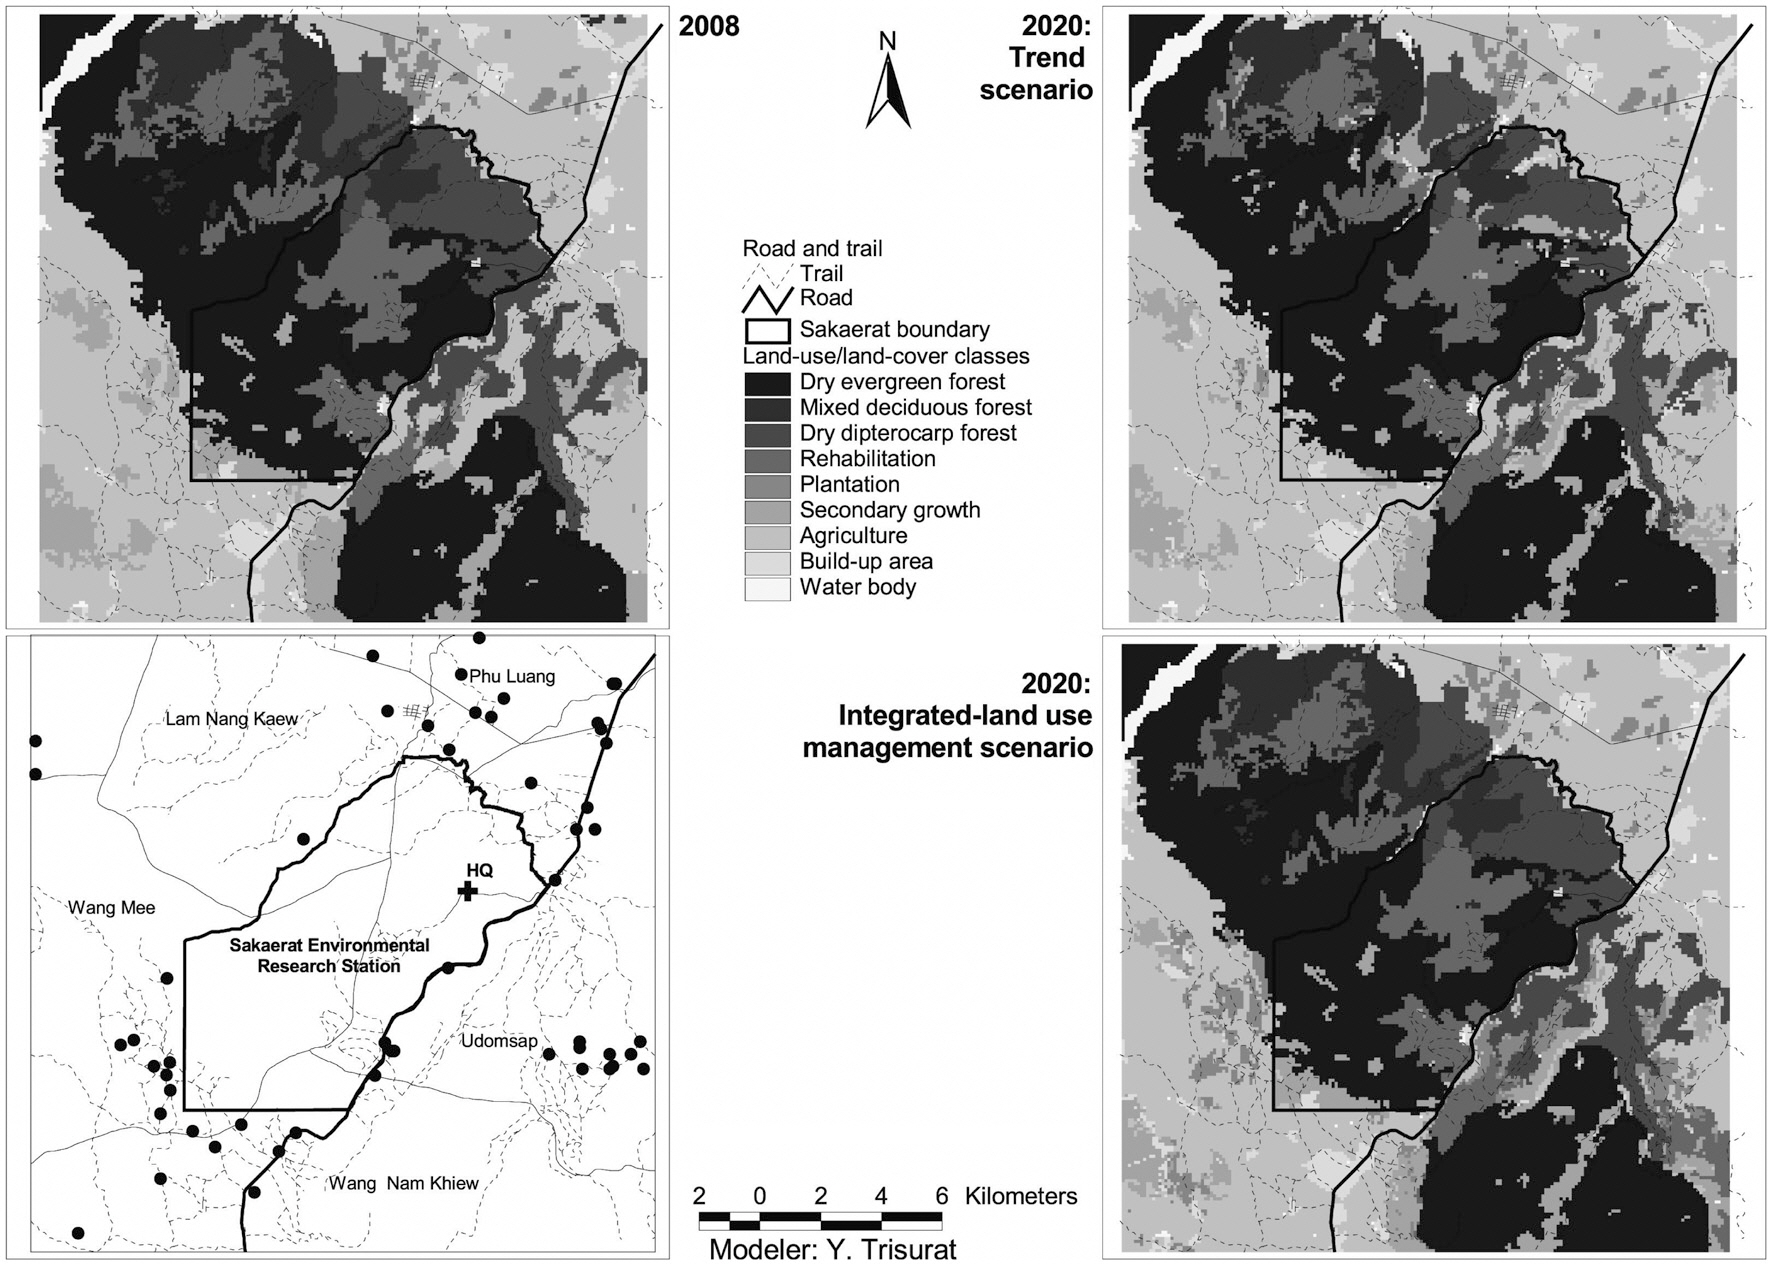
Predicted land-use/land-cover in 2020
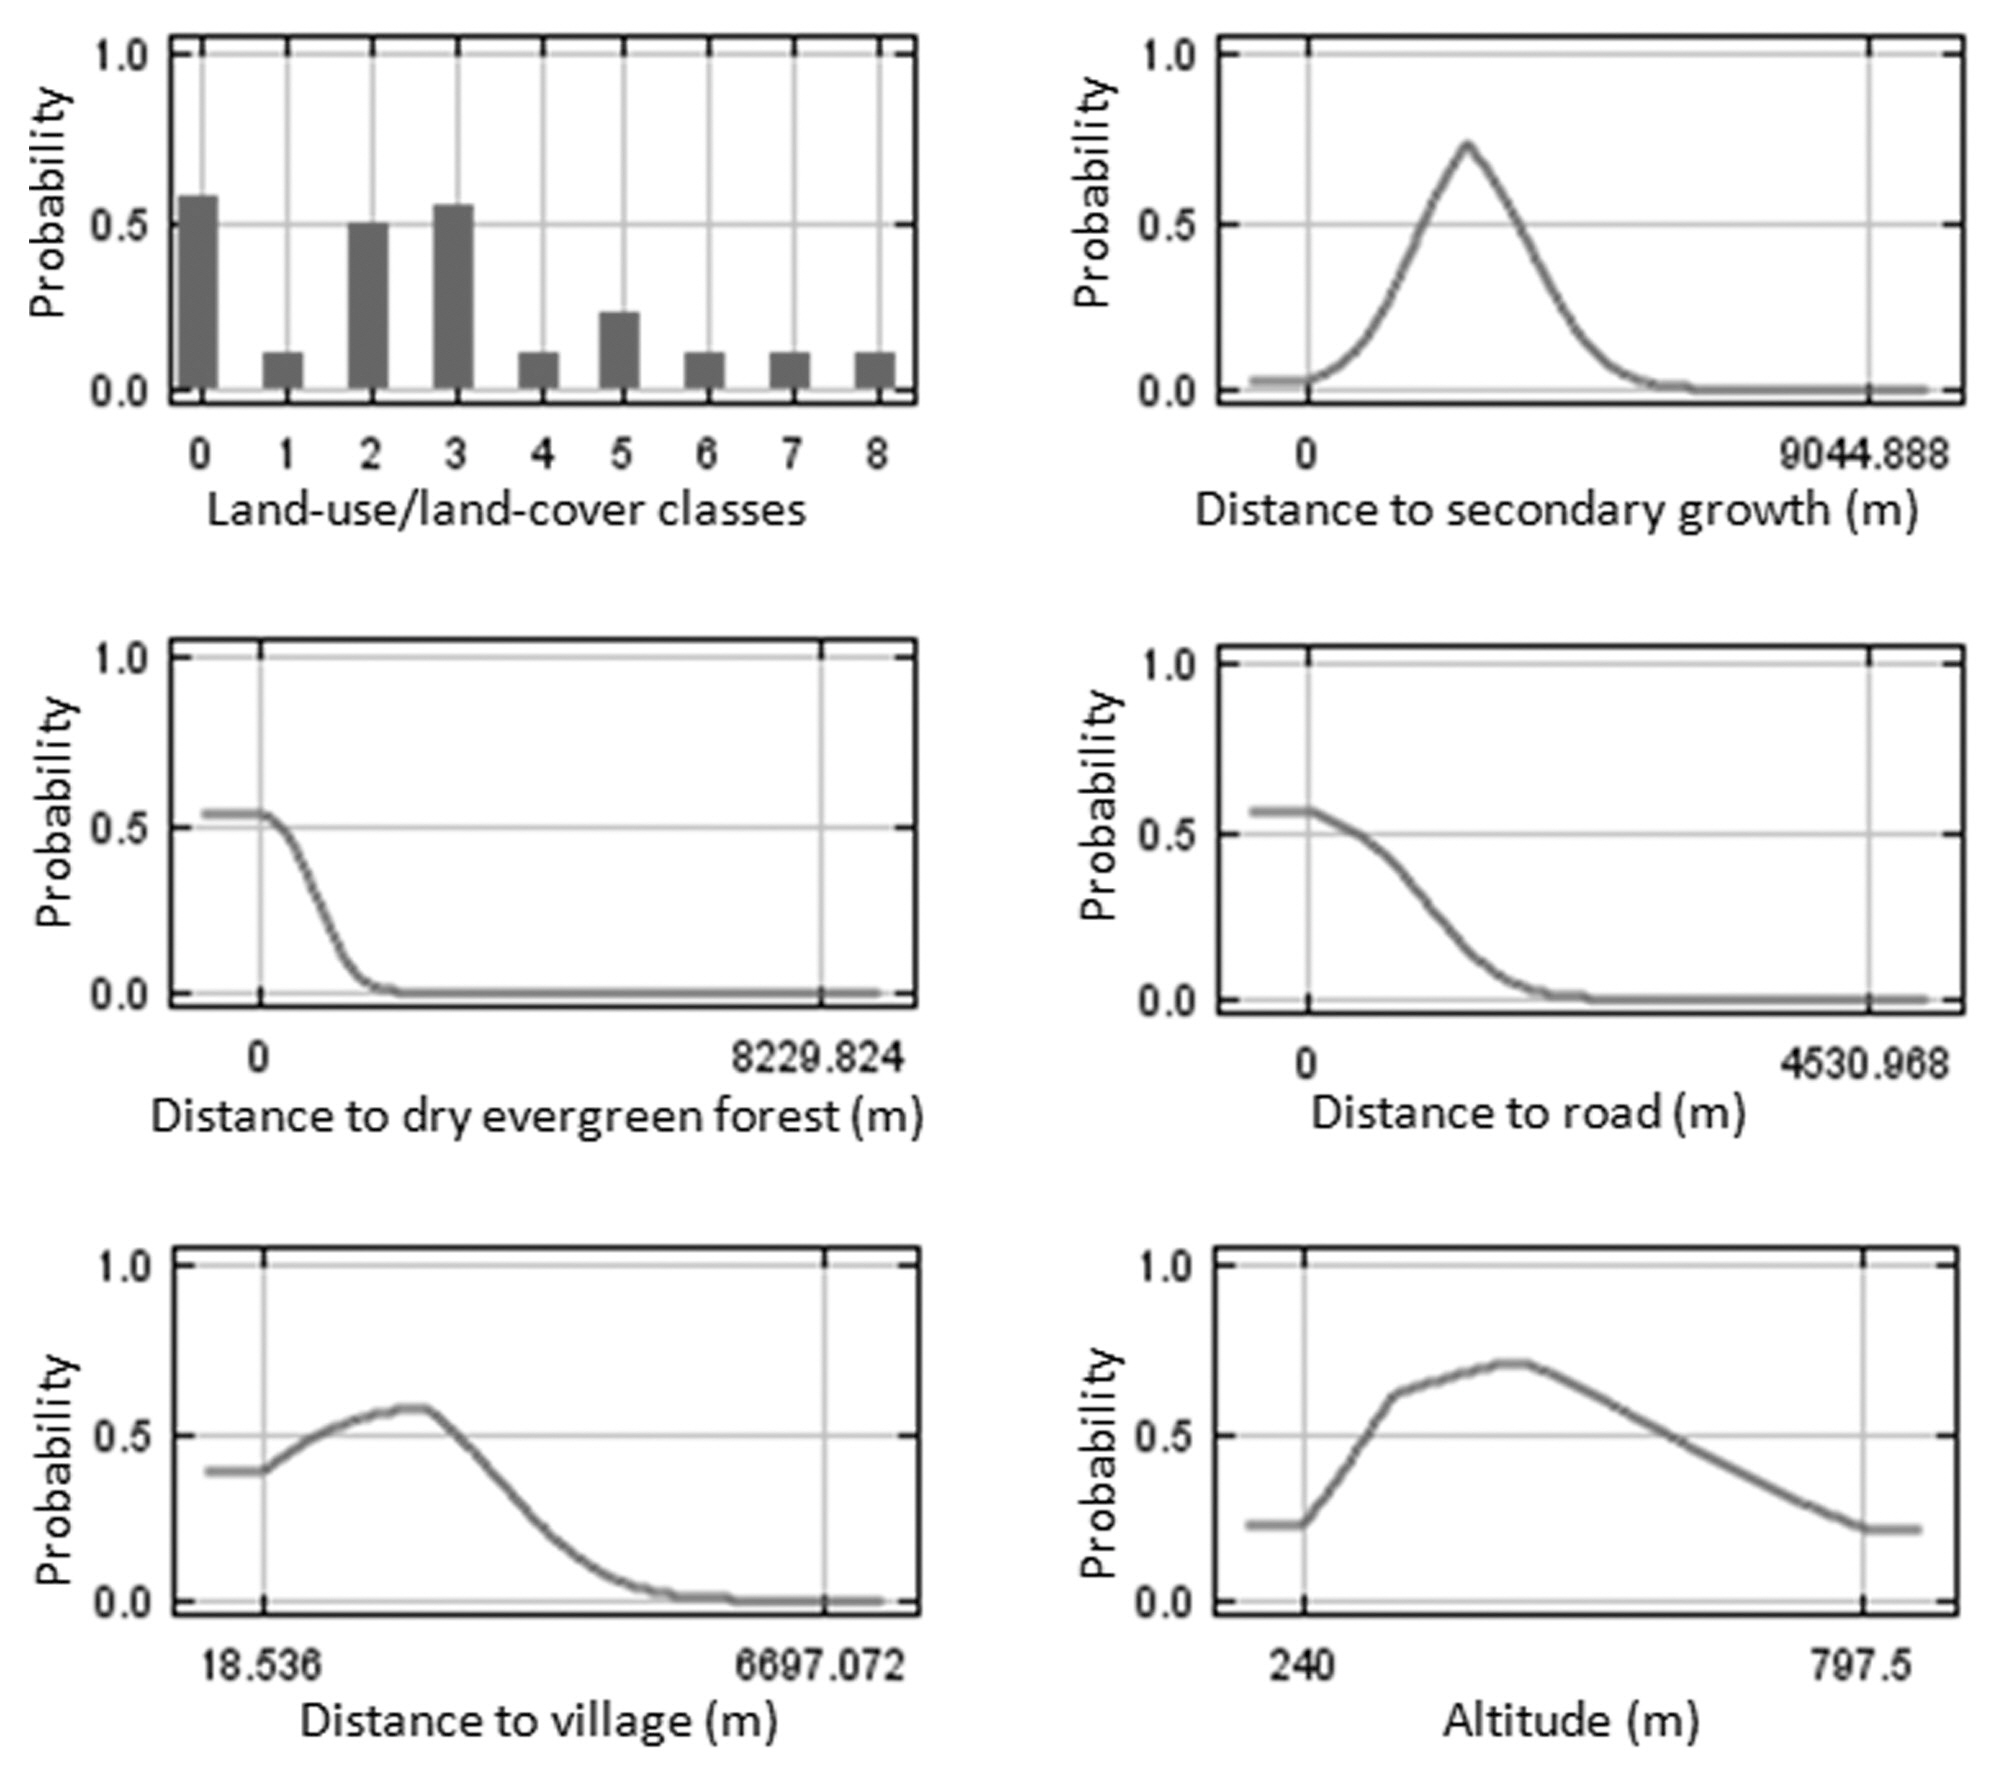
The significant factors and coefficients derived from the logistic regression analysis that determine the location suitability of the seven land-use types are shown in Table 2. From this table it can be seen that not all location factors were included in the regression models and each factor contributed to different land-use types. High altitude, rugged slope and distance to village were positively correlated to remaining dry evergreen forest. Rugged terrain, poor soil and remoteness were limiting factors to future encroachment for agriculture. In contrast, areas that were close to the stream network, situated on fertile and deep soil, accessible from main roads, and at low altitude were a prime target for agriculture.
The spatial distributions of the seven land-use types were well explained by the selected location factors as indicated by the AUC values that measure the goodness of fit of the logistic regression models (Table 2). The highest AUC value (0.91) was found for dry evergreen forest followed by mixed deciduous forest (0.90) and build-up area (0.88) because dry evergreen forest and mixed deciduous forest were mainly restricted in the SERS, while build-up area usually requires specific criteria (e.g., accessibility, low altitude). On the other hand, the AUC values for the remaining land-use classes were a bit lower but they were still considered very high (Hosmer and Loweshow 2000).
Land-use/land-cover maps for 2008 and simulation results for 2020 for the two scenarios are shown in Fig. 2. The results of the trend scenario without restriction policy show that future deforestation for agriculture was predicted in the west of southeastern SERS where it was occupied by secondary growth in 2008. In addition, some parts of secondary growth in high altitude and steep slope of SERS were replaced by rehabilitation forest. More commercial plantation areas were predicted in the northeast and the west outside SERS and close to road networks.
The integrated land-use management scenario, with
[Table 3.] Predicted coverage of land-use/land-cover at the SERS landscape
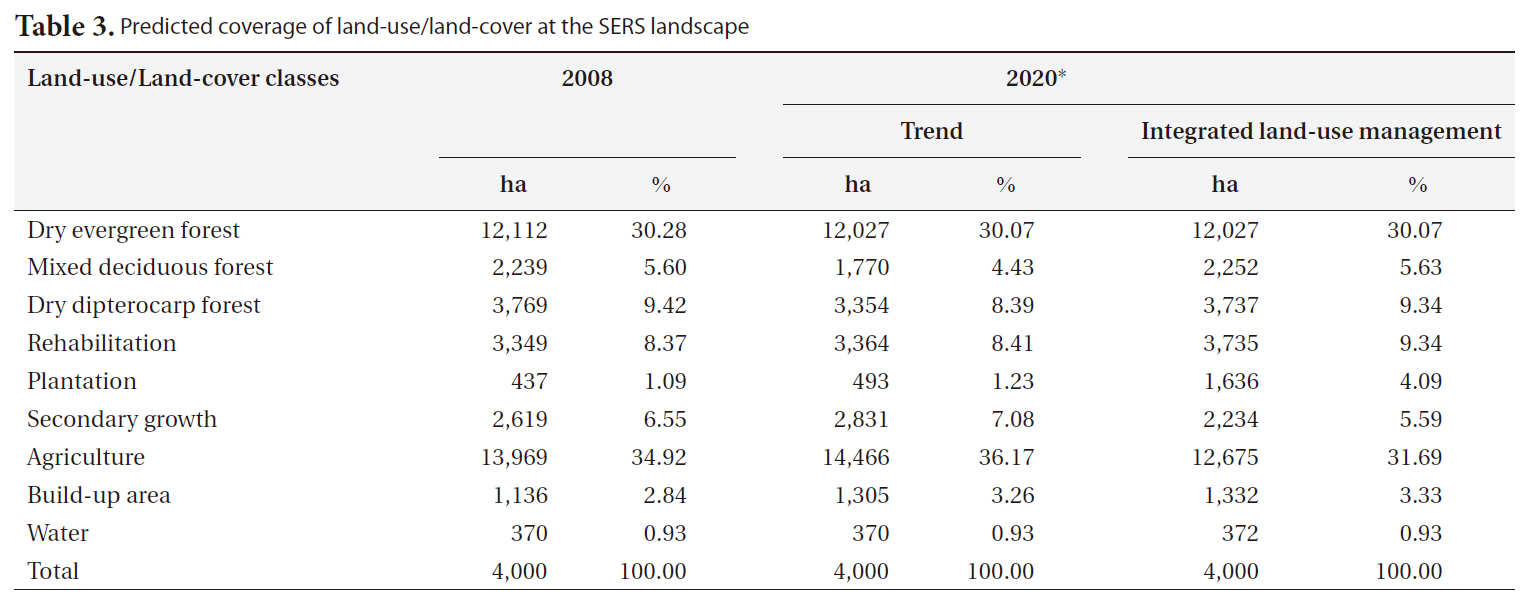
Predicted coverage of land-use/land-cover at the SERS landscape
restriction for encroachment and infrastructure development and a slower rate of agricultural expansion, shows different land use patterns. This scenario assumes less demand for agriculture, leading to higher remaining forest cover (Table 3). Fig. 2 shows that a number of refores-
tation sites were predicted in the west and the east of the SERS landscape where soil is not suitable for agriculture. In addition, reforestation also replaces parts of secondary growth.
We found 39 records of Black-crested Bulbul in the SERS landscape. Twenty seven records were sighted in dry evergreen forest. Observations in deciduous forest, ecotone and rehabilitation area were 8, 3, and 1 records, respectively. The results of Pearson’s correlation test indicated that the coefficient value between distance to dry evergreen forest and distance to rehabilitation forest was 0.744 (
The Maxent procedure estimates the relative contributions of variables to the model (Phillips et al. 2006). Among the 12 habitat factors used in the model, distance to plantation & secondary growth, distance to dry evergreen forest and distance to road were considerable contributors to Black-crested Bulbul distributions in the SERS landscape. These factors had approximately 29, 28, and 15% of the total contribution, respectively. Distance to village, slope and distance to agriculture had moderate contributions of 8, 6, and 6%, respectively. Each of the remaining factors had contributions of less than 5%. In addition, the performances of the ecological niche models were high for both training and test data. AUC values were 0.97 and 0.98, respectively.
The response curves for each variable derived from Maxent modeling showed that the probability of Black-crested Bulbul occurrence reached its maximum at values of distance to plantation and secondary forest of 3,000 m, distance to village of 2,000 m, and distance to road of less than 500 m (Fig. 3). Black-crested Bulbul inhabits all land use categories (Lekagul and Round 2005). Although Black-crested Bulbul is widely distributed from plains to the highest summits (McClure 1974, Lekagul and Round 2005), the probability of this species was highest in altitude between 300-500 m in the SERS landscape (Fig. 3).
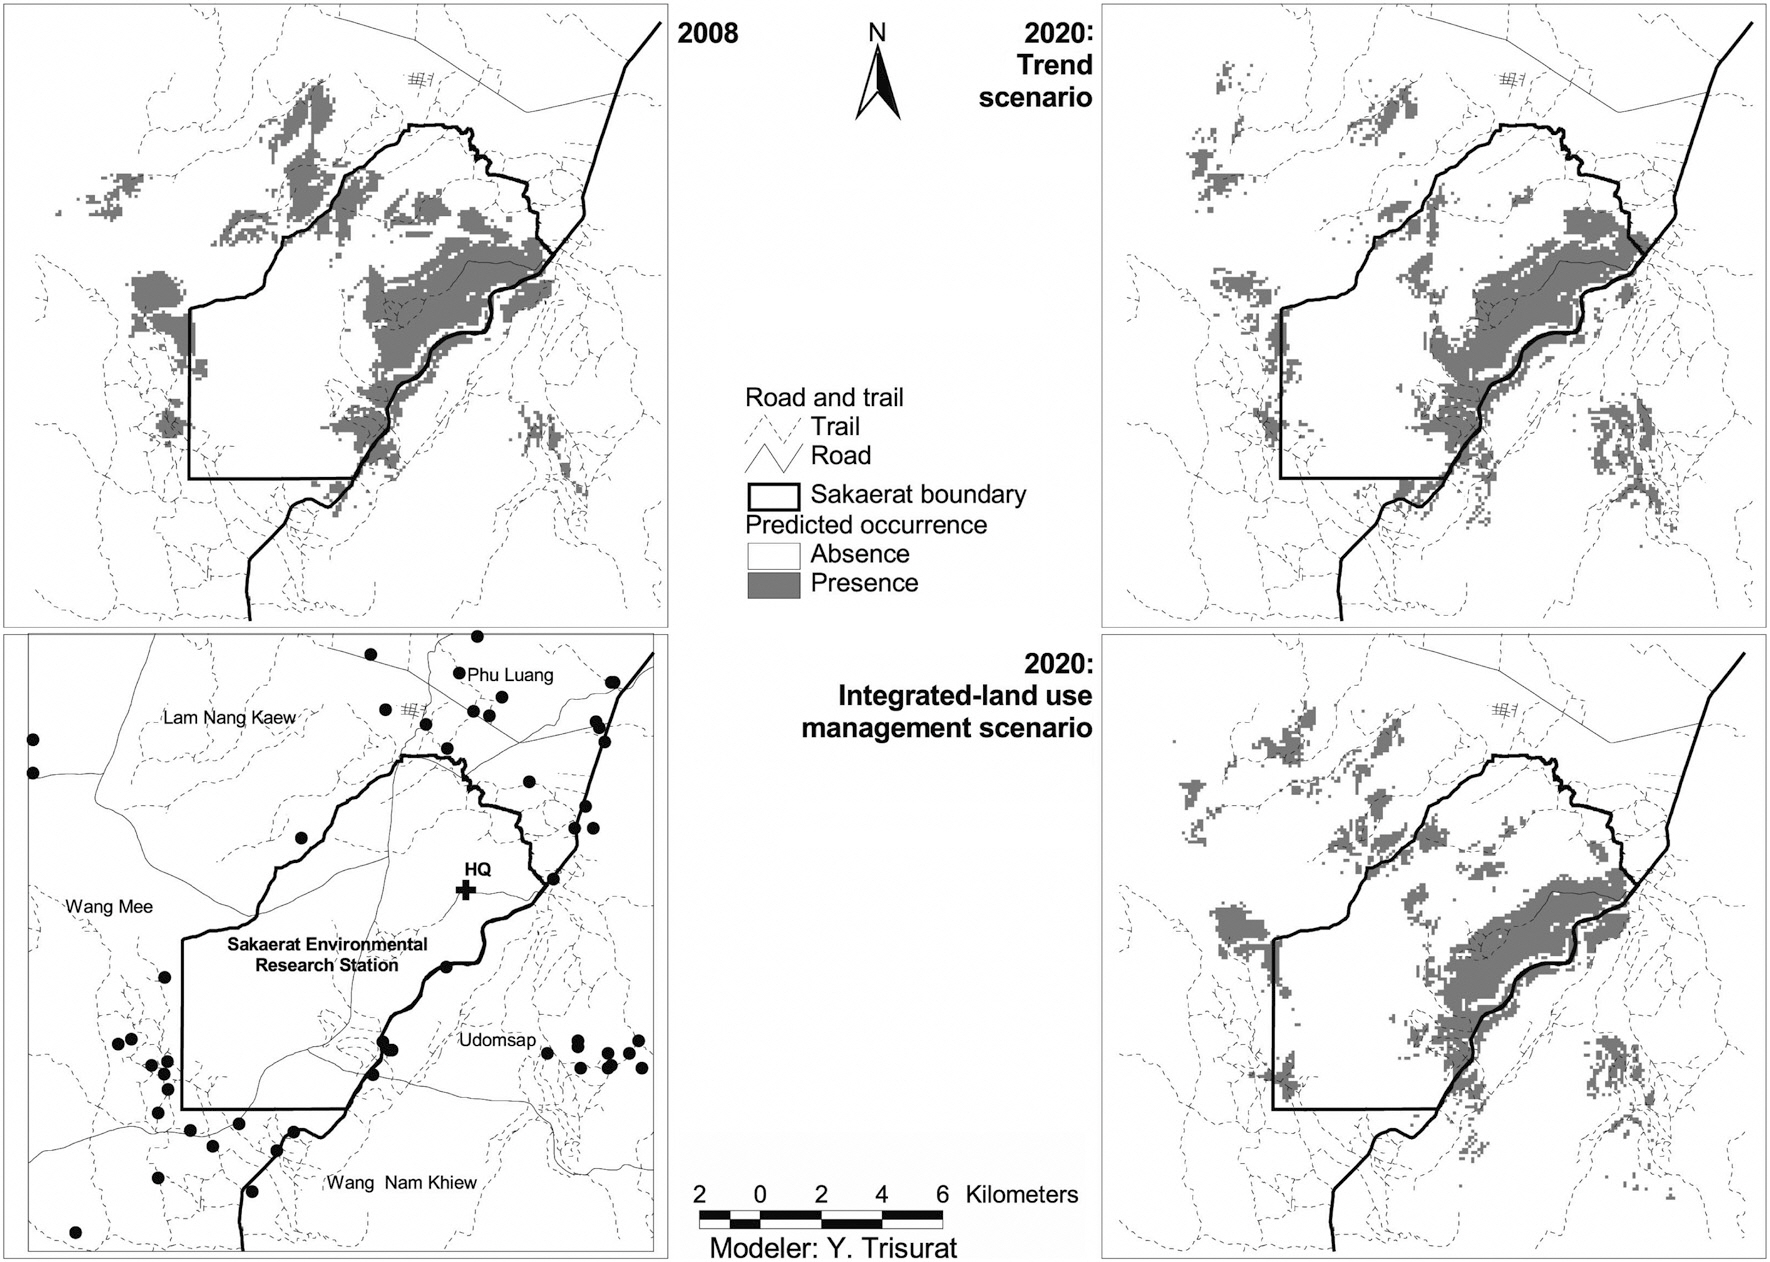
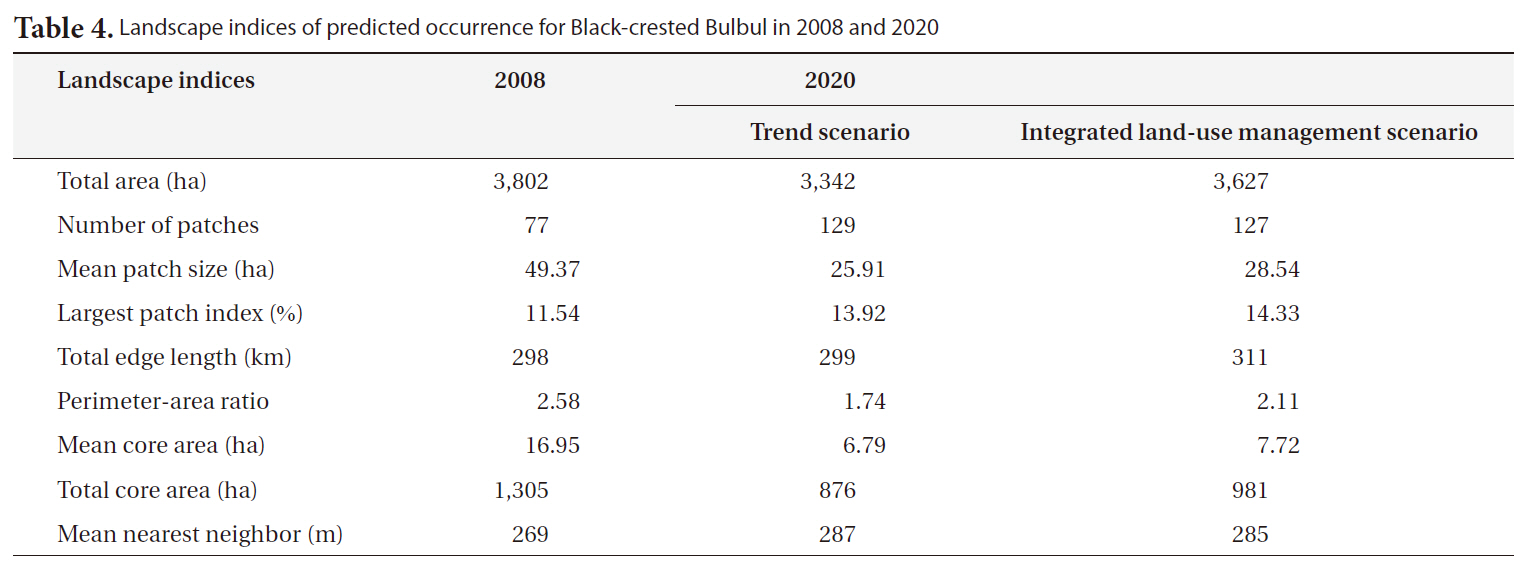
The predicted occurrence for Black-crested Bulbul in 2008 covers an area of 3,802 ha which relatively reduces to approximately 3,342 ha in 2020 for trend scenario and slightly decreases to approximately 3,627 ha for integrated-land use management scenario (Table 4). It is notice that the main suitable habitats for Black-crested Bulbul are located inside the SERS but a few patches were pre-
[Table 4.] Landscape indices of predicted occurrence for Black-crested Bulbul in 2008 and 2020

Landscape indices of predicted occurrence for Black-crested Bulbul in 2008 and 2020
dicted in the west and in the north outside the SERS (Fig. 4). This is due to Black-crested Bulbul’s ability to inhabit remnant forest and ecotone between dense and open woodland (Lekagul and Round 2005). Suitable habitats inside the SERS were predicted at 27% in 2008 for integrated land-use management scenario, and 23.0% for trend scenario. However, suitable habitat patches outside the SERS would become fragmented.
The consequences of land-use/land-cover change on Black-crested Bulbul’s habitat can be observed by a number of landscape indices. The number of suitable patches would increase from 77 patches in 2008 to values of 129 patches in 2020 for the trend scenario, and 127 patches for the integrated land-use management scenario (Table 4). This index corresponds to mean patch size of suitable habitat, which decreased from 16.95 ha in 2008 to 6.79 ha and 7.72 ha in 2020 for the trend and the integrated land-use management scenarios, respectively. In addition, the total core area of suitable habitats derived from the trend scenario is significantly decreased (Table 4) clearly showing that suitable habitats are more fragmented than the ones derived from the integrated land-use management scenario. However, the largest patch of suitable habitat relatively increases from 11.54% in 2008 to 13.92 and 14.33% for the others due to small patches outside the SERS diminishing. Small and fragmented habitat patches surrounded by human-dominant land uses can be considered as sink habitat (Forman 1995). These research findings indicated that future land-use/land-cover in the SERS would cause negative impacts on Black-crested Bulbul’s habitat and consequently on the recreational and educational values of the SERS because Black-crested Bulbul is a popular species for bird watching activity and nature education.
This research used a spatial-explicit land-use transition model (Dyna-CLUE model) to predict future land-use/land-cover changes in the SERS landscape, which resulted from encroachment in the buffer zone, restriction policy in the SERS, long-term plantation and rehabilitation programs and forest fire prevention policy. In addition, we employed the Maxent model to evaluate the consequences of land-use/land-cover changes on the occurrence of Black-crested Bulbul.
The Dyna-CLUE model was chosen for this study because it explicitly addresses the dynamics of the different future land demands (Verburg et al. 2004) driven by expansion of agriculture, forest plantation and biodiversity conservation. Earlier land use models in Thailand such as the Markov Chain Model use previous land use trends to predict what will happen in the future without considering the role of changes in the controlling natural, political and sociological factors (Ongsomwang 1986). Therefore, the Markov Chain Models are not capable of addressing the different scenarios presented in this paper. In addition, we used a pixel resolution of 100 × 100 m or 1 ha, which was likely equivalent to the mapping unit of land-use/land-cover maps derived from visual interpretation of satellite images (Trisurat 2010) and compatible with the spatial scale of the different data used and the computational requirements of the modeling such as soil map. The results indicated that future deforestation is unlikely to be found in the SERS although restriction policy is not implemented under trend scenario, except in the western part of the SERS (Fig. 2). This is due to rugged terrain, soil properties and proximity to road and village being determined as significant factors for agriculture expansion (Table 2).
We selected the Maxent model to predict potential occurrence for Black-crested Bulbul because it requires only presence data and habitat factors and its performance is considered to be better than other methods using presence-only data (Elith et al. 2006, Tognelli et al. 2009). This performance can be observed by the evaluation of predictive accuracy using the independent occurrence data (testing data) of 20% of the total presence observations. In addition, the results of Maxent model revealed that distance to dry evergreen forest, distance to secondary growth and distance to road are important factors for Black-crested Bulbul distribution because this species prefers to inhabit the ecotone between dense forest and open woodland (Lekagul and Round 2005). Our results are relevant to the same findings of McClure (1974), which were conducted in Khao Yai National Park in Nakhon Ratchasima Province.
Fig. 4 shows that there are a few patches of suitable habitat in the west and in the north of SERS in 2008 but they are likely to disappear in 2020. This is due to remaining secondary growth in the west and dry dipterocarp forest in the north being converted to agriculture and secondary growth, respectively. In addition, the ecotone between evergreen forest and deciduous forest, which is considered preferable habitats for Black-crested Bulbul (McClure 1974, Lekagul and Round 2005) are substantially reduced. Our results clearly indicated that Black-crested Bulbul habitat would deteriorate under the trend scenario but this problem is less for the integrated land-use management scenario.
The SERS was established to demonstrate sustainable forest management and biodiversity conservation. However, future land-use/land-cover changes would diminish some services of the SERS contributing to local communities and public societies such as serving as a rich storehouse of biodiversity and providing opportuniforties for recreation and education to nature lovers. Rehabilitating degraded forest inside the SERS, promoting forest plantation for mitigating illegal fuel wood collection and providing alternative economic incentives for local people, as well as renewable energy are necessary steps in ending forest degradation, but it should not stop there. Strict regulation inside the SERS and properly allocated land use need to be put in place, and the ecosystem services of the biosphere reserve need to be made more visible to the public. This research can contribute to developing approaches to the decision-making that accounts for the changing relationship between human activities and ecosystems.
Future research should assess consequences of land-use/land-cover changes on other ecosystem services in the SERS such as maintaining soil fertility, genetic diversity, pollination, and water resources and how human behaviors affect pressure and pulse dynamics and ecosystem processes. In addition, the economic values of these services should be measured and made visible and tangible. More understanding of the benefits that humans obtain from ecosystems (i.e., ecosystem services) and cause and consequence of disturbance regimes caused by human activities on structure and composition of ecosystem and ultimately to human outcomes can raise local awareness and convince decision-makers to sustain ecosystem services for long periods of time (Carpenter and Folke 2006).