Soil is the second largest source of atmospheric CO2,the gas produced by the respiratory activities of plant roots and microbes (Schlesinger and Andrews 2000).Knowledge of the seasonal trends in CO2 efflux from the soil (soil respiration) is important for simulating and predicting future atmospheric CO2 concentrations and the global carbon budget. Soil respiration is controlled by various environmental factors, including the temperature,moisture, and nutrient content of the soil. In the absence of drought stress, soil temperature is the most reliable predictor of soil respiration (Moncrieff and Fang 1999, Rayment and Jarvis 2000). An exponential relationship exists between soil respiration and soil temperature,as commonly described using the van't Hoff function or Arrhenius equation (Winkler et al. 1996). An increase in the reaction rate per 10°C increase in temperature (
The temperature sensitivity of soil respiration has been treated as a constant in many ecosystem respiration models. However, the Arrhenius and van't Hoff assumptions of constant temperature sensitivity for respiratory enzymes at all temperatures is incorrect (Davidson and Janssens 2006). Furthermore, spatiotemporal variations in soil temperature affect the respiratory responses of autotrophs and heterotrophs. There is no doubt that simulating soil respiration without an understanding of the variation in the temperature sensitivity of soil respiration limits model utility. The use of a constant, seasonal
Some published studies have demonstrated that the
Reference respiration (Rref) is another important factor that characterizes temperature dependence models of soil respiration. Rref represents the magnitude of respiration at a given temperature, and, in the present study, it is used to express the average soil respiration, as it is calculated from average soil temperature. Few studies have been conducted on the seasonal variations in
Attempts should be made to understand the seasonal temperature sensitivity of soil respiration under a Japanese monsoon climate and determine which factor can influence temperature sensitivity. The temperature sensitivity of soil respiration can be analyzed by comparing the
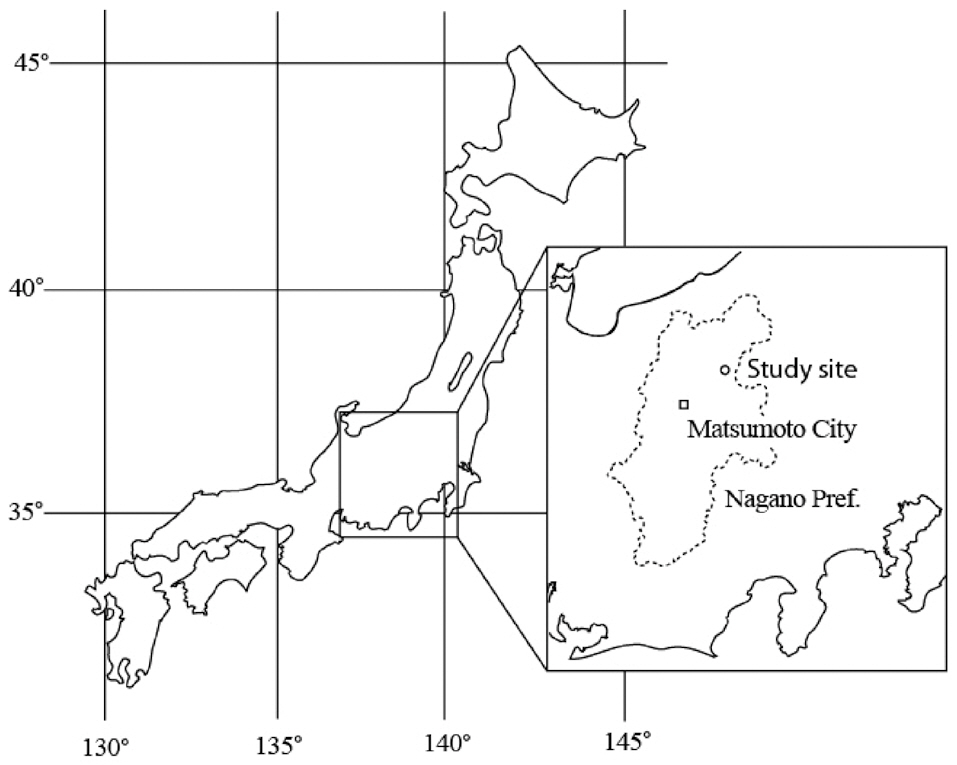
Soil respiration measurements were conducted in a 10-m × 10-m study plot in a Pinus/Betula mixed forest at the Sugadaira Montane Research Center (36°36′ N, 138°21′ E, 1,300 m a.s.l.), University of Tsukuba, Nagano Prefecture, located in the central region of Honshu, the main island of Japan (Fig. 1). The forest is dominated by 40-year-old red pine and has developed from managed grassland dominated by
son at our study site is from April to October; thus, these two periods of study represent the end and the beginning of the growing season, respectively.
The mean annual precipitation was 1,800 mm, with two small peaks in June and September. The soil is snow covered from December to early April, with a maximum depth of more than 1-m in March.
The soil is a dark-colored, humid Andosol, and the soil profile is composed of an O horizon (< 3 cm thick), an A horizon (40-50 cm thick), and a B horizon (deeper than 50 cm). The soil carbon content at 0-10 cm and 10-20 cm was 18% and 11%, respectively. The corresponding C/N ratios were 16.5 (0-10 cm) and 17.9 (10-20 cm). Soil total porosity was approximately 87%, and soil bulk density was 0.4 g/g. Soil pH measured in August 2002 was 5.0 at 0-10 cm. The amount of carbon accumulated in the 7.6-cm-thick litter layer was 0.15 kg/m2.
Soil respiration was continuously measured during the period of falling temperature from August 7, 2003 to October 13, 2003, and during the period of rising temperature from May 2, 2004 to July 2, 2004 using an open-top chamber (OTC) system. The OTC system consisted of three parts: a chamber, a sampling control unit, and a CO2 analyzer. The architecture of the chamber was the same as that developed by Fang and Moncrieff (1998) and Mariko et al. (2003). The chamber was constructed from a PVC collar, with a height of 23 cm (upper part, 15.5 cm; lower part, 8.5 cm) and a diameter of 16.5 cm, and a plastic bowl with a diameter of approximately 15 cm designed to regulate gas flow inside the chamber. Each chamber was equipped with two lines for the uptake of sample gas and reference gas. The sample gas was collected through a thin acrylic pipe penetrating the plastic bowl, the bottom of which was exposed to the air space above the soil surface. The reference gas, which flowed from the atmosphere through the chamber-bowl space to the chamber inside, was collected by a vinyl pipe with small holes, which was installed at mid-height on the inside wall of the chamber. The sample and reference gases were continuously pumped through a vinyl tube (10-m long with a 6-mm i.d.) to the gas sampling control unit at a rate of 1 L/min. The sampling control unit facilitated the switching of nine sets of sampling and reference lines at a constant time interval (4 min) using a sequencer and an electric valve.
Water vapor in the pumped sampling and reference gases was removed by a deci-filter (SUNSEP-W model SEC-M04-70; Asahi Glass Engineering Co. Ltd., Chiba, Japan) before measuring the CO2 concentration using a CO2 analyzer (IRGA: BINOS 100 & 100 4P; Rosemount Analytical, Hanau, Germany). The IRGA data were continuously logged every 20-s by a data logger (Hioki 8240; Hioki E.E. Corp., Nagano, Japan). We used the data for the last 3 min of a 4-min measurement period for flux calculations using the following equation:

where
>
Soil temperature and soil water content
Soil temperatures inside each chamber at 0, 5, and 10 cm from the surface of the A layer were monitored and logged every 20-s using a thermocouple and a data logger (Hioki 8240; Hioki E.E. Corp., Nagano, Japan) while measuring soil respiration. Moreover, the volumetric SWC at 10 cm from the A horizon was gravimetrically determined continuously every 30 min at 5 points inside the 10-m × 10-m study plot using a time domain reflectometry sensor (model EC-20; Decagon Devices Inc., Pullman, WA, USA) with two 20 cm long probes and a data logger (Em-5; Decagon Devices Inc.).
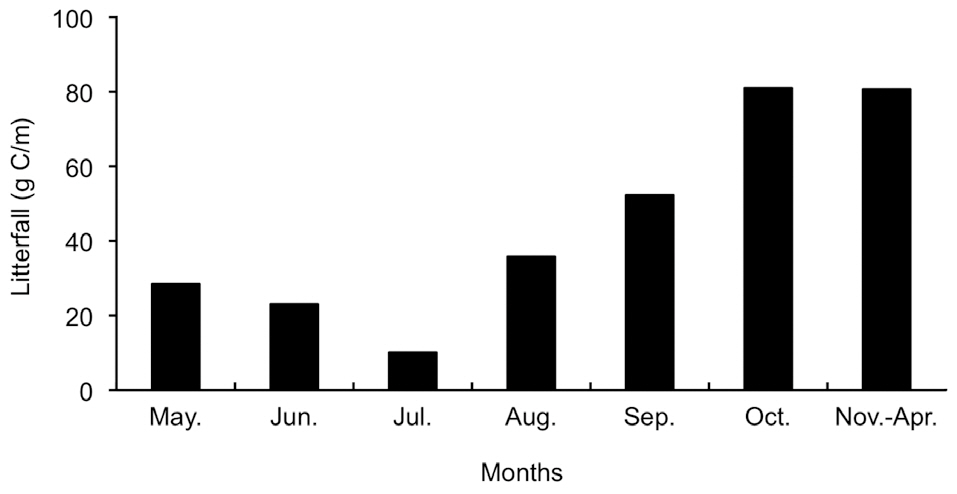
To determine carbon input to the soil in April 2003, 16 litter traps (60 cm dia., 1-m height) were established in a lattice arrangement within a larger plot of 15-m × 15-m, including a plot to measure soil respiration. Litterfall was collected monthly during the growing season (May-October) of 2003 and weighed after drying in an oven for 24 h at 80°C. Carbon content was then determined using an NC analyzer (model NC-900; Sumikca Chemical
Analysis Service Ltd., Tokyo, Japan). Litterfall during the non-growing season (November-April) was collected in April 2004.
To clarify the effect of root growth on soil respiration, we estimated fine root production using the in-growth core method (Smit et al. 2000) at our study site. Nylon mesh bags with a mesh size of about 4 mm were prepared. The bags had a diameter of 5 cm and were about 30 cm long. To insert bags into the soil, a hole was drilled into the soil using a stainless steel cylinder to a depth of 30 cm. After removing the cylinder and soil, the bags were inserted and filled with sieved soil without plant roots. On December 2005 and April 2006, mesh bags were inserted into the soil. The mesh bags were opened six times in 2006 (April, May, June, August, October, and November). Five replications were added to each bag at each opening. After collecting the mesh bags, the soil in the bags was sieved and roots were weighed after drying in an oven for 24-h at 80°C. We calculated net root growth rate from these results.
>
Soil temperature and soil water content
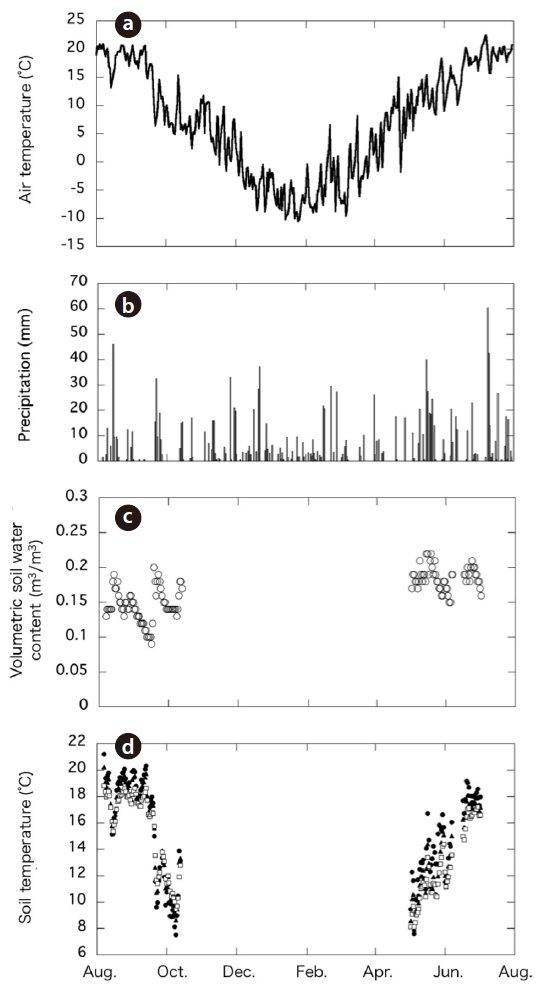
The total amount of precipitation during the study period (August 2003 to July 2004) was 1,376 mm. The daily mean air temperature from August 2003 to July 2004 ranged from 22°C in July to -10°C in January; the mean annual temperature was 7.0°C (Fig. 2a). The ranges and average air temperatures during the two periods were similar: air temperature declined from 20°C to 4.9°C during the period of falling temperature (August-October) and increased from 5.6°C to 20.2°C during the period of rising temperature (May-July). Despite the temporal difference in temperature between the two periods, the mean air temperatures during the periods of rising and falling temperature were similar: 15.1°C and 13.8°C, respectively. Overall, the period of rising temperature corresponded with the start of the growing season and the period of maximum plant growth. In contrast, the period of falling temperature started when the air temperature began to fall and continued until the end of the growing season.
Soil temperature (at 0, 5, and 10 cm) showed a seasonal trend similar to that of air temperature (Fig. 2d). The
spatial variation in soil temperature was not significant at any given measurement depth among the nine chambers (data not shown). However, the temperature range (T
The volumetric SWC during the periods of falling and rising temperature ranged from 9% to 20% and 15% to 22%, respectively (Fig. 2b) and did not appear to exhibit temporal variation. The spatial variation of the SWC was small (< 4%).
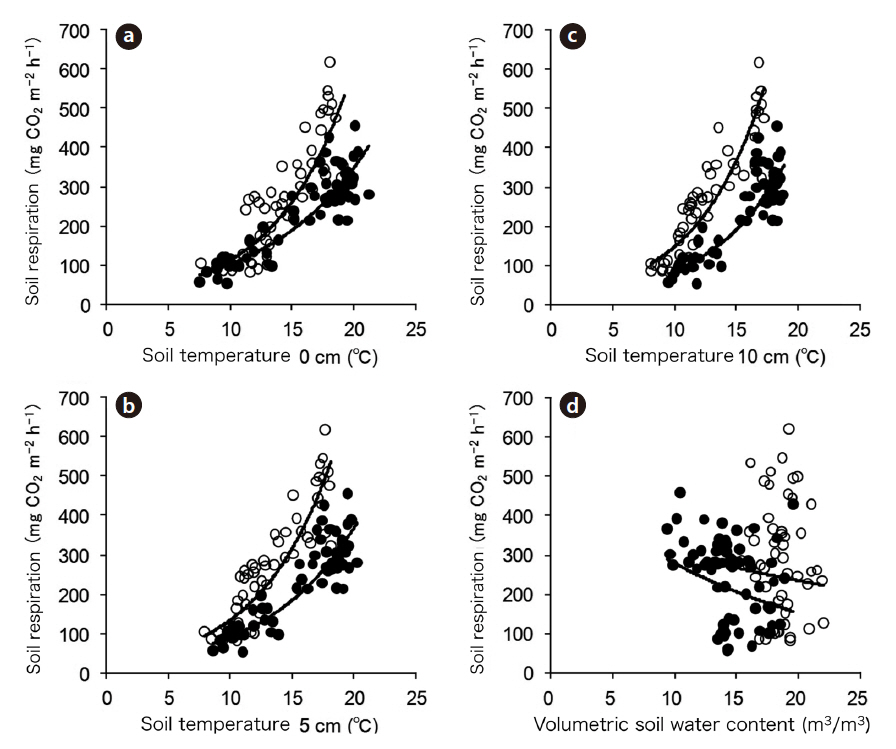
We obtained data for 67 days during the period of falling temperature and for 53 days during the period of rising temperature per chamber, with the exception of chambers 9 and 6 during the period of falling temperature due to a technical error in measurement. Soil respiration data from multiple chambers were gathered and then analyzed. The highest and lowest values of the daily mean soil respiration rate were 457 mg CO2 m?2 h?1 on September 13, 2003 and 53 mg CO2 m?2 h?1 on October 1, 2003, respectively, during the period of falling temperature, and 620 mg CO2 m?2 h?1 on June 22, 2004 and 81 mg CO2 m?2 h?1 on May 5, 2004, respectively, during the period of rising temperature.
Soil respiration was strongly correlated with soil temperatures at 0, 5, and 10 cm (Fig. 3a, 3b, and 3c) during both periods, which was well expressed by the following simple exponential function:

where
From Eq. 2, the

We define

Table 1 shows the
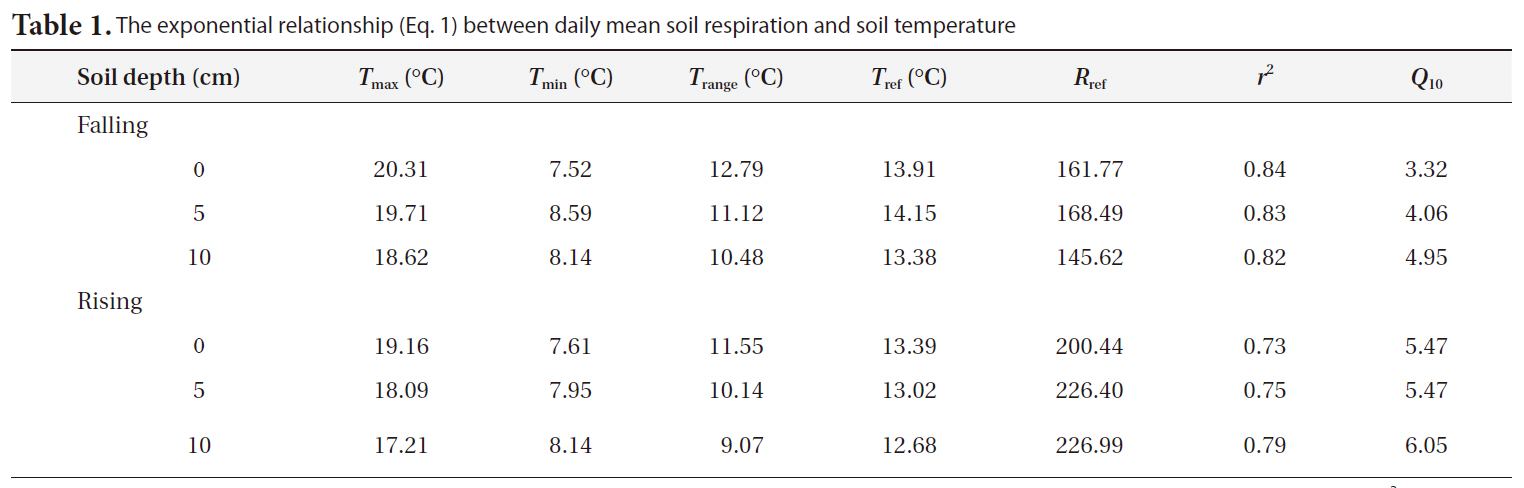
The exponential relationship (Eq. 1) between daily mean soil respiration and soil temperature
Fig. 4 shows the seasonal variation in litterfall during 2003 to 2004. A large peak was observed in September and October, and the spatial variation was small. We estimated soil carbon input from litterfall assuming that the carbon content of litterfall was 50%. There was approximately 30 g C d.w./m2 and 85 g C d.w./m2 during the periods of falling and rising temperature, respectively. The amount of litterfall in the period of falling temperature was twice that in the period of rising temperature and was mostly observed during the last month of measurements.
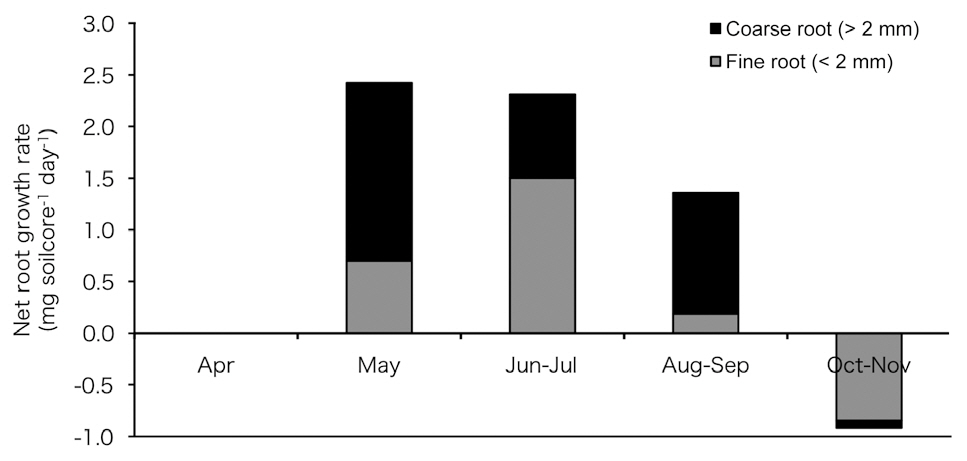
Fig. 5 shows the estimated net root growth rate (
declined in June and July; however, it increased again in August to September and was almost absent in October and November. Total net root growth rate (fine root growth + coarse root growth) was not observed in April and appeared in May but declined sharply in summer and autumn.
>
Influence of SWC on the temperature dependence of soil respiration
Similar to our results, many other researchers have found that the
Other researchers have suggested that the phenology of the above-ground plant parts or the balance of litter supply are factors controlling the seasonal fluctuation in the temperature sensitivity of soil respiration (Curiel Yuste et al. 2004, Mo et al. 2005, Davidson and Janssens 2006). However, at their study sites, the significant effects of SWC on soil respiration obscured the effects of other potential factors. In contrast, the lack of drought during the growing season at our site made it easier to assess other factors that might affect the sensitivity of soil respiration.
>
The effect of artificial observations
Several factors may explain the hysteresis of
>
The effect of root phenology
Root respiration represents a considerable fraction of soil respiration in temperate forests (Hanson et al. 2000), and the effect of root respiration on the temperature sensitivity of soil respiration is quite large. Root respiration comprises growth respiration, which is proportional to root growth rate and maintenance respiration, which is proportional to root biomass, and these two respiratory processes differ in their effect on
Seasonal variations in root growth respiration can be presumed from our results of seasonal net root growth rate using the ingrowth core (Fig. 5), which was high during the rising temperature period (May to July) and low during the falling temperature period (August to October). This result suggests greater growth respiration activity during the period of rising temperature than that during the period of falling temperature, and this could be one of the factors contributing to the high
Heterotroph respiration in the rhizosphere is strongly influenced by root mortality and the supply of exudation substrate. At the beginning of the period of rising temperature, large amounts of photosynthesis are allocated to below-ground plant parts in response to rapid growth and may be supplied as root exudates. Root exudates mainly comprise readily decomposable substances such as organic acid anions, phytosiderophores, sugars, vitamins, and amino acids (Dakora and Phillips 2002), and the exudation process contributed to a high
Generally, the seasonal variation in heterotrophic respiration is influenced, in part, by the timing of litterfall, which serves as a substrate for microbial decomposition. For example, Curiel Yuste et al. (2005) reported that autumn litterfall was followed by a rapid increase in soil respiration despite decreasing soil temperature in temperate oak forests. If an accelerating effect of fresh litter on soil respiration had occurred in our
In the study of Curiel Yuste et al. (2005), newly supplied “oak litter” would have enhanced soil microbe respiratory activity. However, the accelerating effect of fresh litter on soil respiration may be caused by the high decomposability of oak litter. The dead needle leaves of conifers, which have a higher content of lignin than the leaves of broadleaf trees, have low decomposability (Osono and Takeda 2005). Moreover, because the temperature was low when litterfall occurred and the soil was covered by snow, the effect of decomposing fresh “conifer-mixed” litterfall during the period of falling temperature could be small.
We suggest that root phenology and litterfall are the two main factors contributing to the difference in soil respiration characteristics, particularly temperature dependence and the magnitude of soil respiration between periods of rising and falling temperature. Biological factors such as root phenology and the quality and temporal availability of substrates are key parameters that characterize the seasonality of soil respiration in Asian monsoon forests, which typically experience humid summers and large temperature fluctuations. We found an apparent seasonal change in the characteristics of soil respiration in a