Wetlands are often created as compensatory mitigation under Section 404 of Clean Water Act in the United States (National Research Council 2001), but created wetlands may initially lack structural diversity and often fail to support biotic communities comparable to those in similar, naturally occurring wetlands (Zedler and Callaway 1999, Campbell et al. 2002, Spieles 2005). Vegetation attributes such as percent cover, species identity, species richness, and wetland indicator status have been used as a measure of mitigation success in most post-construction monitoring of created mitigation wetlands (Breaux and Serefiddin 1999, Spieles 2005). Early vegetation establishment can have profound implications on the development of the structure and function of created mitigation wetlands (Atkinson et al. 2005, Spieles 2005), as the vegetation community influences the biogeochemical functions expected to develop, such as primary productivity,soil development, and nutrient retention. Wetland mitigation success thus often relies on the early establishment and development of the wetland vegetationcommunity. However, vegetation in created wetlands often displays lower species richness, less cover, higher occurrence of non-native or invasive species, and fewer obligate wetlands species than that of natural wetlands (Galatowitsch and van der Valk 1996, Zedler and Callaway 1999, Campbell et al. 2002, Spieles 2005). Thus, identifying wetland creation methods that would enhance the development of a diverse wetland plant community may increase the likelihood of mitigation success.
Microtopography is especially important in wetlands, where < 5 cm of variation in elevation can shift hydrologic conditions experienced by individual plant species (Vivian-Smith 1997, Werner and Zedler 2002, Peach and Zedler 2006, Moser et al. 2007). At low water level conditions, microhighs may be exposed to aerobic conditions while microlows and flats are still under water in anaerobic conditions, creating ecological niches or a mosaic of microenvironments that vary in abiotic and biotic conditions. These microenvironments are known to influence seed germination, seedling establishment, and seedling growth, critical phases in the life cycle of plants (Smith and Capelle 1992, Schupp 1995, Moser et al. 2007). Microenvironments also facilitate or inhibit plant species distribution by influencing resource heterogeneity (Baer et al. 2005), interspecific differences in habitat preferences (Vivian-Smith 1997), and differential mortality and growth rates at different microtopographic positions (Jerling 1981, Hamrick and Lee 1987). Created mitigation wetlands often lack microtopography due to use of heavy machinery for grading during the construction process (Whittecar and Daniels 1999, Stolt et al. 2000). Grading is usually performed to assure surface variation within a centimeter or two of the site plan elevation, so the microtopographic variability more typical of natural settings is eliminated or significantly reduced (Stolt et al. 2000).
The hydrologic regime can play a major role in the distribution and abundance of wetland plants (Cronk and Fennessy 2001). The flooded areas of wetlands support flood tolerant species (van der Valk 1981, Bruland and Richardson 2005), although these areas support fewer species in general (Bruland and Richardson 2005). On the other hand, exposed (non-flooded) soils characterized by moist conditions can facilitate seed germination (van der Valk and Davis 1978, Ahn et al. 2004) and seedling growth of a variety of wetland species (Cronk and Fennessy 2001). Effects of temporal and spatial variability of soil moisture or water table depth on wetland plant structure and composition have been extensively studied (Titus 1990, Vivian-Smith 1997, Bruland and Richardson 2005, Dwire et al. 2006). Wetlands characterized by topographic variability would include both flooded and non-flooded areas with varying moisture levels or water table depths, supporting a wide variety of wetland species and influencing plant community composition and distribution.
The goal of the study is to investigate the effects of two design elements, hydrologic and microtopographic, on the first year vegetation community development in a created mitigation wetland. Little is known about the effects of design elements such as hydrologic regime and microtopography on the early development of plant community in created mitigation wetlands. The outcome of the study will be informative to wetland engineers and managers in wetland creation practices. The objectives of the study were to evaluate vegetation attributes (e.g., species richness, diversity, plant cover, floristic quality, and wetland indicator status) as affected by (a) presence/absence of disking-induced microtopography, and (b) by different hydrologic regime (i.e., dry vs. wet) in a newly created mitigation wetland.
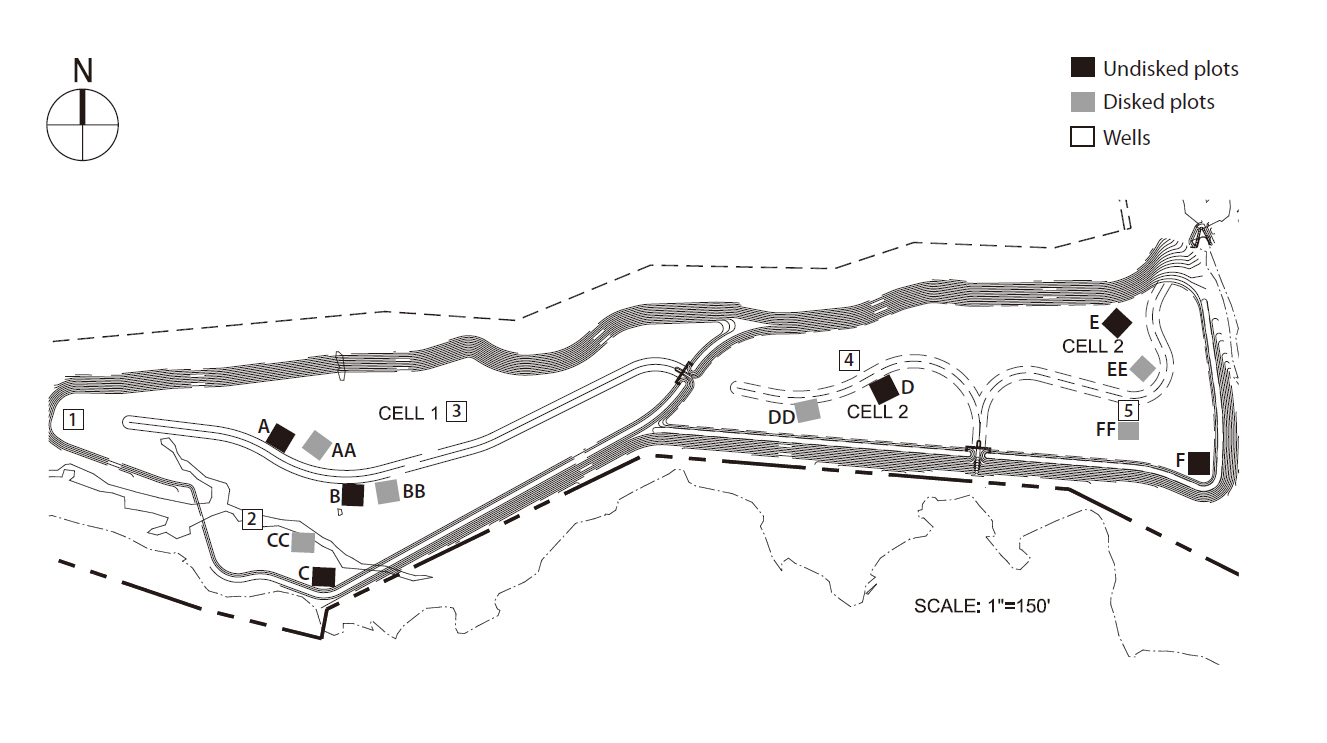
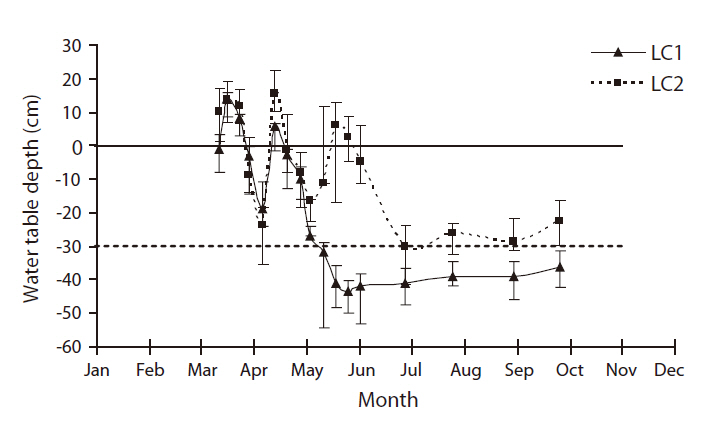
The study was performed in Loudoun County mitigation wetland (LC) (39°02.05´ N, 77°36.5´ W), a 32-acre wetland mitigation bank newly created in the northern Piedmont region of Virginia, during the summer of 2007. LC was constructed during July through August in 2006 by Wetland Studies and Solutions, Inc. (WSSI; Gainesville, VA, USA) and is located in the 100 year floodplain of Goose Creek and its tributary Big Branch. The wetland design includes 0.2 m topsoil atop a 0.3 m or thicker low permeability (1 × 10⁻⁷/ms) subsoil layer, resulting in a perched water table that fluctuates with precipitation. Groundwater exchange was negligible. The LC wetland consists of two contiguous sites (i.e., LC1 and LC2) separated by a berm with a drainage channel. LC1 was approximately 0.4 m higher in position than LC2 (Fig. 1). This design causes LC1 to drain quickly leaving it inundated only for very short periods during and after precipitation, while LC2 remains under standing water (i.e., < 12 cm) for several months. With the difference in hydrologic regime, we categorized LC1 as a dry site and LC2 as a wet site. Both sites were hydro-seeded in the summer of 2006 with commercially available wetland plant seed mix of 26 herbaceous plant species (at the rate of 1.5 g/m2) appropriate for the region and the intended hydrology
(e.g., wetland meadow as opposed to obligate wetland). Although the created wetlands are intended to mitigate the loss of palustrine forested wetlands, all trees planted in December, 2006 were still small saplings during our first-growing season vegetation study, so these wetlands can best be characterized as palustrine emergent.
Twelve 10 m × 10 m plots were randomly staked out in LC ? six in LC1 (i.e., A, AA, B, BB, C, CC) and another six in LC2 (D, DD, E, EE, F, FF). Three plots in each site were kept non-disked (i.e., single-lettered plot) while the rest of the wetland area was disked (i.e. double-lettered plots) during the construction. Each disked plot was adjacent to the non-disked plot to reduce variability in other environmental factors. At each plot, a set of 4 tangentially-conjoined circular transects (Moser et al. 2007) was placed randomly in a nested design; however, transects were always laid out in north-south direction with first reading (0 cm) at the southernmost extent of the transect to maintain consistency. The diameter of the smallest transect was 0.5 m, determined by assuming that the smallest zone of influence of microtopographic variation on plant species is within 0.5 m. Successive diameters of each transect were determined by doubling the previous diameter ? 1 m, 2 m, and 4 m, to address the effect of spatial scale of microtopography measurements.
Precipitation data were obtained from the weather station at Dulles International Airport. The Palmer Drought Severity Index (i.e., D0 to D2) (Heddinghause and Sabol 1991) was used to characterize precipitation conditions during the study period. In each site, the depth to water table was monitored using a 70 cm slotted well constructed of 3.18 cm (= 1 ¼˝) polyvinyl chloride pipe. Three wells were installed in LC1 and two in LC2 initially by the builder as part of their legal, post-construction monitoring (Fig. 1). Water table depth was measured weekly (
Field measurement of microtopography consisted of elevation measurements taken using surveying equipment (Sokkia SET4110 total station) in the study plots of each site. Measurements were taken at 10 cm intervals along the 0.5 m (
Using transect elevations, tortuosity (T, unitless) (Kamphorst et al. 2000) ? a measure of surface roughness ? and limiting elevation difference (LD, cm) (Linden and Van Doren 1986) ? a measure of surface relief ? were calculated to quantify microtopography for each transect as described in Moser et al. (2007). Because the size of the individual transect differed, the lag intervals used for each scale was different: for the 0.5 m-diameter transects, eight lag intervals (10-80 cm) as measured along the transect were used for analysis; for 1 m-diameter transects, fifteen lag intervals (10-150 cm) were analyzed; for 2 m-diameter transects, twenty lag distances (10-100 cm) were analyzed; and for 4 m-diameter transects, fifteen lag intervals (20-300 cm) were analyzed.
Species identity and percent cover of all herbaceous vegetation were recorded along each circular transect using 0.2 m2 circular quadrat. Vegetation data were collected at 80 cm intervals along the 0.5 m (
Species richness of each category per plot was determined from the number of species of each category that were recorded in each plot. Species richness per m2 for each plot was estimated using taxon-sampling curves to derive S for
Vegetation plots were assigned a wetland prevalence index (P. I.) value according to the weighted average of indicator ranks, excluding unidentified and non-listed species (Wentworth et al. 1988). The P. I. was calculated as P. I. = ΣWiAi / ΣAi, where, Wi is wetland indicator category index value for species I, Ai is relative cover estimate for species i, and i is individual species (Wentworth et al. 1988). and relative cover of each species in 0.2 m2 plots. Wetland indicator index values for each species were derived from the regional indicator categories and rank from 1 to 5 as follows: 1 = obligate wetland, 2 = facultative wetland (FACW), 3 = facultative (FAC), 4 = facultative upland (FACU), 5 = upland (UPL) (Wentworth 1988).
Differences between LC1 and LC2 in water table depths were examined by performing a Mann-Whitney U-test because of the non-normality in the data that did not respond to transformation. Effects of disking (disked vs. non-disked) and scale (0.5 m, 1 m, 2 m, or 4 m) on microtopographic indices (LD and T) were analyzed by using two-way multivariate analysis of variance (MANOVA). When two-way MANOVA revealed significant disking and scale effects, ANOVA was used for each response variable. Further, when ANOVA revealed significant scale effect, Fisher’s least significant difference (LSD) test was used for multiple comparisons of means. The effects of disking, scale, and hydrologic regime on the percent cover (overall, seeded, and volunteer taxa), species richness (overall, seeded, and volunteer taxa), H´ (overall, seeded, and volunteer taxa), and P. I. of overall taxa were analyzed using three-way MANOVA, then separately using ANOVA for each of the response variables when three-way MANOVA revealed significant effects. MANOVA analyses were conducted using Type IV sum-of-squares and an alpha level of 0.05 (due to unequal sample sizes, Pillai’s Trace was adopted as a more robust alternative to Wilks’ L). Vegetation data were tested for normality and homogeneity of variance, and to meet parametric assumptions appropriate transformations were applied as follows: square root (percent cover, species richness of overall taxa, and Shannon’s diversity of volunteer taxa), natural log (LD species richness of volunteer taxa), natural log (x+1) (species richness of seeded taxa and H´of overall taxa), and square root (k-x), where k is constant from which each score is subtracted so that the smallest score is 1 (P. I.) (Tabachnick and Fidell 2001). For transformed variables, mean values are reported in original untransformed units in results. The relationship between microtopographic indices and vegetation variables were examined by performing Pearson correlation analyses. All statistical analyses were performed using SPSS ver. 15.0 (SPSS 2006).
Within-plot similarity and between-plot dissimilarity and the contributions of individual species to similarity/dissimilarity of each plant category were examined by performing decomposition of the Bray-Curtis similarity used for ANOSIM using PRIMER (PRIMER-E Ltd. 2006).
There were five shallow wells in total for water table depth monitoring in LC, three in LC1 and two in LC2, fairly close to the study plots, both non-disked and disked that were literally side by side. Mean water table depths in two LC sites were fairly different in the hydrologic regime (Fig. 2). Overall, the water table depth of LC1 (i.e. dry site) was significantly lower than that of LC2 (i.e. wet site) (Mann-Whitney, U = 84,
above or near the surface until mid-June (Fig. 2). For rest of the growing season, the water table depths were well below the surface, exposing soils in both sites. The water table depth of LC1 remained fairly at and above 30 cm below the surface whereas that of LC2 remained mostly under 30 cm below the surface (Fig. 2). Although different in the hydrologic regime both LC1 and LC2 met the duration criterion for wetland hydrology (i.e., saturation or inundation within 30 cm of the soil surface for a consecutive number of days for at least 12.5 percent of the growing season (~30 days) (Federal Interagency Committee for Wetland Delineation 1989).
Soil moisture content (%) showed the same pattern between the two sites with the dry LC1 (9 ± 0.9) was significantly lower than that of LC2 (21 ± 2.9). However, no significant difference in soil moisture was found between disked and non-disked plots either in LC1 (disked = 8.3 ± 1.0, non-disked = 9.1 ± 1.6) or in LC2 (disked mean = 20.5 ± 5.6, non-disked mean = 21.5 ± 6.1). Previous studies suggested that microtopography induced by disking creates the prevalence of inundated/saturated conditions that would better support native wetland plant communities (Tweedy et al. 2001, Moser et al. 2007), which was not observed in our study. This may be due to the drought conditions experienced in the study area in 2007. Precipitation data obtained from the Dulles International Airport (Loudoun County, VA) during the period January 1-August 21, 2007 was 9.53 inches below normal. Only the month of April recorded precipitation data above the normal monthly precipitation, but only 0.16 inches above normal. Most of the growing season was under drought conditions in 2007 (National Drought Mitigation Center 2008). Drought severity was measured as D0 (i.e., abnormally dry) or D1 (i.e., moderately dry) mostly from May through October with a couple of D2 (severely dry) by National Drought Mitigation Center (2008).
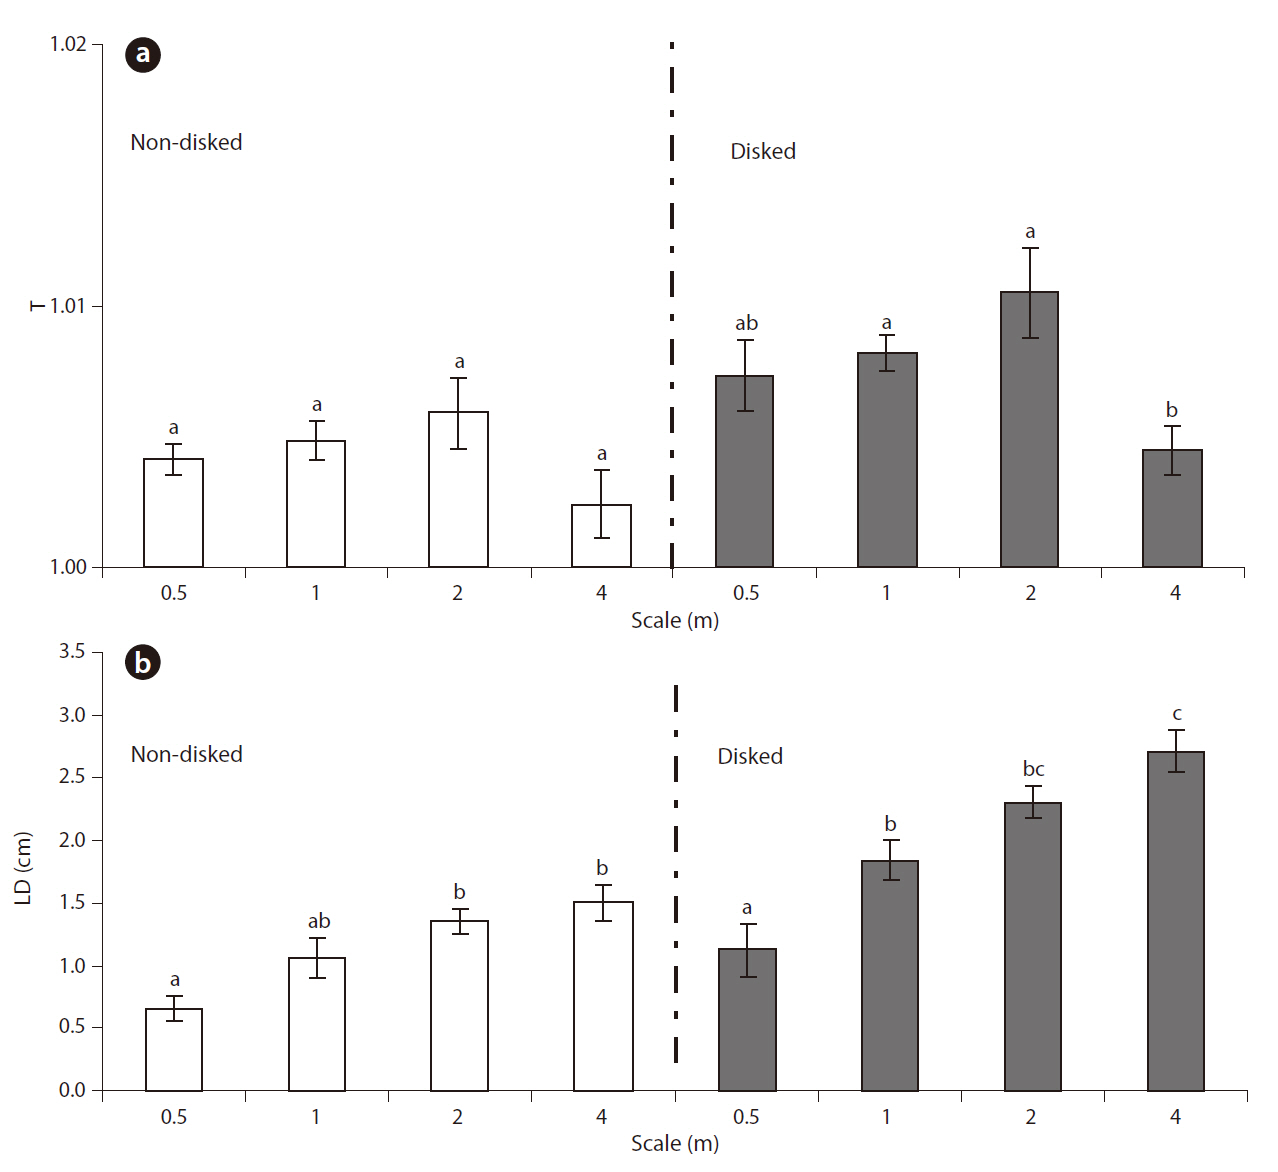
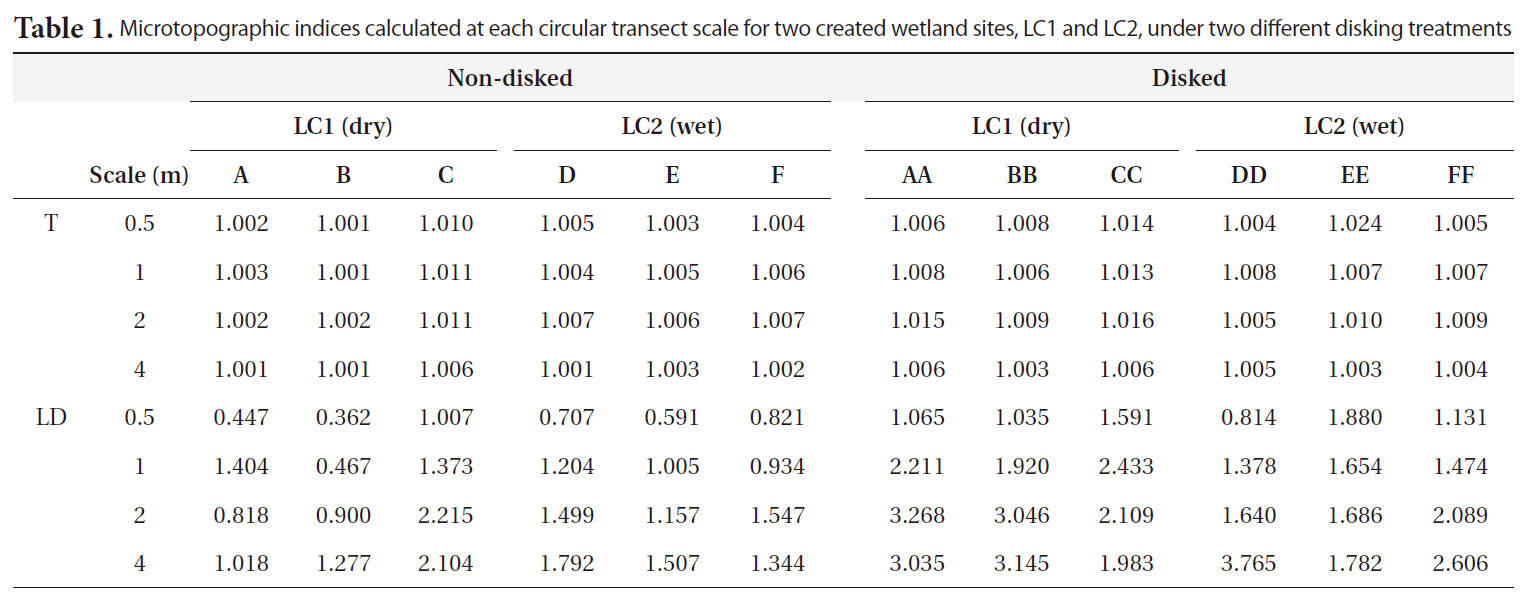
Microtopographic indices ranged from 1.001 to 1.024 for T and 0.362 to 3.765 cm for LD (Table 1). Results of MANOVA indicated that the effects of both disking and scale on the combined dependent variable of T and LD were significant (Disking: Pillai’s Trace = 0.480,
The microtopography of disked plots was higher than that of non-disked plots in terms of both T and LD, clearly showing the effect of disking in inducing microtopographic variation. There was greater distinction of LD between disked and non-disked plots as compared to that of T (Fig. 3a and 3b), suggesting that surface relief is more likely responsible for difference in microtopography between disked and non-disked plots than surface roughness. The range of values obtained for tortuosity (surface roughness) was within the range obtained by previous studies (1.00-1.02) (Werner and Zedler 2002, Moser et al. 2007). However, the range of LD values (0.36-3.77 cm) calculated in our study were relatively small being comparable to that (0.4-12.4 cm) of a previous study conducted in created wetlands with varying ages (i.e., 1-6 yrs old) in the Virginia piedmont (Moser et al. 2007).
Microtopography measured at different transect scales used drastic difference between the transect scales or specific patterns along the scale of transect in this study. Based on the resolution used in our measurement, wetland microtopography seemed to differ only minimally from extents of 0.5-4 m, a result similar to that of Morzaria-Luna et al. (2004)
Species richness and percent cover
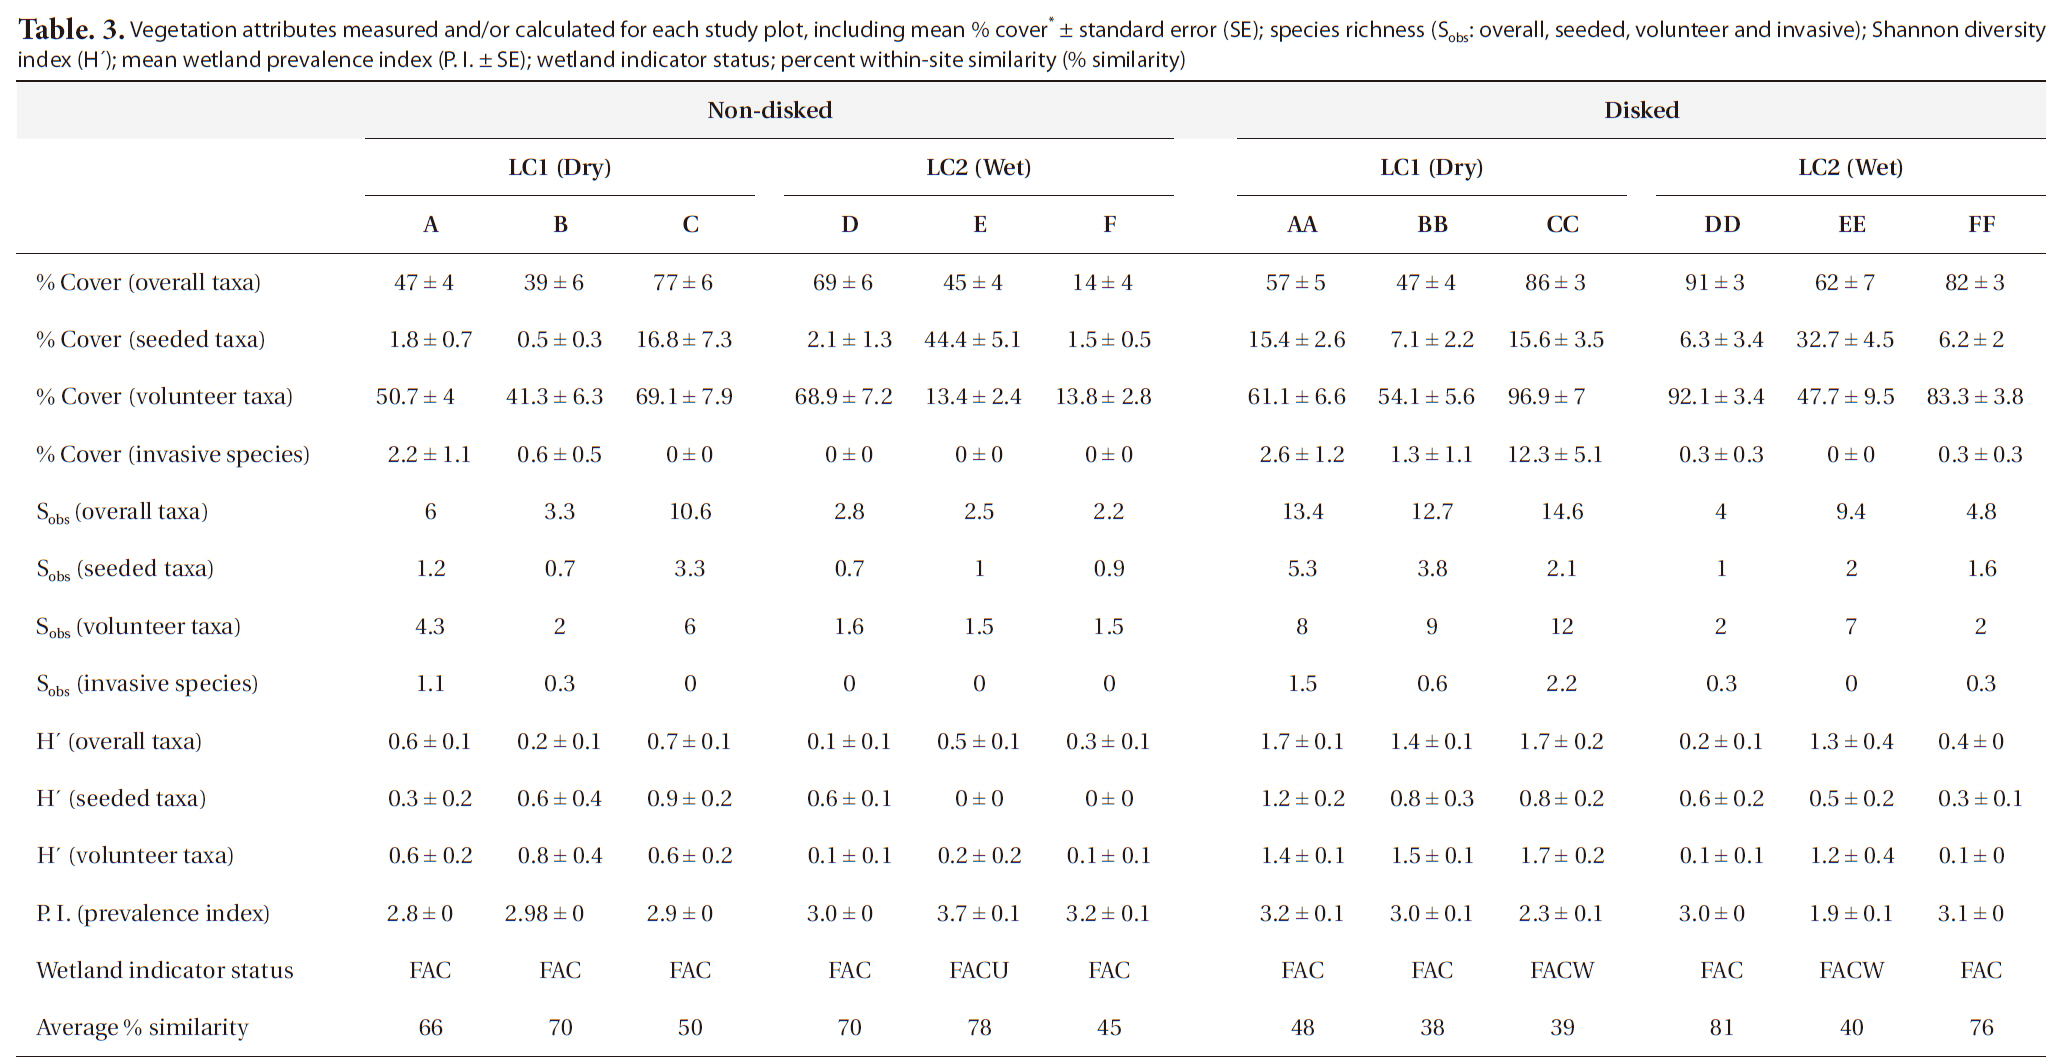
A total of 41 plant taxa (with 40 identified to species and 1 identified to genus) (Table 2) was observed in the newly created wetland during the first growing season. Overall, there were 29 volunteer species originally not included in the seed mix, and 12 seeded taxa found (Table 2). This number of volunteers indicates a high rate of natural seed dispersal into, and germination/survival within the study sites. A total of 40 species were found in disked plots whereas 28 taxa were found in non-disked plots (Table. 2 and 3). More seeded and volunteer taxa were present consistently in disked plots than in non-disked plots, showing a significantly positive effect of disking on species richness (Table. 3 and 4). There was significant difference in species richness also by hydrologic regime (i.e., dry LC1 vs. wet LC2) (Table 2). Of the total taxa, 34 were found in the dry LC1 with only 20 in the wet LC2 (Table 3). The same trend was observed for seeded and volunteer taxa with the species richness being higher in the dry site (LC1) compared to the wet site (LC2). Regardless, only 46% of the originally seeded taxa were found with the rest of the seeded taxa not being evident in our study. This may be due to the drought conditions (i.e., moderate and abnormally dry) (National Drought Mitigation Center 2008), under which the wetland seed mix may have partially failed to germinate during the growing season. It seems the drought condition for the first growing season allowed drought tolerant, volunteer plants to become established in the mitigation wetland (Table 2). There were several FACU and UPL species found among the volunteers established (Table 2). These species most likely are expected to be out-competed by more obligate wetland species (i.e., < FAC) when precipitation levels are normal and the site is wetter. The percent cover of vegetation ranged overall between 14-91% per plot (Table 3). Percent cover of overall, seeded, and volunteer taxa in disked plots was higher than or comparable to those of non-disked plots (Table 3).
Moser et al. (2007) reported a similarly positive effect of disking on species richness and percent cover, but the

Microtopographic indices calculated at each circular transect scale for two created wetland sites LC1 and LC2 under two different disking treatments
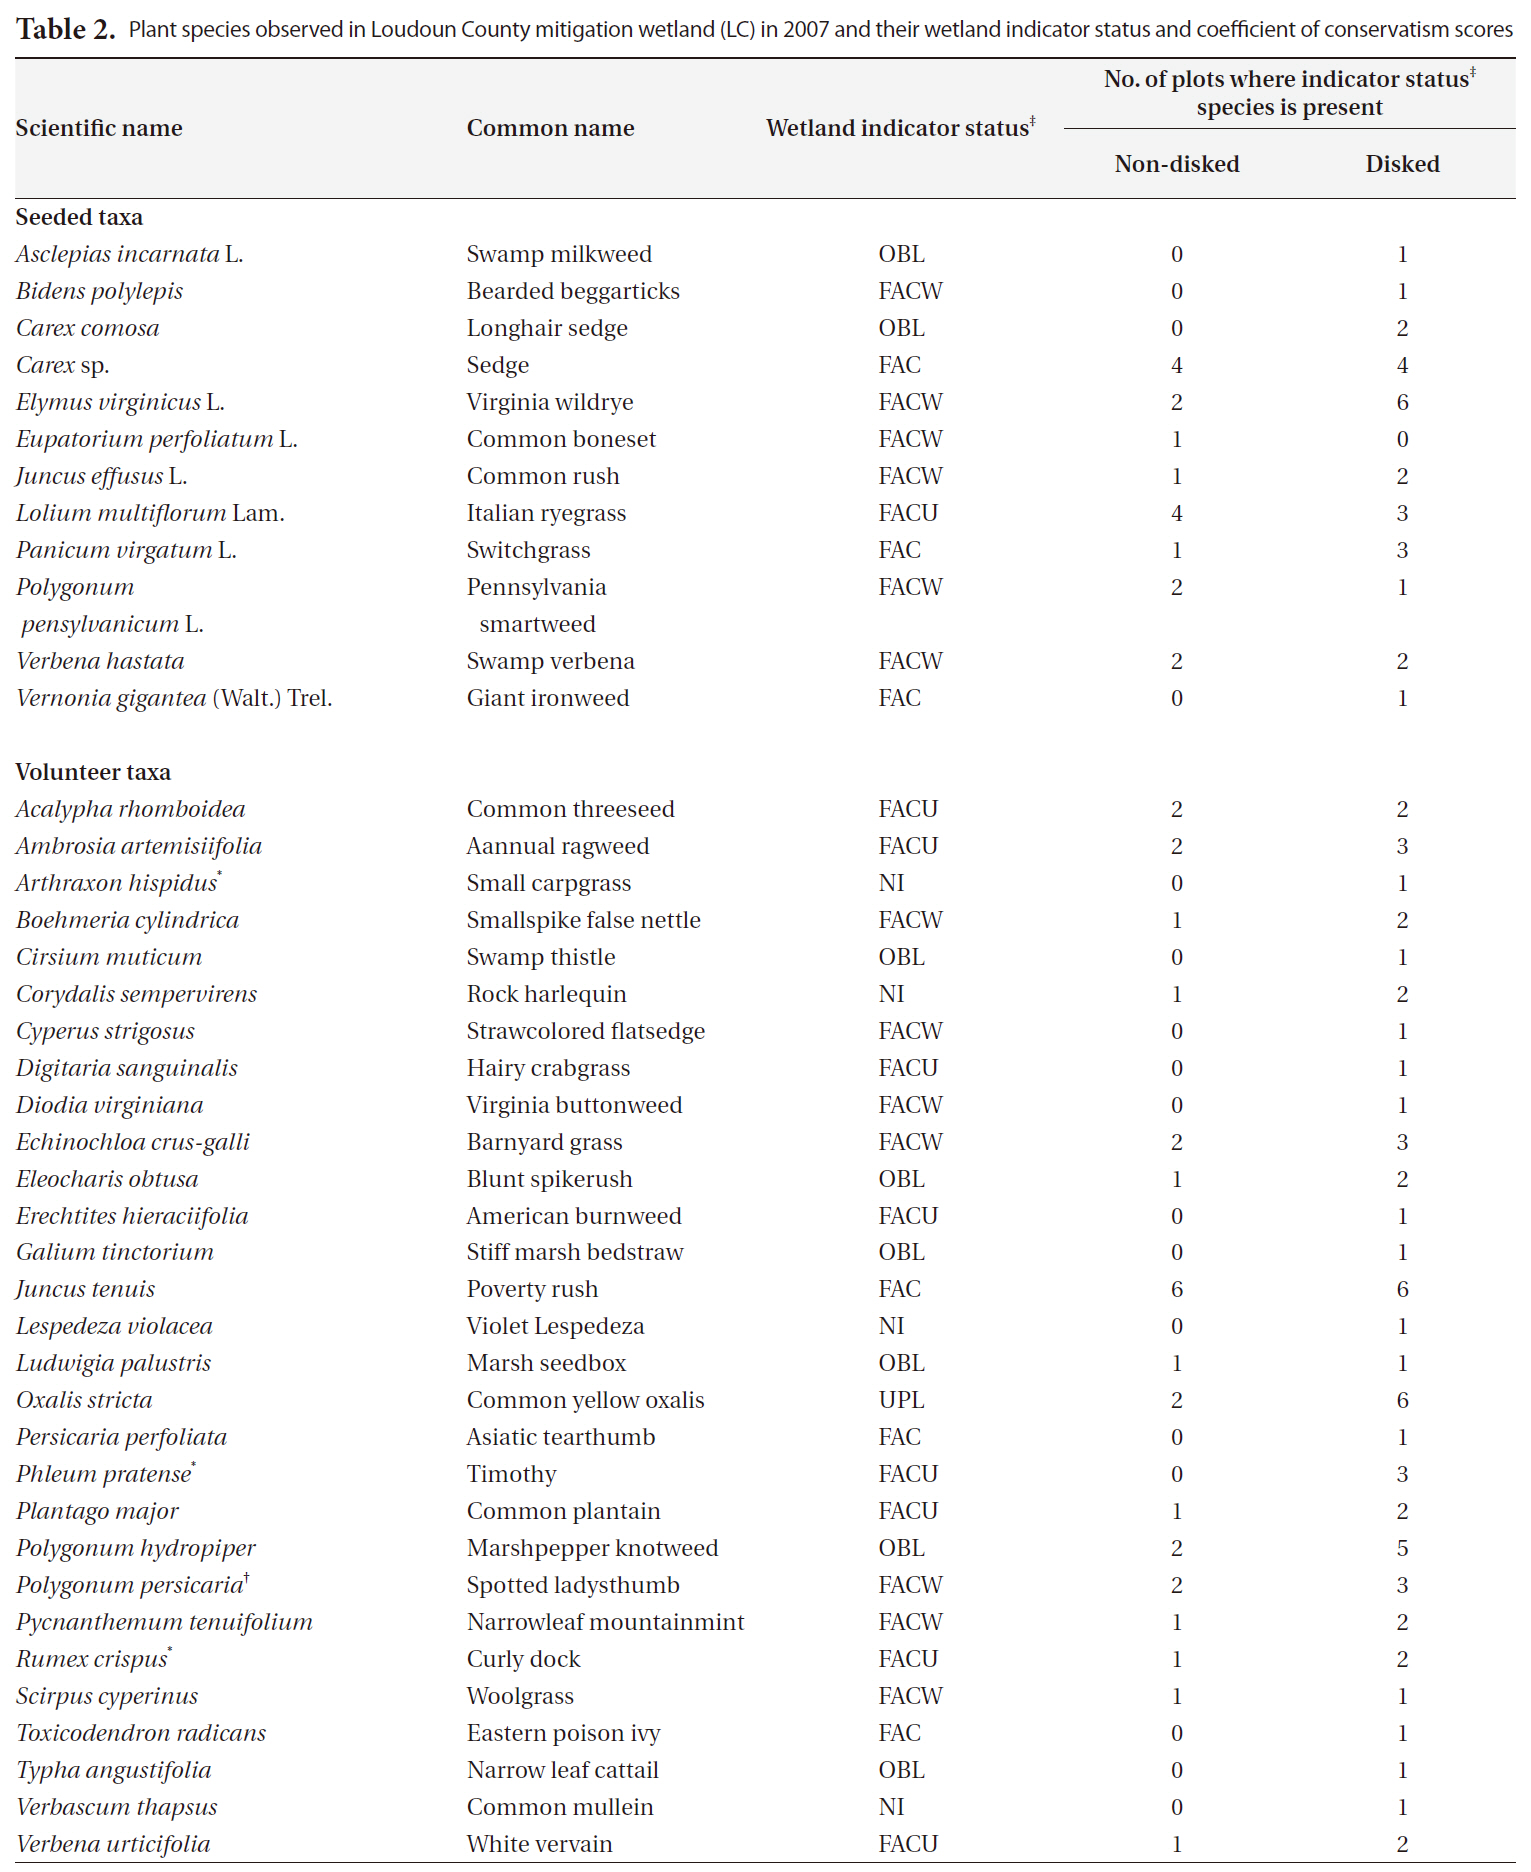
Plant species observed in Loudoun County mitigation wetland (LC) in 2007 and their wetland indicator status and coefficient of conservatism scores

Vegetation attributes measured and/or calculated for each study plot including mean % cover* ± standard error (SE); species richness (Sobs: overall seeded volunteer and invasive); Shannon diversity index (H´); mean wetland prevalence index (P. I. ± SE); wetland indicator status; percent within-site similarity (% similarity)
result was partially masked by the ages of created wetlands investigated in that study. As a created wetland ages with further development of vegetation communities microtopography may change due to factors other than initial disking, especially biogenically by tussock-forming wetland plants (Werner and Zedler 2002). Since our study focused solely on the first growing season plant community development in a newly created wetland our results clearly showed the positive effects of disking as a creation method and/or a design element on vegetation establishment.
Invasive species
It has been shown that invasive species can change or control the structure and function of wetlands (Galatowitsch et al. 1999, Zelder and Kercher 2004), thus a careful monitoring of invasive species is important, especially in early plant community development in created wetlands. In our study, there were many transects (plots) with no invasive species found. Only few plots (i.e., 1-3) (Table 2) had invasive species making the data highly skewed for statistical comparisons between different site conditions. The number and the percent cover of invasive species found per plot ranged from 0 to 2.2 and from 0 up to 12.3%, respectively (Table 3). The highest percent cover (i.e., 12.3%) was observed in one plot that was dry and disked (i.e., plot CC) (Table 3) with all other plots being under 3%, showing that dry condition facilitated natural colonization of invasive species that were mostly FACU. The percentage of invasive species contributing to overall species richness was fairly small in both disked plots (8.3%) and non-disked plots (5%) as well as in dry plots (9.4%) and wet plots (2.3%) (Table 3), all under the 10% criterion for mitigation success criteria.
Shannon-Weiner diversity (H’)
Shannon diversity (H´) of overall taxa was 69% and 57% higher in disked plots than in non-disked in LC1 and LC2, respectively (Table 3). H´s of seeded and volunteer taxa were 49% and 62% higher, respectively, in disked plots than those in non-disked plots (Table 3). H´s of seeded and volunteer taxa were 65% and 72% higher, respectively, in the dry LC1 than those in the wet LC2 (Table 3). Microtopographic heterogeneity is a controlling factor on the diversity of vegetation (Titus 1990, Vivian-Smith 1997). The result of this study proves that the previous finding applies to artificially-induced microtopographic heterogeneity and its influence on the diversity of vegetation community. Overall, H’ values were comparable with those found in a created wetland bank by the same builder in the vicinity of LC (Moser et al. 2007).
Wetland prevalence index (P. I.)
Most of the study plots except one non-disked plot (FACU) (Table 3) were dominated by wetland plants (≤ FAC) (Table 3). P. I. was not significantly different either between disked (~2.9) and non-disked plots (3.1) or between LC1 (dry, 2.9) and LC2 (wet, 3.0) sites (Table 4), showing no specific effects of either disking or hydrologic regime. Microtopography indices (i.e., T and LD) calculated were significantly higher in disked plots than in non-disked plots (see Section Microtopography), but it does not seem to affect wetland indicator status of vegetation community established in the first year. However, there were more FACW and FAC species found in disked plots than in non-disked plots overall (Table 3), suggesting that microtopography induced by disking may have contributed to better supporting wetland plant establishment in the first year, which was similar to what was found in older created wetlands in the same region (Moser et al. 2007). P. I. was significantly negatively correlated with T, indicating the more rough the surface the lower the P. I. (i.e., more of a wetland plant status), however, was not correlated with LD. Even the clear difference in hydrologic regime between the dry LC1 and wet LC2 observed did not lead to any significant difference in plot-level wetland indicator status of vegetation (Table 4) in this study.
Within plot plant-taxa similarity (%)
Disked plots in LC1 consistently showed lower within plot similarity than non-disked plots in both LC1 and LC2, indicating that disking may have contributed to enhance plant taxa heterogeneity in those plots as reflected in their H´s (Table 3). There was, though, no notable difference in within plot similarity between LC1 and LC2 (i.e., by hydrologic regime). Disking during the construction may assist to prevent occupancy of generalist species in the early development of vegetation community.
Effects of hydrologic and microtopographic designs on vegetation community establishment
Results of MANOVA revealed no scale effect (Pillai’s Trace = 0.885,
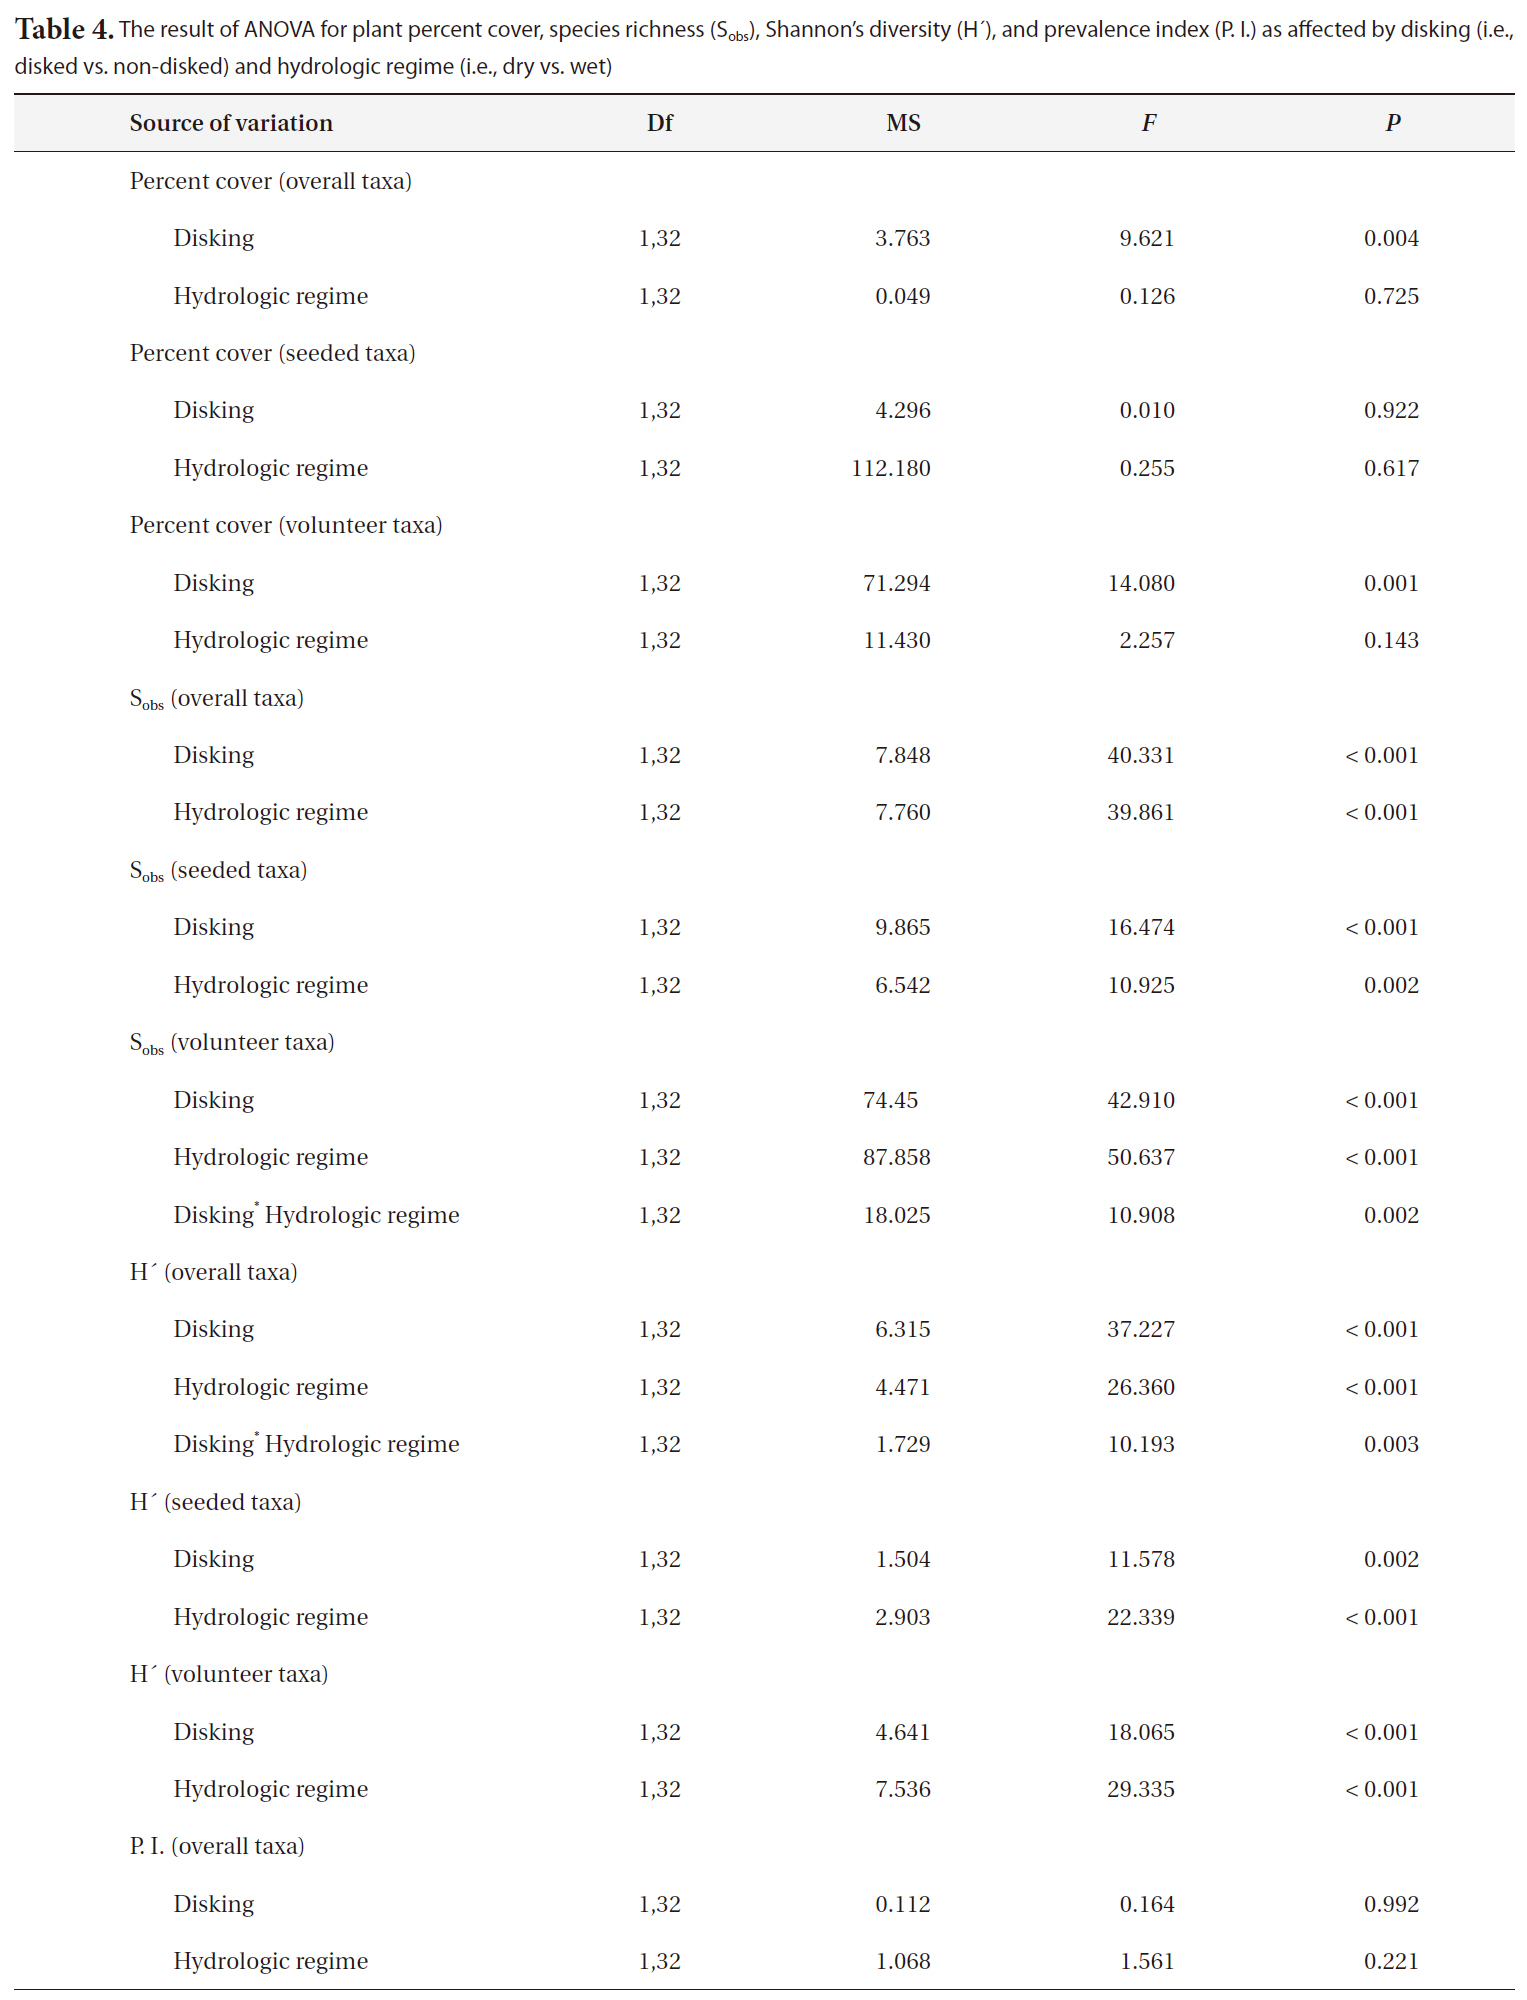
The result of ANOVA for plant percent cover species richness (Sobs)Shannon’s diversity (H´) and prevalence index (P. I.) as affected by disking (i.e. disked vs. non-disked) and hydrologic regime (i.e. dry vs. wet)
sponse variables as reported in Table 4. The overall and volunteer taxa percent covers were significantly higher in disked plots than in non-disked plots (Table 4), showing a positive effect of disking practice on the first-year plant establishment in a created mitigation wetland. However, the percent cover of vegetation did not differ by hydrologic regime between L1 (dry) and L2 (wet) (Table 4). The percent cover of overall taxa were significantly correlated with both T and LD (Table 5) in a positive manner, indicating induced microtopography enhanced the development in vegetation coverage in the newly created wetland. T was strongly correlated with seeded taxa development whereas LD was correlated with volunteer taxa (Table 5).
The species richness for each of overall, seeded, and volunteer taxa was significantly influenced by both disking and hydrologic regime (Table 4). The correlation between the species richness and two microtopography indices (i.e., T and LD) was highly significant (Table 5). Disked plots showed 55% higher overall taxon richness and 53% higher seeded taxon richness than those of non-disked plots, and the dry LC1 showed 55% higher overall taxon richness and 45% seeded taxon richness than those of the wet LC2 (Table 3). There was no significant interaction between disking and hydrologic regime, except for volunteer taxa (Table 4). The volunteer taxon richness was more pronounced in the disked, dry plots, being 59% higher than in non-disked, dry plots (Table 3).
H´ for overall, seeded, and volunteer species was affected significantly by disking and hydrologic regime, and there was also a two-way interaction between disking and hydrologic regime for overall taxa (Table 4). H´ was higher in disked than non-disked plots, showing the positive effect of disking on establishing the diversity of vegetation community. Hydrologic regime also significantly influenced the vegetation development during the first growing season (Table 4), promoting the diversity in a relatively dry condition. It seems that the dry condition in LC1 has facilitated the colonization of volunteer species. The species diversity of vegetation was highest in
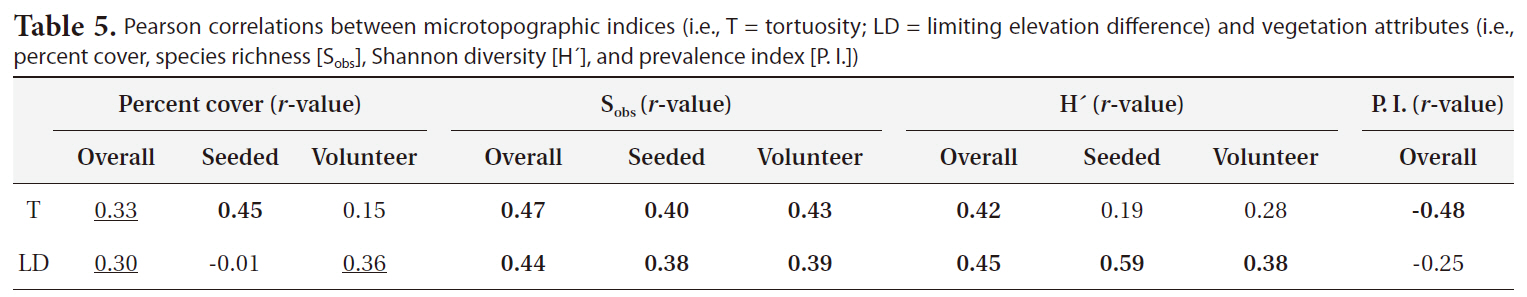
Pearson correlations between microtopographic indices (i.e. T = tortuosity; LD = limiting elevation difference) and vegetation attributes (i.e. percent cover species richness [Sobs] Shannon diversity [H´] and prevalence index [P. I.])
dry, disked plots (Table 4). There was a significant correlation between the H´ of vegetation of all categories (i.e., overall, seeded, and volunteer taxa) and LD (Table 5). H´s of overall taxa was significantly correlated with T whereas H´s of seeded and volunteer taxa were not (Table 5). The result was consistent with Moser et al. (2007), proving the positive effect of microtopography on vegetation development.
The positive effect of disking was clear in this study due to the specific treatment design of disking. Microtopographic variation was also found strongly correlated with the distribution and vigor of individual plant species and communities in wetlands (Watt 1947, Schlesinger 1978). However, it is not clear how long the positive effect of disking-induced microtopography as part of construction of mitigation bank will last. The positive effects of disking might fade away over time, but some studies suggested that biogenic microtopographic features such as plant-oriented mounds and hummocks usually develop as plant community mature over several growing seasons, contributing to habit diversity (Werner and Zedler 2002, Peach and Zedler 2006). Further investigation is needed on how mechanically-induced heterogeneity (i.e., by disking) may relate to microtopographic features that are being biogenically developed along with plant community maturation in created wetlands.
Understanding design elements of a newly created mitigation wetland and their influence on vegetation development is important to ensuring the success of mitigation. This study examined two design elements ? microtopography and hydrologic regime ? and their effects on the first year vegetation development pattern of a newly created mitigation wetland. Created mitigation wetlands often lack microtopography due to use of heavy machinery for grading during construction process, which often lead to a vegetatively monotypic system with few species. This study found that design elements such as hydrology and disking-induced microtopography significantly influenced the vegetation community in a mitigation wetland in the first growing season. Our study showed that disking clearly enhanced microtopography in created wetlands and the increased microtopography positively influenced percent cover, species richness, and diversity of wetland vegetation. Disking-induced microtopography also contributed to preventing the dominance of generalist species by lowering within-group similarity of vegetation community and encouraging the colonization of more volunteer taxa in a created mitigation wetland. Hydrologic regime characterized by longer periods of unsaturated or low water table levels was also associated with higher species richness and diversity. Wetland engineers and managers are recommended to incorporate disking as part of construction of wetlands with a careful management of hydrologic regime for successful vegetation establishment and development in a newly created wetland.


![Pearson correlations between microtopographic indices (i.e. T = tortuosity; LD = limiting elevation difference) and vegetation attributes (i.e. percent cover species richness [Sobs] Shannon diversity [H´] and prevalence index [P. I.])](http://oak.go.kr/repository/journal/10624/STHHCL_2010_v33n4_363_t005.jpg)