Fire is a natural and important component of many ecosystems (Lynch 1941, Komarek 1974, Abrahamson 1984, Pyne 2003, Omi 2005). In ecosystems where fire occurs frequently plants have developed complex adaptations(Bond and Keeley 2005). Historically, fire has been used in wetland ecosystems to remove vegetation to facilitate seasonal hunting and trapping. In Gulf Coast marshes, fire was used to expose alligators (
Recently, prescribed fire has become an integral part of resource management in wetlands and is widely accepted as a technique to stimulate the growth of wetland vegetation(Kozlowski and Ahlgren 1974, Main and Barry 2002,Slocum et al. 2003, Bond and Keeley 2005). For example,prescribed fire can help maintain the required conditions for fire-adapted plants species, by promoting the flowering of herbaceous species and fruit production of some woody species (Lynch 1941, Main and Barry 2002). Fire can improve nutritional quality of plants for both wild and domestic animals, reduce hazardous fuel loads to prevent ecosystem devastation, and manage competing vegetation (Slocum et al. 2003, Omi 2005). The removal of accumulated litter by burning has been found to maximize the annual production and reproductive effort of a wetland plant that is a viable food source for wildlife (Ward 1968, Johnson and Knapp 1995). In addition, the removal of overshadowing vegetation by burning often stimulates primary plant production by increasing light penetration to the ground (Gabrey and Afton 2001). Zontek (1966) found that prescribed fire not only increased food supplies for wildlife, but improved habitat conditions by controlling tree diseases in coastal. It turned out that burned wetland areas were effective in attracting a higher concentration of snow geese (
There can be some negative aspects of prescribed fire, especially if it is not implemented carefully. Using fire to reduce vegetation cover will, at least temporarily, increase the risk of soil erosion and, if improperly timed, fire can actually reduce plant productivity (Omi 2005). Burning during the wrong environmental conditions (e.g. high winds or minimal soil moisture) can be dangerous and harmful to desirable plants (Lynch 1941, Omi 2005), causing temporary degradation of aesthetic quality until vegetation recovers, temporary reduction of visibility, temporary displacement of some animal species, along with the possible negative public health effects from the increase of particulate matter in the atmosphere during, and shortly following burning (Bond and Keeley 2005, Omi 2005).
The studies investigating the effects of prescribed fire often use above-ground plant biomass as an indicator of marsh ecosystem production and health, primarily due to the ability to measure above-ground portions of plants as a comparable index (Schubauer and Hopkinson 1984, Turner et al. 2004). But the overall vegetation productivity may not be estimated correctly based on above-ground vegetation alone (Whigham and Simpson 1978, Tuner et al. 2004). Below-ground vegetation biomass plays an integral role in regulating ecosystem processes including soil organic matter accumulation in tidal wetlands, and in the ability for these systems to keep pace with sea-level rise (Turner et al. 2004, Saunders et al. 2006). Therefore, below-ground biomass production of vegetation could be a better index for monitoring marsh ecosystem health than above-ground plant biomass (Turner et al. 2004). Moreover, little information is currently available on below-ground biomass and their responses to environmental variables in coastal wetlands. This is probably due to the labor required to assess live and dead root and rhizome biomass, and the lack of a standardized method. Methods to separate live from dead tissues are time consuming and the separation of organic material from the soil matrix can be extremely difficult (Schubauer and Hopkinson 1984).
The goal of the study is to measure the above- and below-ground biomass of native marsh vegetation in a brackish marsh on the eastern shore of Maryland, USA where prescribed fire has been used as a management tool. The study attempts to investigate the effects of different prescribed burn regimes on stem density and above- and below-ground biomass production of five wetland plants commonly found in Chesapeake Bay tidal brackish marshes.
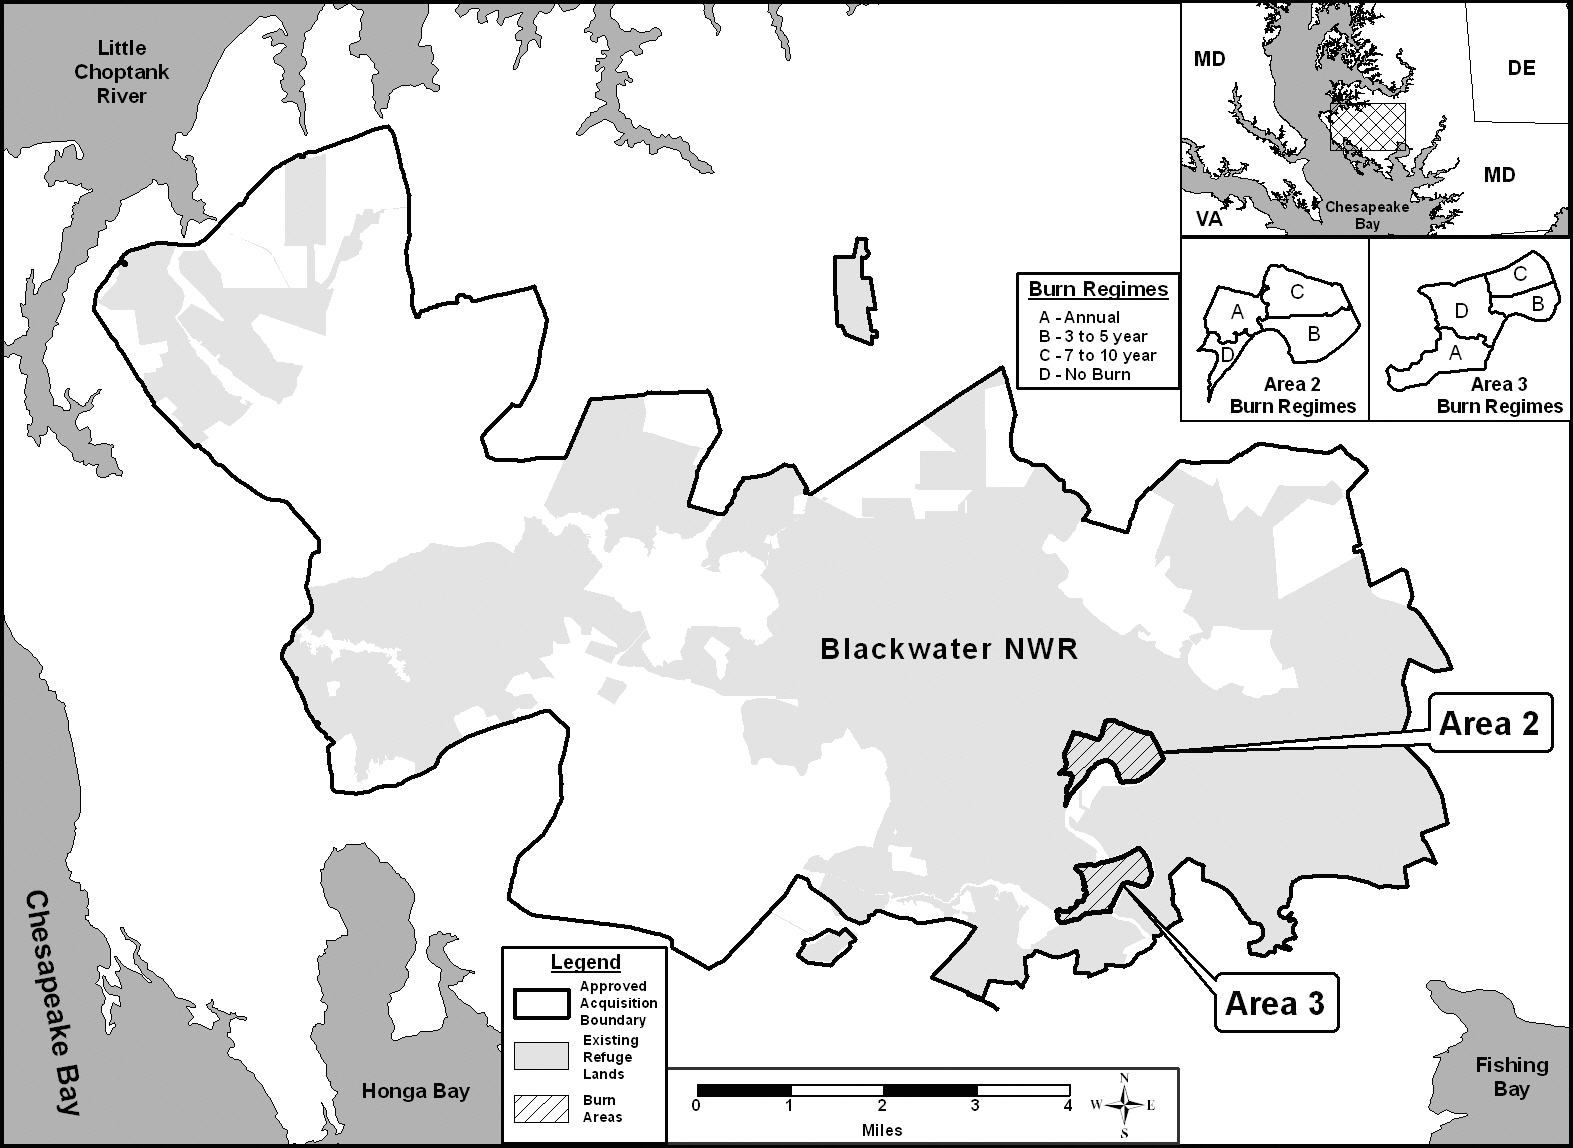
Field research was carried out at Blackwater National Wildlife Refuge (NWR, 38.57o N, 76.00o W). The refuge covers approximately 109.3 km2 of fresh and brackish wetlands located on the eastern shore, 19.3 km (i.e. 12 miles) south of Cambridge, Maryland, USA (Fig. 1). Blackwater NWR has been designated as a waterfowl sanctuary for birds migrating along the Atlantic Flyway, from Canada to Florida. Blackwater NWR is recognized as a “Wetlands of International Importance” by the Ramsar Convention and has been selected as a priority wetland in the North American Waterfowl Management Plan. Over 350 species of birds have been recorded using the Blackwater NWR and during peak migration in the fall (October through November) and early spring (February and March), tens of thousands of geese and ducks rest and feed in the Refuge. The largest populations of migrating waterfowl species found at Blackwater NWR are Canada and snow geese, mallards, black ducks, blue-winged teal ducks, green winged teal ducks, wood ducks and widgeons (U.S. Fish and Wildlife Service 2009a, 2009b).
Prescribed fire has been used as a management tool
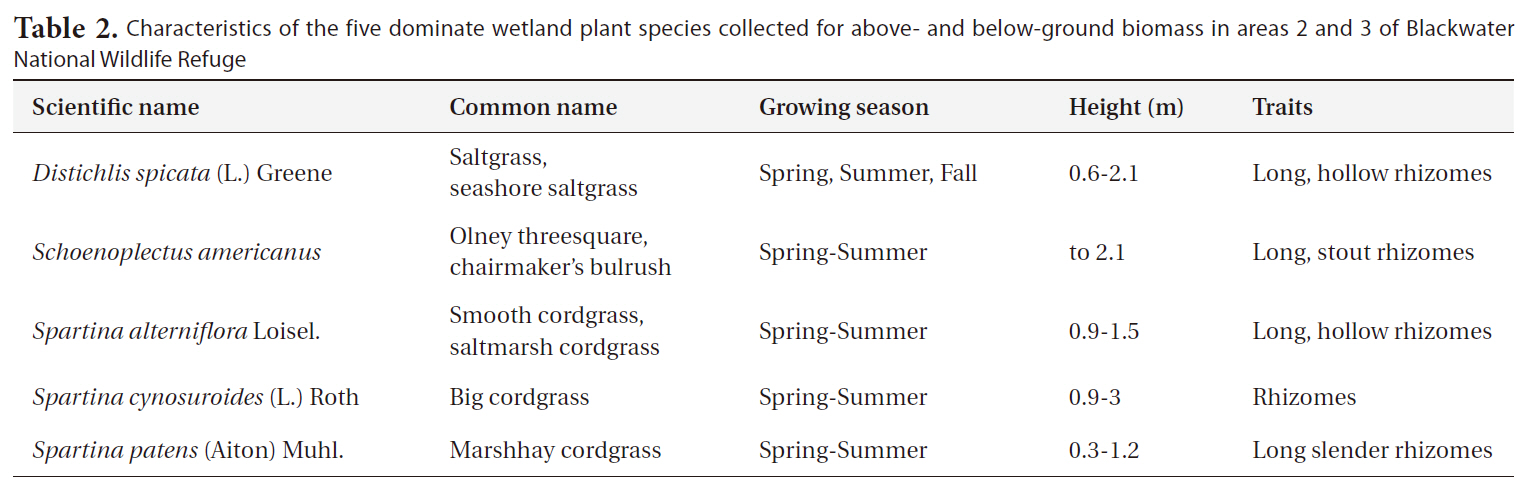
at Blackwater NWR since the 1970’s to increase and enhance marsh vegetation for the waterfowl using the refuge. The NWR consists of freshwater impoundments, brackish tidal wetlands, open fields, and mixed evergreen and deciduous forests. The areas used in the study are brackish tidal wetlands indicated as 2 and 3 in Fig. 1. The areas are dominated by five wetland plants typical of coastal marshes (
The study was established as a randomized block design. As illustrated in the inset in Fig. 1, each of the two study areas was divided into 4 treatments, representing three different prescribed burn regimes (A = annual burn, B = 3-5 year burn, C = 7-10 year burn) and control (D = no burn). Ten permanent north-south transects were located through each treatment to ensure representative coverage. The transects were marked with a fire resistant fiberglass post at the beginning of the study. Each year one sample plot was randomly located along each transect (
>
Vegetation sampling and biomass measurement
Above- and below-ground vegetation samples were collected from each of the 80 plots during the September through December period in both 2004 and 2005. Note that in years of burns, the burn occurred prior to and the vegetative sampling occurred at the end of the growing season.
Each plot was at least 20 meters from the water, and visually the total vegetation coverage was at or near 100%. Using a 25 cm × 25 cm (0.25 m2) PVC frame, all above-ground vegetation within the frame was clipped at the soil surface. All plant matter was collected and placed into a large plastic bag, labeled and taken to the lab. To negate the effects of our sampling on vegetation, we located each plot randomly every year and recorded the location with the PLGPR. Above-ground vegetation analyzed for total above-ground biomass (including litter), live above-ground biomass, above-ground biomass by species, stem density and litter. The stems of plants harvested were counted and recorded by each species. Litter was defined as dead plant material that could not be identified down to species. The litter represented vegetative growth from previous seasons.
Once the above-ground vegetation sample was harvested, a below-ground vegetation core sample was collected in the center of the 0.25 m2 clipped area using a razor-edged steel Hargis corer (10 cm diameter, 30 cm depth). Cores were cut in the field into 0-10 cm and 11-30 cm sections, placed in plastic bags, labeled, stored in a cooler, returned to the lab and placed in a refrigerator. All below-ground samples were refrigerated until they were processed. Processing occurred within 30 days from the date of collection. Below-ground biomass samples were rinsed over a 1 mm mesh sieve to separate soils from the plant materials. Live biomass was hand separated from dead biomass. Live vegetation material was firm and pliable and typically light yellow to dark reddish brown in color whereas dead biomass was typically medium brown to black in color with a flaccid or slimy texture.
All vegetation samples were oven-dried at 60oC to a constant dry weight. Dried samples were weighed to the nearest 0.1 g and the dry weight was used for statistical analysis.
Above-ground biomass data were divided into such categories as total above-ground biomass (live biomass + litter), total above-ground live biomass (without litter), total live biomass by species, and stem density by species. For below-ground biomass, we had total below-ground biomass (live + dead), 0-30 cm live below-ground biomass, 0-10 cm live below ground biomass, and 11-30 cm live below-ground biomass. To compare samples, the biomass data were extrapolated to square meter (m2) (i.e., above-ground biomass and stem density from g/0.25m2 to g/m2; and the below-ground biomass from g/0.008 m2 area of the corer to g/m2), based on consistently dense vegetation cover (i.e., near 100% coverage of vegetation) in the field study plots. Data were analyzed by burn regimes in each year. Where there was no significant differences found between years, data were lumped to compare different burn regimes across the years (i.e., 2004 vs. 2005). Statistical analyses for the effects of burn regimes on above- and belowground biomass were conducted using a one-way analysis of variance (SPSS Inc. 2004). Tukey honestly significant difference multiple comparison tests were used to test pairwise contrasts of means for significance at
>
Burn history and vegetation characteristics
All areas used in the study had been burned, including control (i.e., no-burn) area, in the winter of 1998 to provide an equal basis for comparison. All burns conducted were mosaic burns with 5-10 cm of standing water on the soil surface to protect the below-ground vegetation from burning. The burn procedure left approximately 30% of above-ground vegetation unburned (personal communication, Bill Giese, Blackwater NWR). Since 1998, areas 2A and 3A have been burned annually. Areas 2B and 3B were burned in 2001 and again in 2005. And, areas 2C and 3C were burned in 2005 to complete a full cycle of burn regimes. Areas 2D and 3D have remained unburned since 1998 (Table 1).
The study areas are part of the brackish marsh in the refuge. They are approximately 60-80 cm above mean low water level, and and are flooded by high tides. The salinity measurements of water in the study areas ranged from 5-16 ppt during the growing season in this study (unpublished data at the Blackwater Wildlife Refuge, Cambridge, MD, USA). Rainfall at Blackwater NWR was 103.3 cm in 2004 and 94.9 cm in 2005; slightly lower than the overall historical average rainfall for this area of 110.4 cm (National Oceanic and Atmospheric Administration 2009a).
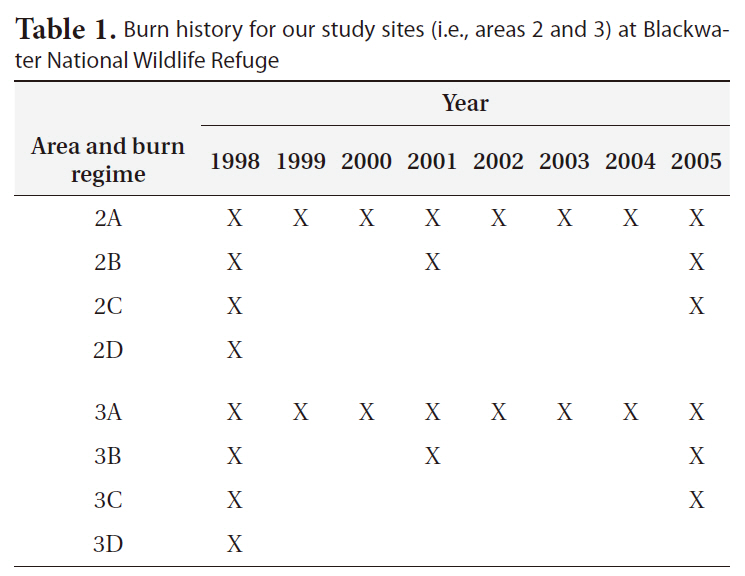
Burn history for our study sites (i.e. areas 2 and 3) at Blackwater National Wildlife Refuge
Tidal ranges were 0.664-1.208 m in 2004 and 0.857-1.218 m in 2005 at the refuge location, with higher and longer water levels above sea level in 2005 (National Oceanic and Atmospheric Administration 2009b).
The five plants were studied for response to burning:
>
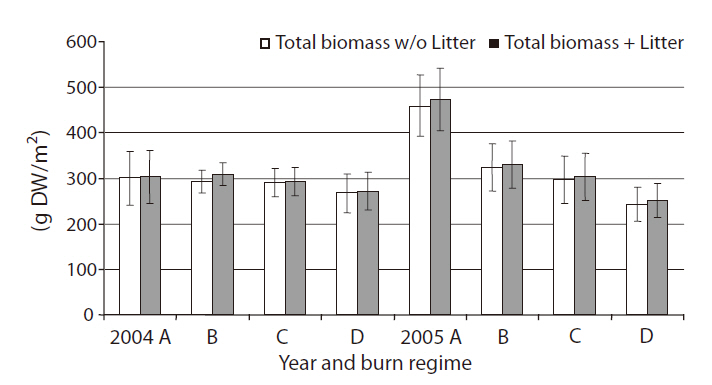
Total above-ground biomass with or without litter
Total above-ground biomass with litter ranged from 210 g/m2 up to 550 g/m2 (Fig. 2). Litter being a fairly small portion of the total above-ground biomass harvested (< 5%) with no difference between burn regimes (

Characteristics of the five dominate wetland plant species collected for above- and below-ground biomass in areas 2 and 3 of Blackwater National Wildlife Refuge
ference between the two years in above-ground biomass production (
We found no significant differences among burn regimes for total above-ground biomass, except for the case of annual burn sites in 2005. Previous studies have shown increases in vegetative biomass production for several species in coastal marshes by prescribed burns (de la Cruz and Hackney 1980, Johnson and Knapp 1995, Gabrey and Afton 2001, Flores 2003). However, the literature also reports a wide range of site specific and/or species-specific biomass responses to fire (de la Cruz and Hackney 1980, Dudley and Lajtha 1993, Schmalzer and Hinkle 1993, Gabrey and Afton 2001). Production of
Flores (2003) found significantly less litter in annual burn sites, but we found no significant difference in litter among burn regimes (
>
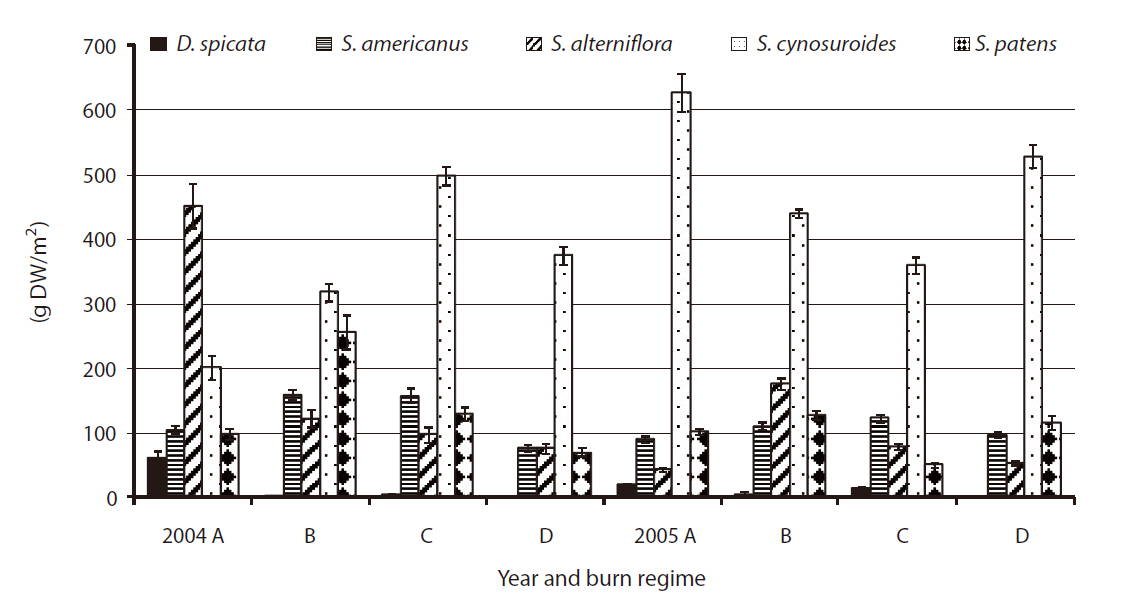
Total above-ground live biomass by species
The above-ground biomass productions of five species were comparable to the findings in previous studies on wetland plant biomass (Boyd 1970, Whigham and Simpson 1978, Whigham et al. 1978, Gross et al. 1991). Our study showed little difference in total biomass production for each of five species by different burn regimes (
(Fig. 3).
In 2004, the species of
No significant difference was found by burn regime on biomass production by species in 2005 when all three sites were burned (i.e.,
The previous study from 1998 to 2001 at the refuge (Flores 2003) found a significant increase in biomass in annual burn sites for D.
The biomass production patterns may be more subject to local environmental conditions such as tides, salinity and herbivory etc. year by year than burning, especially that of long-intervals (i.e., 3-5 year burn and 7-10 year burn). In addition, the changes that occur in plant communities as a result of burning can be slow (Waldrop and Lloyd 1994, Bond and Keeley 2005) and the post burning effects can influence plant species composition, cover and vertical structure other than biomass production (Gabrey et al. 1999, Isacch et al. 2004). Many plant communities contain species that have evolved to tolerate or even require occasional burning. Where burning is frequent, the plant species have evolved species specific adaptations to burning which may include persistence of rhizomes, rhizomes growing deeper in the soil offering better protection from burning, method and timing of seed dispersal, or the ability to grow and reach maturity before the return of the next burning (Abrahamson 1984, Kirkman et al. 1998).
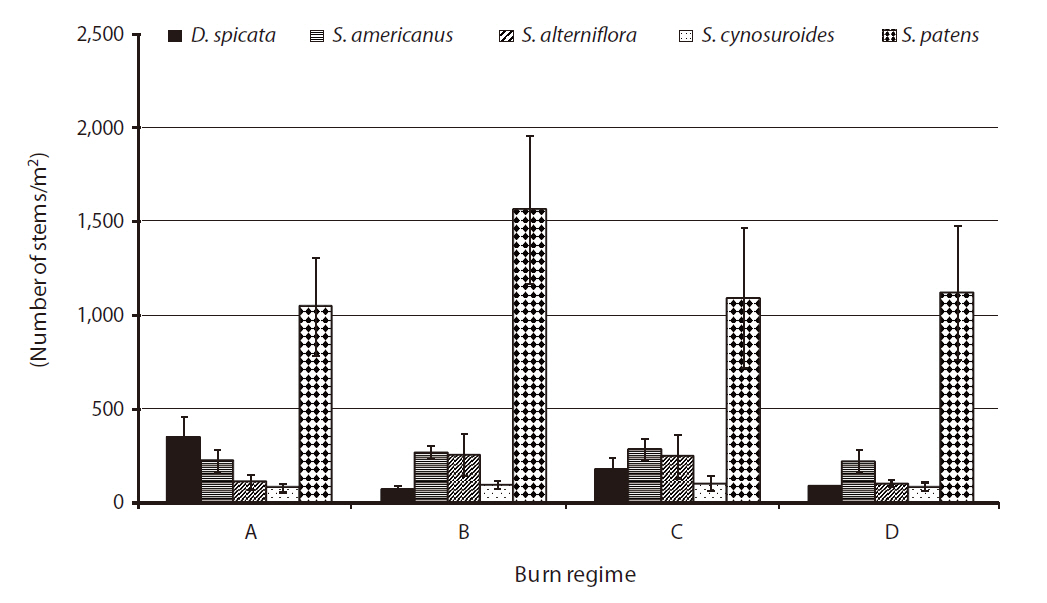
A significant difference was found in stem density for
had significantly higher
>
Total below-ground biomass (live + dead) and total below-ground live biomass (0-30 cm)
Root biomass is an indicator of plant health, therefore increasing root biomass should increase the overall health and stability of the marsh ecosystem (Turner et al. 2004, Saunders et al. 2006). A study on tidal marsh productivity in the Chesapeake Bay region (Langley et al. 2009) found that increase CO2 levels stimulated plant productivity in below-ground biomass, but not in above-ground biomass, indicating below-ground biomass part of vegetation productivity can be a sensitive indicator to environmental changes. In addition, Turner et al. (2004) showed a direct relationship between vertical marsh accretion rate and the accumulation of soil organic matter mostly contributed by the below-ground biomass of marsh vegetation, which is important in mid Atlantic costal marshes currently threatened by land subsidence and sea level rise (Langley et al. 2009).
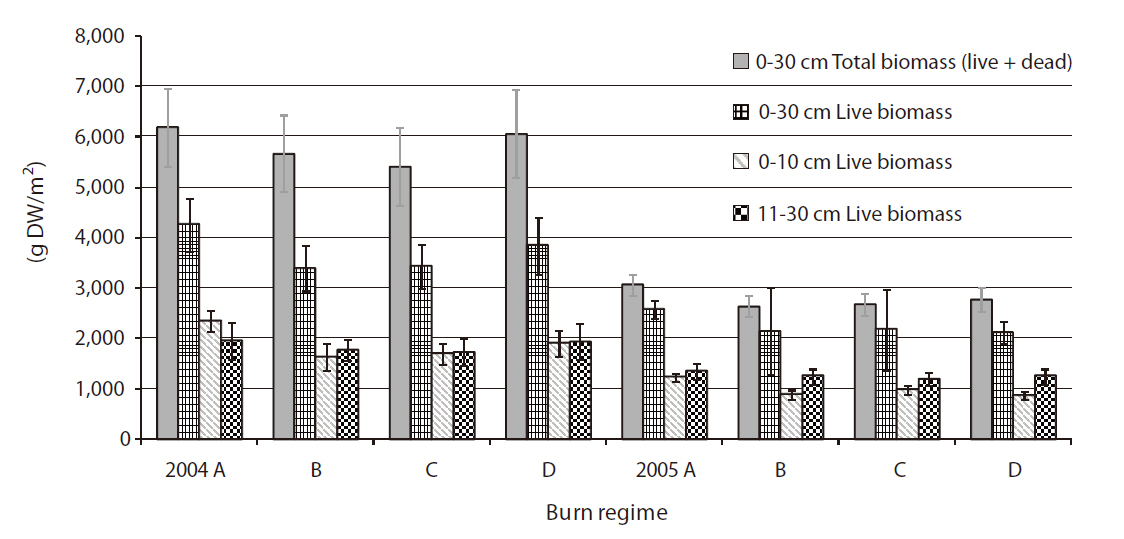
All below-ground live biomass measurements in 2005 in our study were comparable to those measured for the same plant species previously (Good et al. 1982, Roman and Daiber 1984, Gross et al. 1991, Saunders et al. 2006), whereas the below-ground live biomass measured in 2004 were around or slightly higher than the high end of the generally reported values (e.g., 3,200 g/m2 to 4,200 g/m2). However, the below-ground biomass values in 2004 were not unprecedented. Good et al. (1982) reported that the below-ground biomass production ranged from 600 to 6,200 g/m2 for S.
There was significant differences found between the two years in total below-ground biomass both with and without dead parts of the plants (
tion, Sean Flint, Blackwater NWR). We could not monitor soil moisture or water table depth changes in individual study plots in this study. However, it was observed that our study sites had standing water on the marsh surface throughout the period of the study in 2005, whereas the marsh surface was moist with no standing water in 2004 (personal communication and observation, Sean Flint, Blackwater NWR), which might have been attributed to the lower below-ground biomass in 2005. Mean high water level (MHW) was 18 cm higher in 2005 (MHW = 1.09 m) than in 2004 (MHW = 0.91) at the study site (National Oceanic and Atmospheric Administration 2009b). Belowground biomass productivity of tidal marsh plants (i.e.,
Another possible, but meager explanation for the difference in below-ground biomass between the years can be attributed to the difference in above-ground biomass. Although not significant, the above-ground biomass measurements were relatively lower in 2005 than those in 2004, which might have contributed to higher live below-ground biomass produced in 2004 relative in 2005. Based on the above- and below-ground biomass measured previously for
The study showed no difference in the below-ground biomass measurements by burn regimes (
>
Total below-ground live biomass by depth (0-10 cm vs. 11-30 cm)
There was no difference between burn regimes in the amount of live below-ground biomass produced between 0-10 cm (i.e., rhizotomous zone) and 11-30 cm (i.e., root zone) in either year. It seems the below-ground biomass was produced and distributed fairly evenly within the typical rooting depth (i.e., 0-30 cm) of five plant species studied. Live below-ground biomass produced between 0-10 cm depth was more in 2004 than that in 2005 (
>
The ratio of below-ground live biomass to above-ground live biomass
The ratios of below-ground biomass to above-ground biomass ranged from 14:1 (i.e., in 2004 for control site) to 6:1 (i.e., in 2005 for 3-5 year burn) (Table 3). All ratios were significantly higher in 2004 with the greater production of below-ground biomass than in 2005 (P = 0.03). More specifically, the ratio was highest in annual burn regime site in 2004. There seemed, however, no apparent effects of burn on the ratio (Table 3). The ratios found in this study of below-ground to above-ground biomass are relatively higher compared to those (i.e., 2:1 to 8:1)
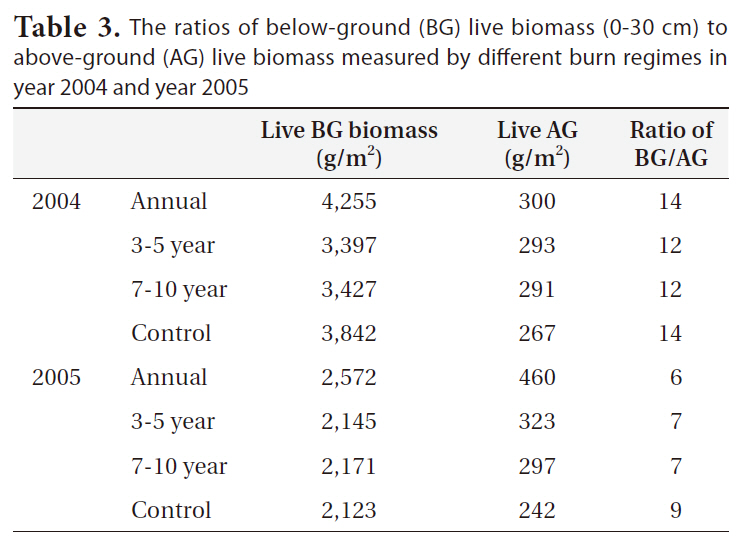
The ratios of below-ground (BG) live biomass (0-30 cm) to above-ground (AG) live biomass measured by different burn regimes in year 2004 and year 2005
reported in other studies that ranged for similar species in brackish or salt marshes (Valiela et al. 1976, Schubauer and Hopkinson 1984). However, low levels of soil nutrients and soil oxygen and/or high levels of soil moisture and salinity can result in the ratios of below-ground to above-ground biomass of common tidal marsh species from 1.43 up to 50 (Gallagher 1974, Hackney and de la Cruz 1986).
Overall, the outcome of the study did show little effect of prescribed burn on enhancing vegetative biomass production in a tidal brackish marsh. The annual burn did seem to increase above-ground vegetative biomass, and influence the plant community by favoring a certain species. The study was conducted during a relatively short two-year period of time, while the burn regimes include much longer-term scenarios (i.e., up to 7-10 years). A longer-term, further study on marsh vegetation productivity is strongly recommended to better assist the prescribed fire program of United States Fish and Wildlife Service. Since our two-year study indicated that below-ground biomass may be a little more responsive between years, it may be a better indicator than above-ground biomass for correlating with environmental variables such as water table depth and flooding regime that can spatially vary in a Chesapeake Bay brackish marsh, and which might influence biomass production. Moreover, the results suggest that further investigation is needed on the influences of salinity and tidal actions on vegetation responses, to tease out the net effects of long-term burning to enhance biomass production for waterfowl and birds. Regardless, the study delivers useful information on the belowground biomass productivity of five common brackish marsh plants, filling the gap in literature for future studies.