Recently, unusual weather caused by climate change and the resulting frequent occurrence of extreme weather has been perceived as an important environmental issue. As a result, extreme weather has become an important issue raised by the mass media and environmental policy discussions. Studies on extreme event indices of meteorological factors, which have been carried out for the last 20 years, have recently become more active worldwide.
In their study on extreme events caused by climate change in various countries, Karl and Easterling [1] found that the number of extreme cold days has diminished whereas that of extreme hot days has increased in the last century. The influence of climate and extreme events is particularly extensive, affecting diverse fields such as agriculture, public work, transportation, and water resources. Furthermore, it is clear that the overall stability of society can become more vulnerable under extreme weather[2]. Because of the occurrence of extreme events such as floods,extreme heat and extreme cold, casualties have increased and the social infrastructure has become more vulnerable. The extent of damage and damaged areas has also increased. Therefore,accurate understanding and analysis of long-term changes in hydrological extreme event data are necessary to prevent future damages to the social infrastructure caused by climate change. The tasks involved in achieving this are important but are also complicated.
Extreme hydrological events such as floods and droughts are currently inflicting damage in many parts of the world. According to Clausius-Clapeyron’s theory, temperature increase leads to increased vapor pressure. In other words, the potential of precipitation to cause flood increases with increases in temperature.Such a phenomenon has been actually observed in many places [3]. The hypothesis that climate change accelerates hydrologic circulation and increases frequencies of extreme events and the occurrence of extreme temperature values has been observed from actual hydrological data. Therefore, climate change has emerged as a major issue.
Kundzewicz and Robson [4] proposed a method for understanding variability in a time series of hydrological data. Burn et al. [5] studied trends and variability of flows under climate change in northern Canada; Callede et al. [6] measured flows of the Amazon River at Obidos, Brazil. In general, flows are known to have undergone slight change over several centuries. Considering this, Xion and Guo [7] calculated the flows of the Yangtze River at Yichang, which is located in the southern part of Hubei, China, over 120 years from 1882 to 2001. The research found no salient trends in maximum annual flows. However, decreasing trends in minimum and annual total flows were found.
As mentioned above, many studies have been carried out on climate change trends. However, most of the studies deal with changes in average values. In particular, few studies have been conducted on extreme precipitation values and temperature trends in Asia.
Therefore, this paper presents a method for assessing changes in extreme weather involving observed amount of precipitation,average temperature, and minimum and maximum temperatures.To carry out the research, data from 66 observatories nationwide operated by the Korea Meteorological Administration(KMA) were used to estimate indices that can represent precipitation and extreme temperature values. The indices were then used to analyze trends in data.
2.1 Establishment of Extreme Indices
In 2001, the IPCC published the Third Assessment Report(TAR). Based on observed data during the last 100 years, global climate changes such as increases in temperature and carbon dioxide concentration, melting of glaciers, and lowering of the stratosphere temperature were analyzed. The report predicted that worldwide temperatures would increase by 1.4-5.8°C by 2010 under climate change, and this has indeed eventuated.Houghton et al. [3] have argued that the impact of climate change needs to be assessed and that measures must be designed to cope with the change. Korea is not exceptional in the phenomenon of climate change. Since the 1990s, precipitation that exceeds expectations and extreme seasonal temperature changes have frequently occurred. Because such phenomena in general do not occur under regular cycles and patterns, annual precipitation and temperature data, which are currently used in hydrological studies, cannot be used to extract characteristics and factors of climate change. In this study, data from extreme events were drawn from precipitation and temperature factors of the past. Statistical methods were then used to analyze the trends.
Meanwhile, the European Union carried out the Statistical and Regional dynamical Downscaling of Extremes (STARDEX)project for four years from February 2001 to May 2004 [8]. The goal of the project was to estimate the impact of global warming on climate events with extreme values for the end of the 21st century.To estimate the frequency and intensity of extreme events,Table 1 was formulated. The table is composed of ten extreme weather indices related to precipitation and temperature. In this research, the indices have been applied to the Korean weather data. The extreme indices related to precipitation consist of six items including the heavy rainfall threshold and the greatest 5-day rainfall. Extreme indices related to temperature consist of four items including the hot-day and cold-night thresholds.
Each index has its own definition and is expressed by percentage(%) to represent the climatic condition throughout Korea.The items take account of the extent of climate events (for instance, hot-day threshold), frequency (heavy rainfall proportion),and continuity (longest rainfall days).
In terms of climatology, definitions of the indices shown in Table 1 are for intermediate-level events rather than extreme events. The indices, however, can be applied to extreme events.For instance, when flood occurs in a large river basin, indices such as the greatest 5-day rainfall duration can be used as an important criterion to assess whether the flood was an extreme event.
In particular, when an extreme event of precipitation and temperature occurs, sensitivity and vulnerability depend upon the characteristics of basins such as their area and topographical features and the extent of social infrastructure. The same amount of precipitation can cause differing influences depending upon whether the areas affected are urban or precipitous mountains. Therefore, the use of indices that are relatively resistant to change can help maintain objectivity and consistency.
3.1. Study Area and Data Collection
As shown in Table 2 and Fig. 1, which represent 66 stations in South Korea (including their names), daily precipitation, daily
[Table 1.] Indices of extreme events (STARDEX 2005) [8]
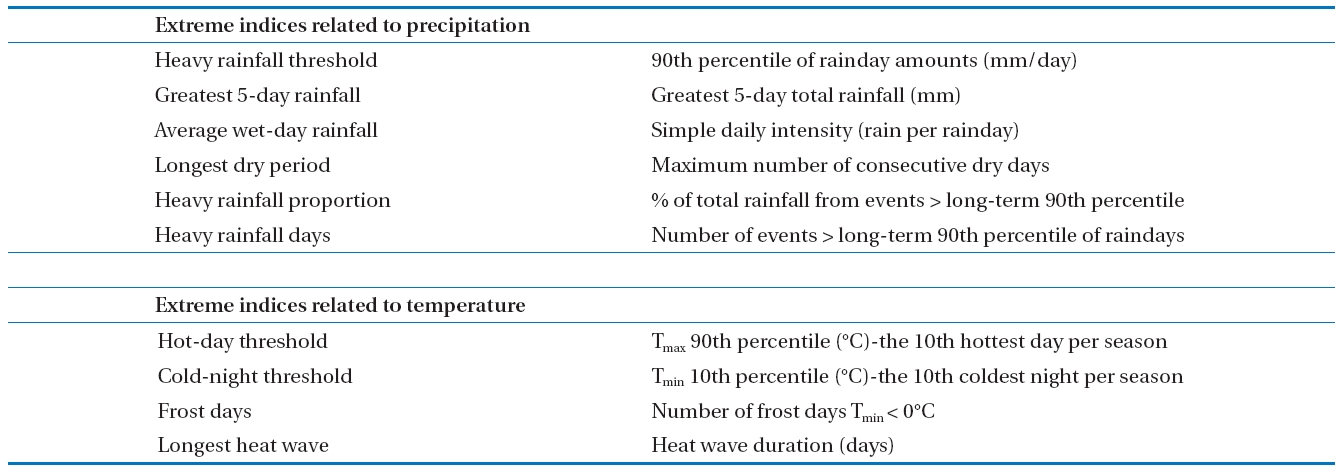
Indices of extreme events (STARDEX 2005) [8]
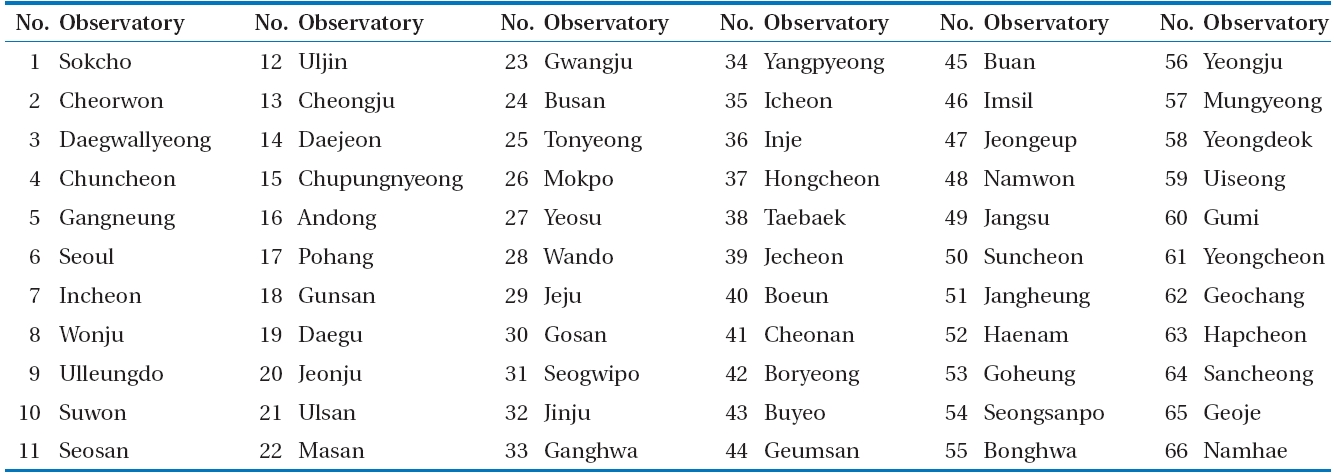
Names of stations
maximum and minimum values, and average temperature data were used in this paper to analyze extreme events that have occurred in Korea. The data were collected by 66 observatories throughout Korea including Jejudo and Uleungdo operated by KMA. Depending on the observatory, the data were dated from 19 to 46 years. In Gangneung, Seoul, and Incheon, observation began in 1961, whereas in some locations observation began in 1988. Except for four observatories in Cheorwon, Gosan, Jangsu,and Bonghwa, data longer than 20 years were used.
3.2. Analysis of Spatio-Temporal Changes in Extreme Events
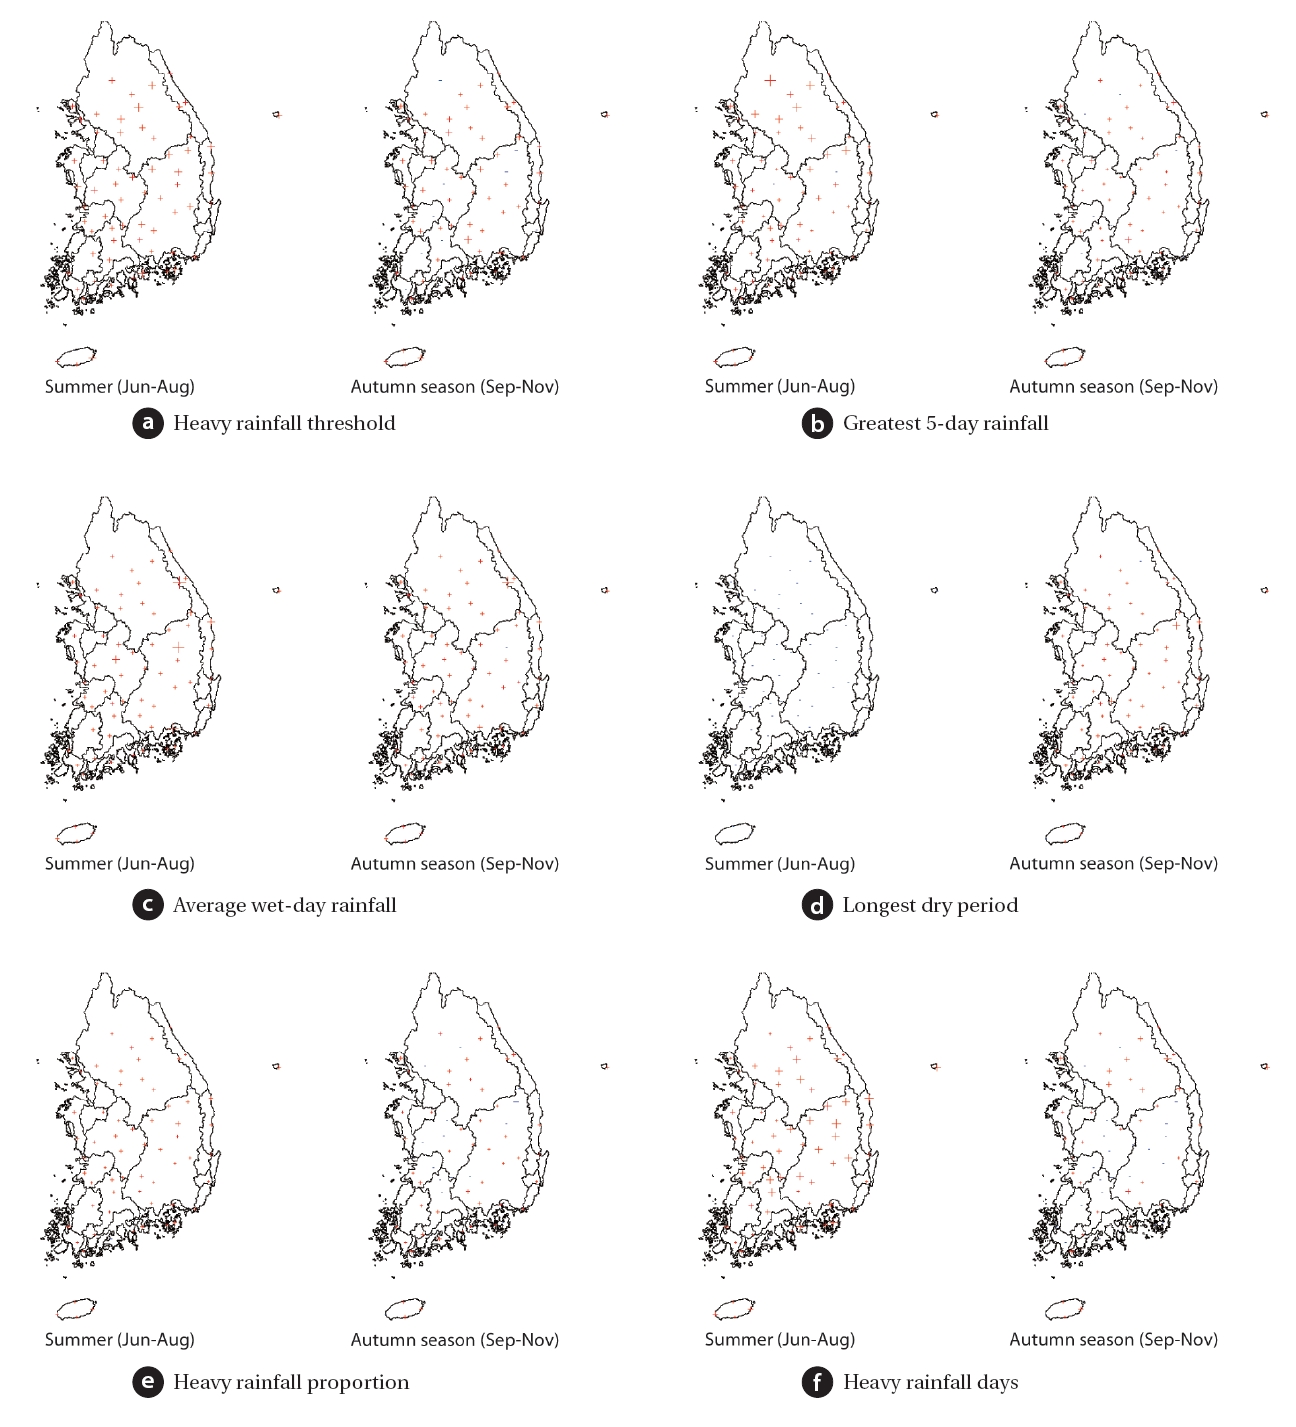
Regardless of the year of observation, data collected from the 66 observatories arranged by indices in Table 1 were analyzed.Each index showed clear trends that differed depending on season and region. Figs. 2 and 3 show local trends in extreme indices regarding precipitation and temperature. Increases and decreases were respectively expressed by ‘+’ and ‘-’ signs. ‘+’ indicates that indices have a trend to increase from the past to the present. A larger value indicates that the trend is relatively more pronounced. ‘-’ indicates the opposite.
Firstly, in the case of precipitation-related extreme indices,seasonal characteristics were considered and data for summer(June-August) and autumn (September-November) were compared.Cho et al. [9] demonstrated that Korea’s precipitation, using a normal value as the standard, tended to peak in the order of July, August, June, and September and that the impact of precipitation was lowest in winter (December-February). Furthermore,considering that Korea’s precipitation has traditionally tended to concentrate in summer and that the end of August to September is the rainy season, comparing summer and autumn precipitation rather than winter and summer was deemed more appropriate.
Fig. 2 shows precipitation-related extreme indices. As stated above, the summer and autumn indices were compared: (a)heavy rainfall threshold, (b) greatest 5-day rainfall, (c) average wet-day rainfall, (e) heavy rainfall proportion, (f) heavy rainfall days trend tended to increase in summer rather than autumn,and (d) longest dry period tended to increase in autumn. In Korea,precipitation is generally concentrated in summer under the influence of the seasonal rain front (monsoon). During the last few years (from 1998 to 2004, excluding 2001), however, a larger amount of rain fell after the end of the monsoon [10]. Considering that this is the beginning of the seasonal rain front, it can be interpreted that precipitation occurs throughout July and August. In the case of the Heavy rainfall threshold shown in Fig.2(a), it was found that the trend increased in autumn (September-November) rather than summer (June-August) in the case of some locations including Masan, Wando, Jejudo, Seogwipo,and Taebaek. These observation points were located in coastal areas rather than inland areas. This trend may be affected by
the size and path of typhoons that pass through Jejudo and the south coast. In contrast, there were 53 locations (80%) including Cheorwon, Incheon, Seoul, Hongcheon, and Andong where the Heavy rainfall threshold increased in summer. The trend was strong in the inland area of the central region. In particular, the trend decreased in autumn or was expressed by ‘-.’
Fig. 2(b) shows the greatest 5-day rainfall. The index shows a clear sign of increase for Cheorwon and Hongcheon where the Heavy rainfall threshold was high as well as Bonghwa, Yeongju, and Mungyeong. Similarly, in the case of the heavy rainfall proportion shown in (e), the rate of occurrence of heavy rain largely increased in summer rather than autumn. The same result was found in heavy rainfall days shown in (f). From a seasonal perspective,precipitation continues to be concentrated in summer.However, extreme precipitation tends to occur earlier and the amount of precipitation is increasing in the long-term. In addition,the frequency of extreme precipitation events is increasing.Such interpretation supports the findings of Gwon et al. [11]
who found that precipitation had increased during the last 20 years. They also found that a decrease in rainy days was accompanied by an increase in precipitation intensity in summer and that heavy rains of more than 50 mm per day had increased.
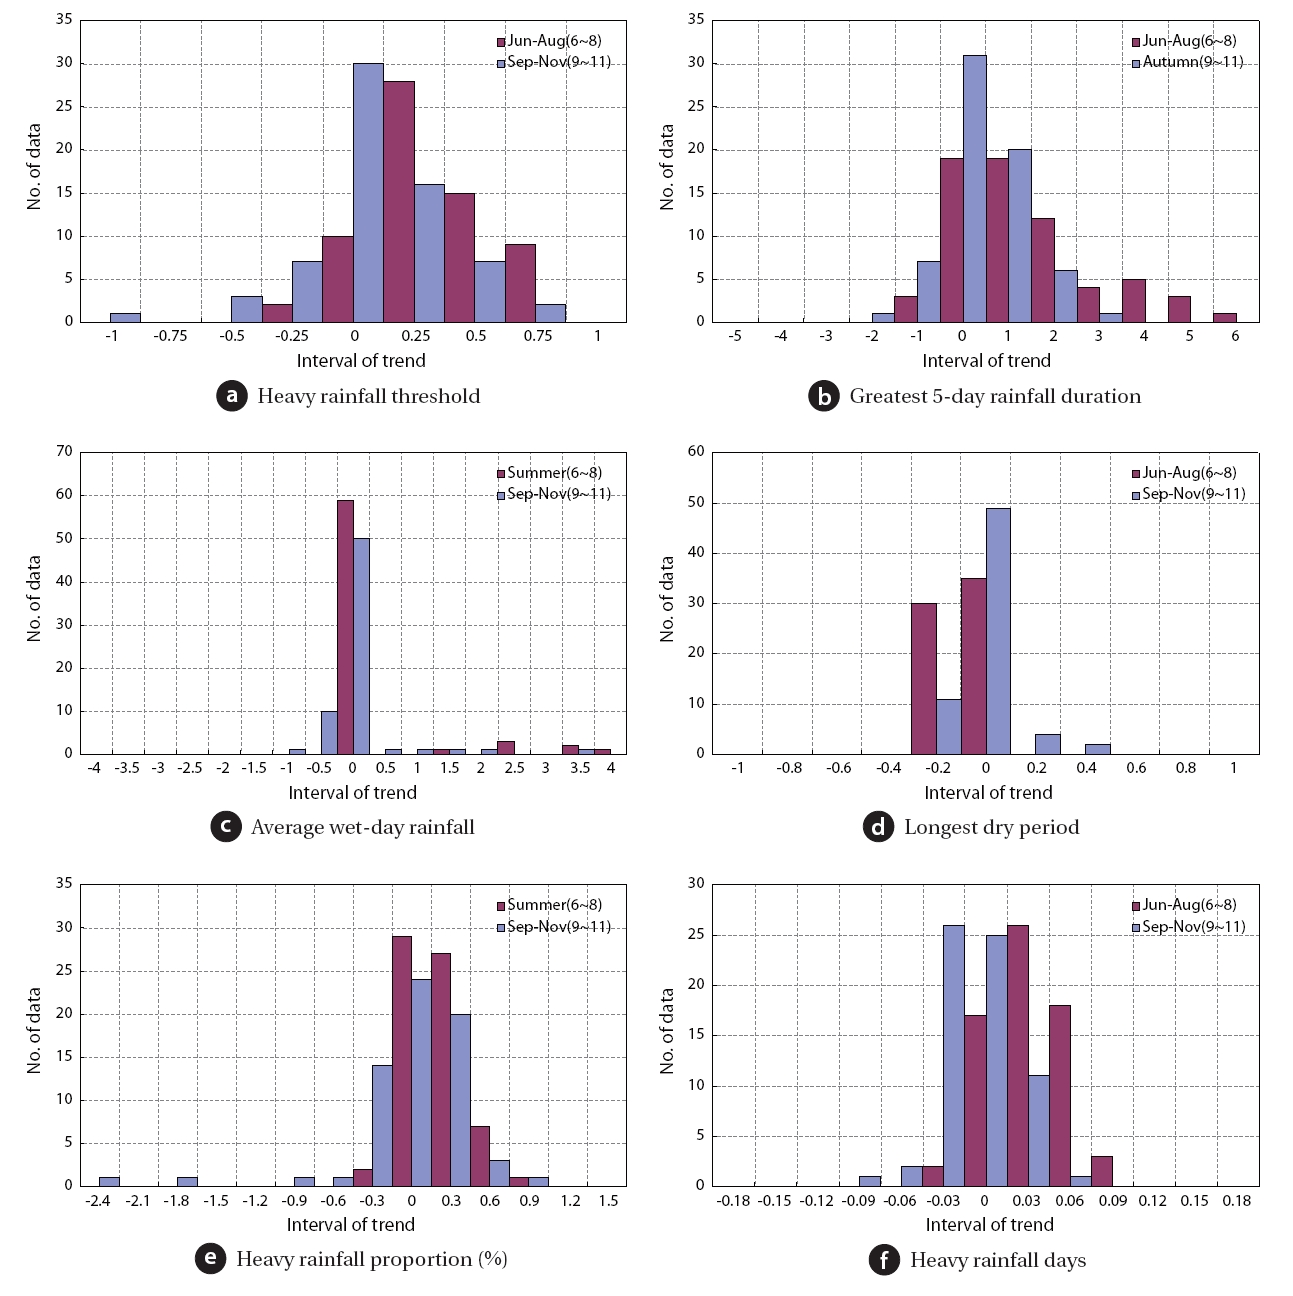
Fig. 4 is a distribution chart based on the precipitation-related extreme indices shown in Fig. 2. The longest dry period shown in Fig. 4(d) is the opposite concept to that of the wet period and clearly tends to decrease in summer rather than autumn. It is generally known that summer is the season that is most affected by precipitation. This research that focuses on precipitation-related extreme events provides a different interpretation. Unlike in the past when precipitation was continuous and regular under the impact of the monsoon, precipitation has become more localized, short-term, irregular, and concentrated. Such interpretation supports the finding by Im et al. [12] who found that heavy rain throughout the year in Korea are characterized by spatial and temporal irregularity and localization. This research also supports the finding by Kim et al. [13] who found that global climate change increases intensity of precipitation in Korea.They also found that periods of dryness and wetness are becoming shorter and that the occurrence of heavy rains is more likely.
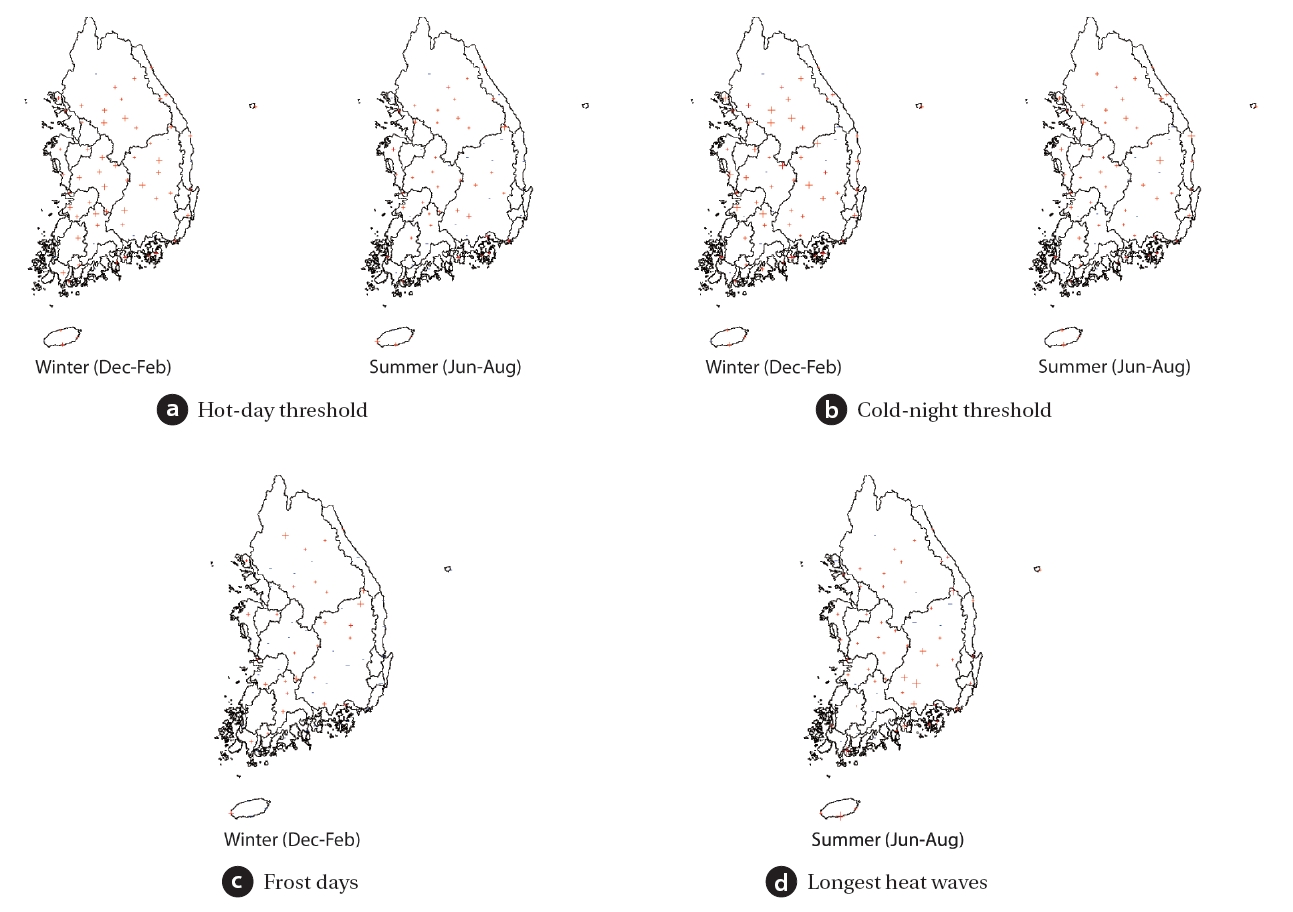
Fig. 3 shows extreme temperature indices. Yun [14] found that the number of extreme cold days in winter is decreasing and that summer is becoming longer while winter is becoming shorter. In the area of temperature distribution, he found that the increase in winter temperature is more salient than that of other seasons. Based on his findings, in this paper extreme event indices related to temperatures in summer and winter are compared and analyzed.
The Hot-day threshold in Fig. 3(a) was used to analyze the trends in temperature increases in Korea. Results showed that temperature tended to increase in winter (December-February)rather than summer (June-August). Such trend was widespread in Korea’s inland areas including Hapcheon, Geochang, and Andong as well as Geumsan and Icheon. In particular, the trend was pronounced in the Nakdong River area. The Meteorological Administration analyzed average annual temperatures in the Korean Peninsula during the last 24 years and found that such trend was pronounced in the winters in most areas of Gyeonggi,Chungcheong, and Yeongseo provinces, centered on Seoul and Busan, Daegu, and Gwangju [15].
However, in the case of elevated areas in Jejudo and Wando located on the south coast, the temperature increase was more pronounced in summer rather than winter. In these locations,the temperature increased slightly from summer to autumn. As discussed in the section on precipitation, precipitation tended to increase in autumn rather than summer. As mentioned in the introduction, this finding supports Clausius-Clapeyron’s theory:an increase in temperature affects vapor pressure and the potential for precipitation increases.
As shown in Fig. 3(b), trends of the cold-night threshold are similar to those involving hot-day thresholds. Currently, remarkable changes in the index are occurring in Jeongeup, Suncheon,and Haenam and except for Korea’s southeast, the increasing
trend can be found in winter rather than summer. However,Fig. 3(c) shows that the number of frost days in winter is rapidly decreasing. This finding supports that of Gwon et al. [11] who found that frequency of low temperature days is drastically decreasing.In fact, the duration of winter decreased whereas that of spring and summer increased in the late 20th century. The change could be felt by decreases in life-related temperature indices such as winter frost days and heating days. The change was less evident in summer because the temperature did not fall below 0°C.
Meanwhile, Fig. 3(d) shows the period of extreme heat; the index is salient in summer in Geochang and Hapcheon. Because the period of extreme heat caused by a tropical night phenomenon does not appear in winter, the period of extreme heat indices for summer was used. A comparison of Fig. 3(c) frost days and Fig. 3(d) longest heat wave indices showed that the extreme heat period tended to increase in areas where the number of frost days in winter tended to decrease. In particular, the number of frost days decreased whereas the index of the period of extreme heat increased considerably in the Nakdong River area centered on Jinju, Gumi, Geochang, and Hapcheon.
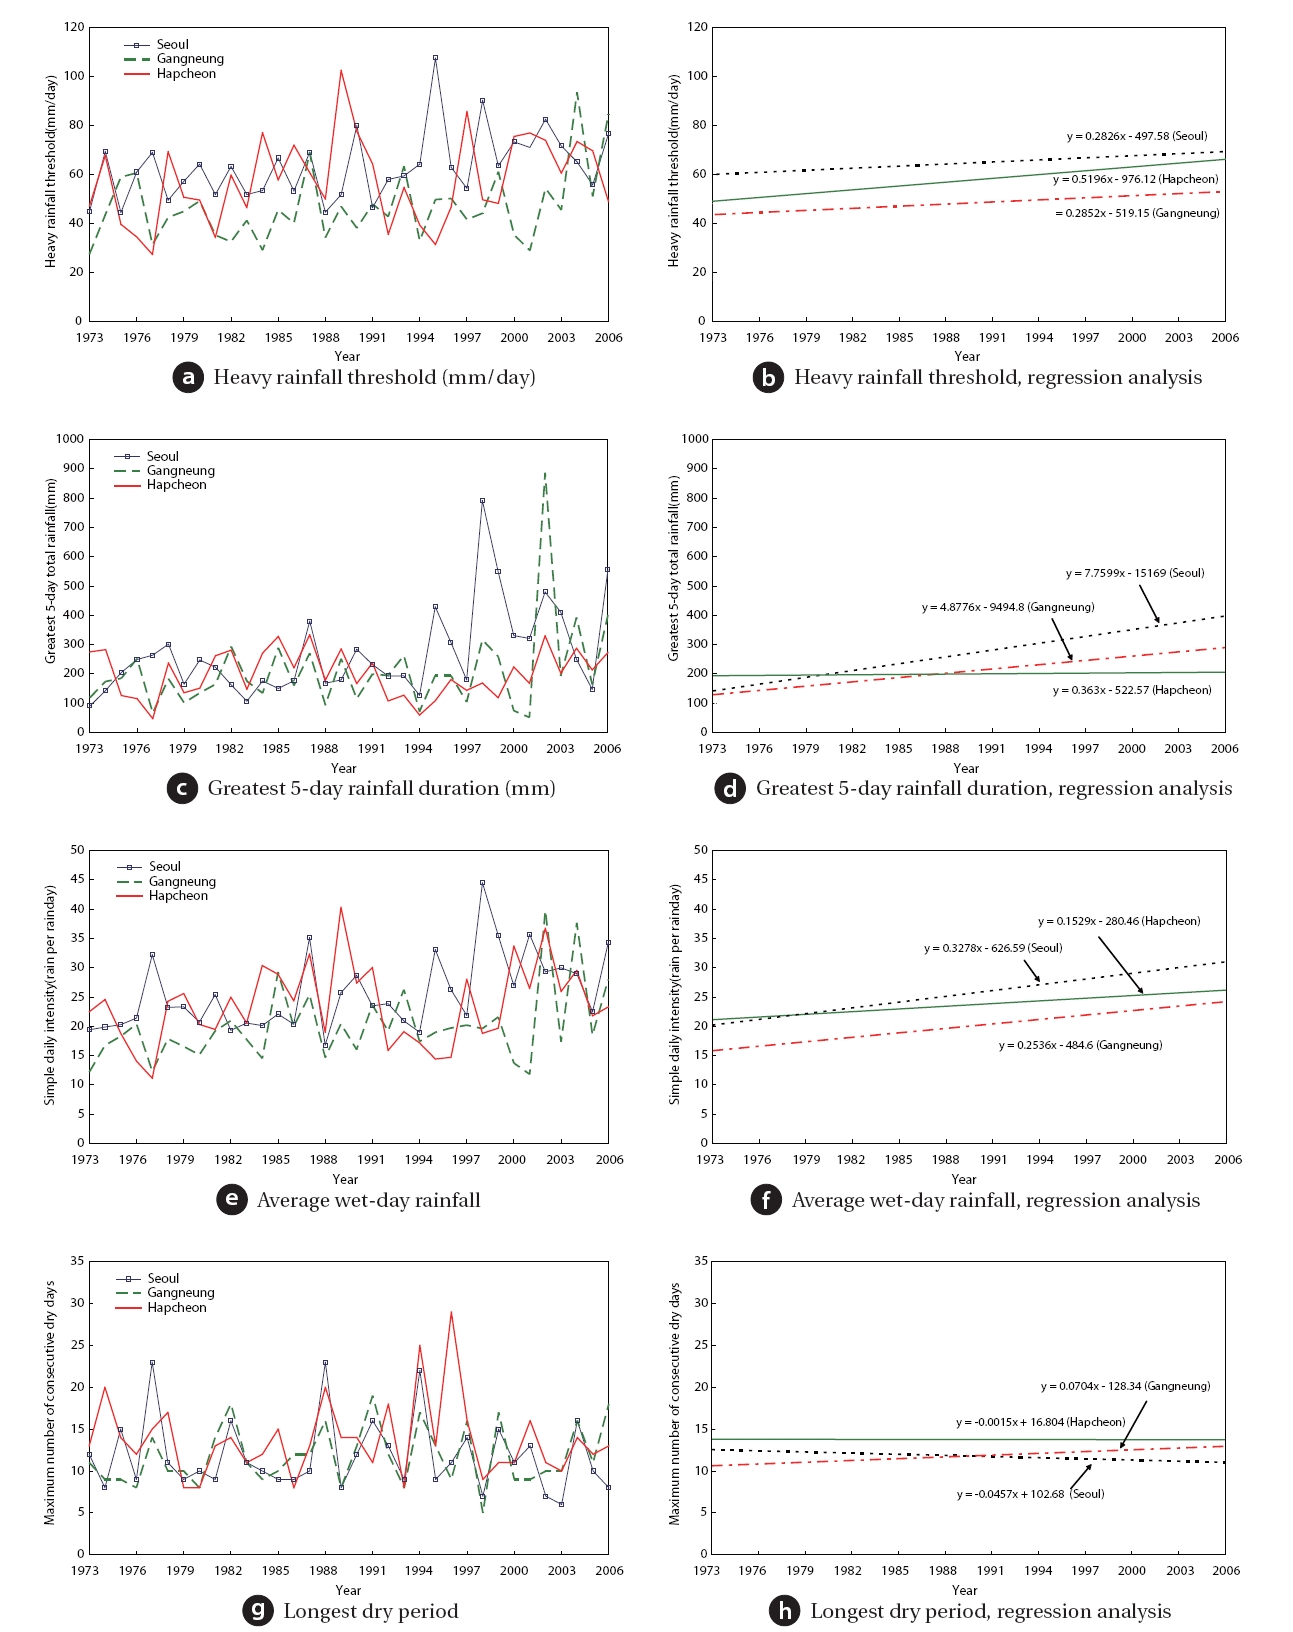
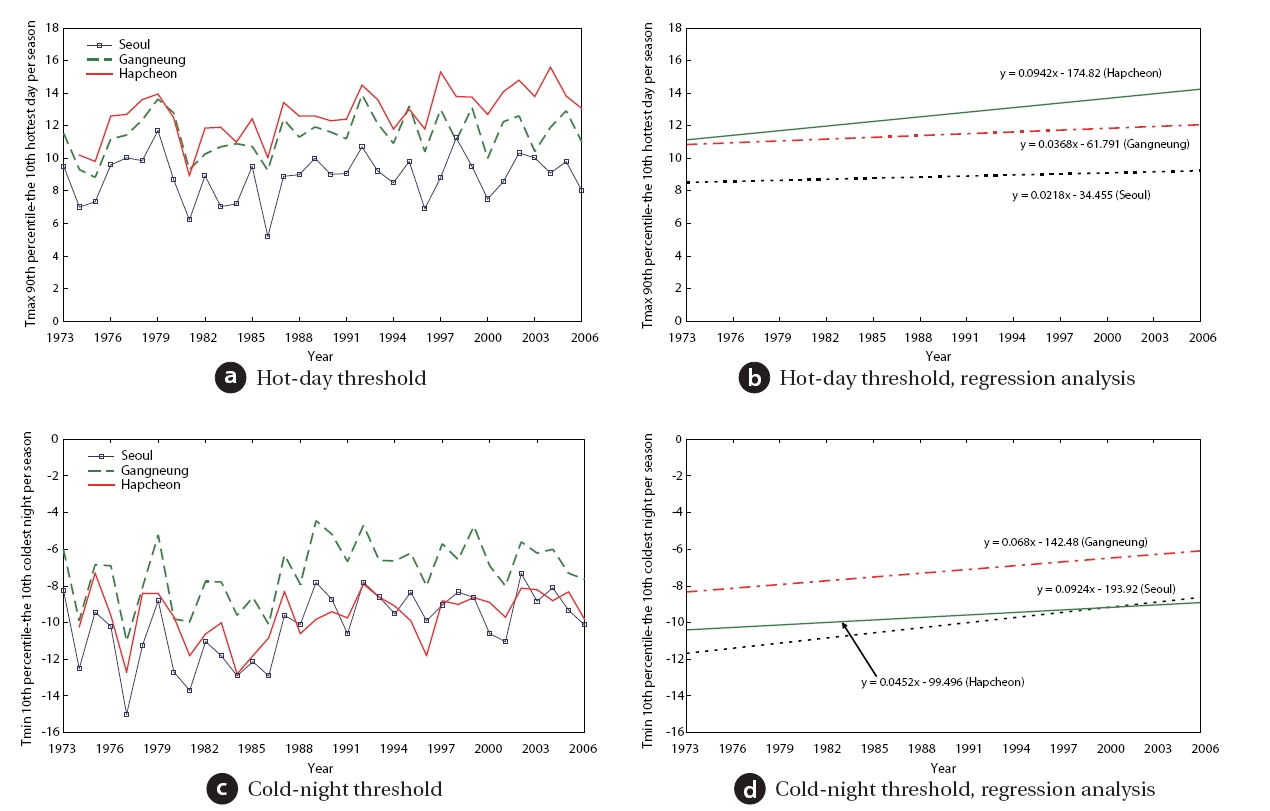
Based on the results of analyses, Gangneung, Seoul, and Hapcheon were chosen because they can represent 66 observatories in terms of their location and because observations have been carried out for up to 35 years. Trends in summer extreme event indices, which are most seriously affected by precipita
Fig. 5(a) shows the threshold of heavy rain in the three locations.Trends in Gangneung and Seoul were similar (0.28)whereas the trend in Hapcheon was 0.52. The trend was more pronounced in the south (Gwangju, Suncheon, etc.) rather than in the inland area of the central region. Greatest 5-day rainfall duration is shown in Fig. 5(b). This trend was salient in Seoul.It could be verified that the size of precipitation has been rapidly increasing since 1995. A similar phenomenon appeared in Gangneung. The trend was less clear in Hapcheon.
The average wet-day rainfall is shown in Fig. 5(c). Of the three locations, the trend was most salient in Seoul. In particular, as in the case of the greatest 5-day rainfall duration, the intensity of precipitation became salient after 1995. In the case of Hapcheon,more variability was apparent in comparison with the greatest 5-day rainfall duration. Hapcheon, however, was the location least affected by the change. The longest dry period is shown in Fig. 5(d). Seoul and Hapcheon recorded the highest values in 1994 and 1995, when drought had occurred, and of the three locations, Seoul and Hapcheon were marked by decrease whereas slight increase was recorded in Gangneung.
The temperature-related extreme event indices for the winter,for which the temperature change was the largest in Gangneung,Seoul, and Hapcheon, are shown in Fig. 6. Fig. 6(a) shows the hot-day threshold. The trend increased in all three locations as predicted by previous studies. In particular, the value was highest in Hapcheon. Fig. 6(b) shows that these cold-night thresholds are increasing in all three locations. In particular, the value is increasing fastest in Seoul.
In terms of climate change, which has recently emerged as an issue, spatial and temporal changes in the characteristics of extreme precipitation and temperature events were analyzed in this paper. Since the 1990s, unusual weather phenomena have continuously appeared in Korea. The phenomena, however, are marked by irregularity in time and pattern. Existing studies on weather trends have analyzed the average variability of monthly or annual time series data. In contrast, this paper attempted to find the trend and variability by season and region in extreme events of precipitation and temperature. The following is a summary of this paper:
1. This paper proposed six indices of extreme precipitation:heavy rainfall threshold, greatest 5-day rainfall duration, average wet-day rainfall, longest dry period, heavy rainfall proportion(%), and occurrence days. Four extreme temperature indices were proposed: hot-day threshold, cold-night threshold,frost days, and longest heat wave.
2. Data collected from 66 observatories nationwide were used to analyze the following: heavy rainfall threshold, greatest 5-day rainfall duration, average wet-day rainfall, heavy rainfall proportion(%), and occurrence days. It was found that abnormal trends were more numerous in summer than autumn. In the case of the longest dry period, the trend was more salient in the autumn season. Considering the results, it can be concluded that the occurrence of heavy rains in Korea is increasing whereas the longest dry period is decreasing. Precipitation continued to be concentrated in summer. However,heavy rain was found to occur earlier and more frequently.
3. Spatial comparison of extreme precipitation indices in summer and autumn season revealed the following: in the case of summer, the heavy rainfall threshold and greatest 5-day rainfall duration increased remarkably in the inland area of the central region; in the case of autumn, an increase in the trend was recorded in Jejudo and the south coast. This trend may be affected by the timing, size and path of typhoons.
4. Using a hot-day threshold, the temperature increase in Korea’s four seasons was analyzed. It was found that the temperature increased to a greater extent in winter than in summer.A comparison of the number of frost days and periods of extreme heat indices showed that the extreme heat period tended to increase in regions where the number of frost days in winter tended to decrease. This phenomenon was clearly visible in the Nakdong River areas centered on Jinju, Gumi,and Geochang.
5. Spatial analysis of extreme temperature indices showed the following. In Jejudo and near the south coast, the temperature increase was more pronounced in summer than in winter.However, in the inland area, the temperature tended to increase in winter rather than in summer. In particular, the trend was more salient in the Nakdong River area. This means that the amount of temperature increase in winter is larger than that in other seasons. This finding may explain the reason why people feel that spring and autumn are now longer than in the past.
The findings can be summarized as follows: Under the global climate change, Korea, unlike in the past, is affected by extreme weather events such as heavy rains and abnormal temperatures in addition to changes in climate phenomena.
These findings support those of Im et al. [12] who found that heavy rains throughout the year in Korea are characterized by spatial and temporal irregularity and localization. These findings also support those of Kim et al. [13, 16] who found that global climate change increases the intensity of precipitation in Korea and that periods of dryness and wetness are becoming shorter and that the occurrence of heavy rains is more likely.
In conclusion, the finding suggests that more research needs to be carried out on the impact of climate change on unusual weather in Korea.

![Indices of extreme events (STARDEX 2005) [8]](http://oak.go.kr/repository/journal/10611/E1HGBK_2011_v16n3_175_t001.jpg)