Due to the increase in energy cost by constantly high oil prices and the obligation to reduce greenhouse gases, the world is paying attention to renewable energy that can replace fossil fuels. Waste resources are recognized as a renewable energy source and are the most important alternative energy source from environmental and economic perspectives. In particular,biogas with the use of organic wastes not only has a greater possibility to be used as energy than other wastes but is also capable of controlling CH4 and CO2 discharge, which have a significant greenhouse effect [1, 2]. Landfill gas (LFG) represents this biogas together with anaerobic digestion gas. Because LFG contains 40?60% CH4 and 40?55% CO2[3, 4], energy source-applied businesses have started in Europe and have been conducted dynamically since 1970 [5].
A method for producing heat and electricity through combined heat and power has been used most frequently with LFG as a resource [6, 7]. LFG is saturated with moisture, compared to other natural gases and contains various trace compounds,including hydrogen sulfide, siloxane, ammonia, and carbon monoxide [3, 8-10]. LFG performance is degraded and lifespan is reduced by impurities if it is used directly as a fuel in a utility facility that utilizes a boiler and generator. In particular, damage caused by siloxane and hydrogen sulfide scale is serious[11-13]. Various pretreatment processes to remove siloxane and hydrogen sulfide have been developed and commercialized to produce heat and electricity in Europe and the USA. However, as few studies have been conducted in Korea on the characteristics of generating siloxane and hydrogen sulfide in LFG and on the effect of their scale on LFG utility facilities, development of pretreatment processes is still insufficient.
In this study, the characteristics of siloxane and hydrogen sulfide concentrations in LFG were identified by focusing on landfills where LFG utility facilities are operated at present. Hydrogen sulfide and siloxane scale on LFG utility facilities was analyzed to apply basic data for developing a future pretreatment process.
2.1. Landfills and LFG Utility Facilities
The target landfill is S landfill, which was divided into zone A,in which the landfill had been completed, and zone B, in which
amthe land is being filled at present for a survey. It was determined that zone A began to be filled with municipal and industrial solid waste in 1992 and was finished in 2000. Zone B began to be landfilled in October 2000, is presently under landfill construction,and is being filled with municipal solid waste, office waste and building waste.
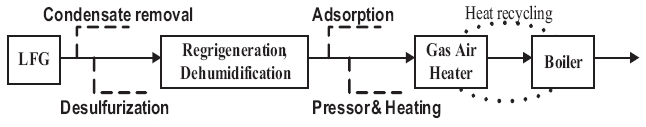
Scale occurring from biogas in utility facilities causes corrosion,abrasion, and clogging of equipment, resulting in excessive maintenance costs and reduced competitiveness [14, 15].Fig. 1 shows the LFG utility facility process for S landfill to analyze the scale caused by biogas in utility facilities. Heat generated by LFG combustion passes through the heating surface and superheater of the boiler to produce superheated steam, which converts thermal energy into kinetic energy in a turbine system to operate a generator. At present, electricity is produced using a 50 MW generator, which consumes LFG at about 500 m3 per minute. Various processes are applied such as removing condensing water, desulfurization, refrigeration, dehumidification,absorption, and heating and pressurization to remove moisture and hydrogen sulfide as an LFG pretreatment.
2.2. Collection of LFG and Scale Sampling
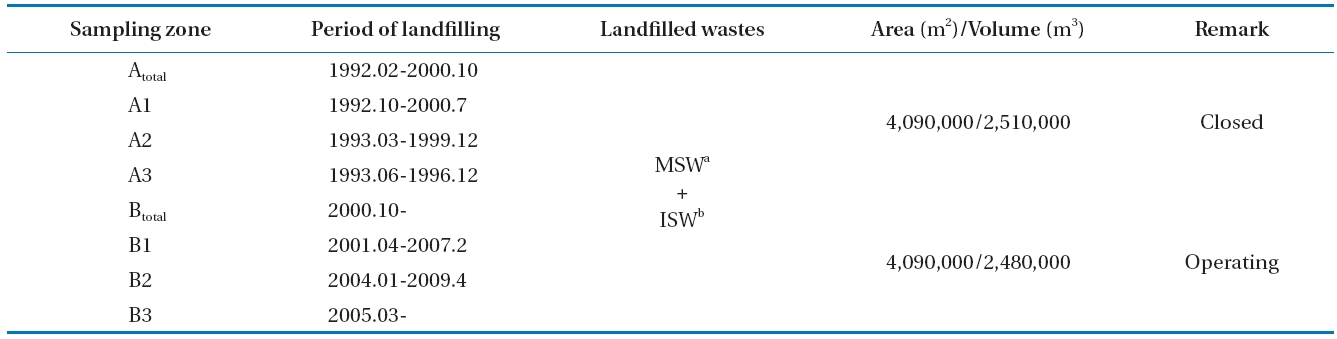
The sampling area was divided into zones A and B. Samples were collected at three gas sampling zones, whose landfill ages were different, and at a duct line where all LFG was collected to flow into the utility facilities. Four zones (total of eight zones)were designated for sampling. The characteristics of each zone are organized in Table 1.
Scale was found generally at the boiler and the gas air heater(GAH), so scale samples were collected. In the case of the boiler,scale was collected from the bottom and walls. Each sample was kept dry until analysis.
A portable instrument (LMSxi; Gas Data Ltd., Coventry, UK)
[Table 1.] Landfill site descriptions

Landfill site descriptions
was used to analyze the LFG components, and a value was acquired after LFG was passed sufficiently while measuring. Measurable components and the detection limit of each component were CH4 (%), CO2 (%), oxygen (%), nitrogen (%), hydrogen sulfide(detection limit, 199 ppmv), and ammonia (detection limit,5,999 ppmv).
Siloxane was collected using the impinger absorption method,which has higher precision and a 10 times lower detection limit than that of the canister method [16]. LFG was passed through the LFG flow-control pump and was then absorbed in four-layered impingers containing 6 mL of methanol absorption liquid [15, 17]. A low temperature (4 ± 2°C) was maintained to increase the gas absorption rate, and flow was maintained at 100 mL/min. A wet gas meter was installed at the rear of the impinger and we re-checked whether the total amount of absorbed gas and discharge were maintained uniformly [15, 17]. Siloxane was analyzed using gas chromatography/mass spectroscopy(Shimadzu QP-5050; Shimadzu, Kyoto, Japan) [6, 18]. The sum of the concentrations of the seven materials ranging from L2-L5 to D4-D6 was used as the total siloxane value.
Scanning electron microscopy-energy-dispersive X-ray spectroscopy(JSM-6380; JEOL, Tokyo, Japan) analysis, elemental analysis (Finnigan Flash 1112 series; Thermo Finnigan, San Jose,CA, USA), and chemical composition analysis were implemented to investigate the scale composition and components.
Table 2 shows the analysis of the LFG component results for the target landfill. The CH4 concentration in LFG occurring at the landfill averaged 45.7% (range, 16.0?57.0%) If zone A3 was excluded, it was 40?60% [3, 4], which is a normal CH4 concentration to satisfy LFG recycling. The reason that the CH4 concentration in zone A3 was low was due to air inflow. The CH4 concentration of landfill A under the follow-up control averaged 42.9%,showing a lower CH4 concentration than that of landfill B, which is being filled at present.
As a result of analyzing other gases, the zone A2 ammonia was 375 ppmv, which was the lowest level, whereas that of zone A3 was 3,514 ppmv, the highest. Hydrogen sulfide was 22 ppmv at zone A2, the same zone as ammonia, whereas 1,211 ppmv was the highest level at zone B3. The pretreatment process for ammonia
and hydrogen sulfide was determined as needed. Similar to CH4, CO2, ammonia, and hydrogen sulfide concentrations in zone A was under follow-up control and showed lower levels than those of zone B.
[Table 2.] Major landfill gas (LFG) components
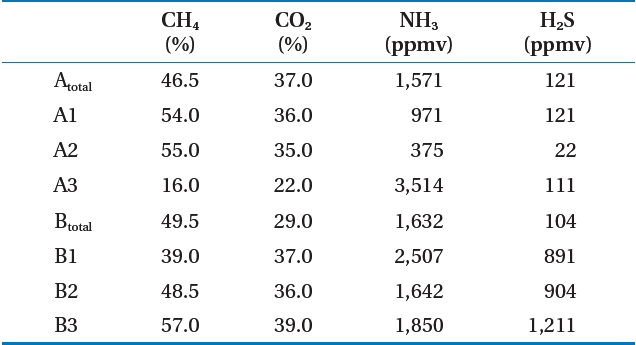
Major landfill gas (LFG) components
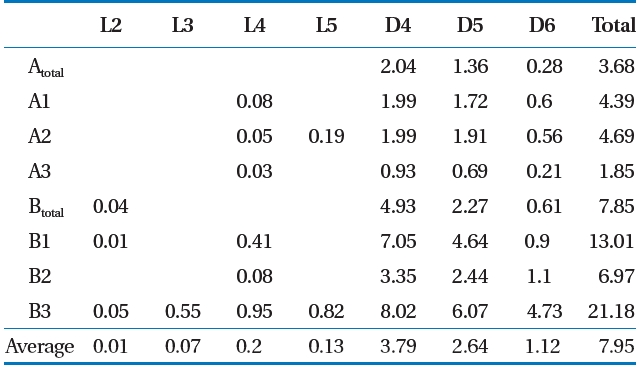
[Table 3.] Siloxanea) concentration in landfill gas (LFG)

Siloxanea) concentration in landfill gas (LFG)
mg/m3) [12]. Deviations can occur in the total LFG siloxane concentration by various factors such as temperature of the environment and in the landfill [19], but the ratio of siloxane by component shows that D4 and D5 has the highest level [15, 20,21]. Result of this study also showed that siloxane concentration by component was highest at D4 (average, 3.79 mg/m3) and D5(average, 2.64 mg/m3).
3.2. Characteristics of the Scale in LFG Utility Facilities
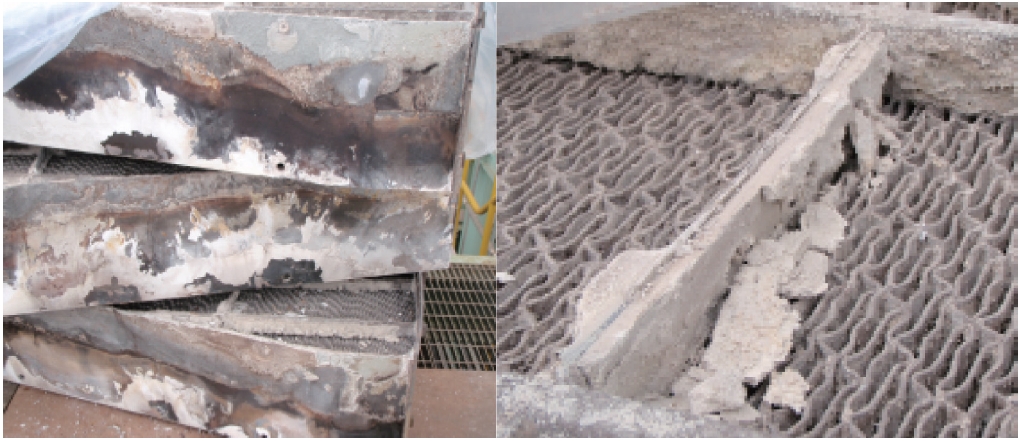
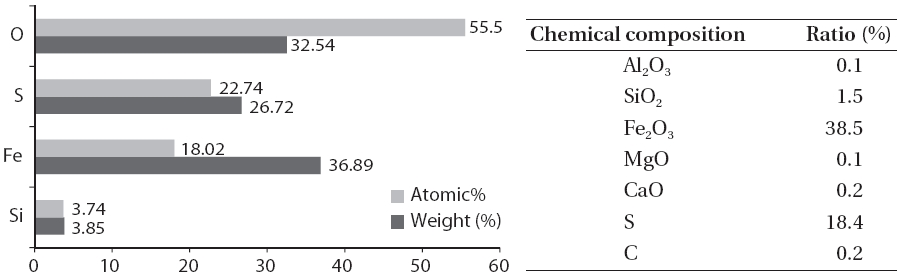
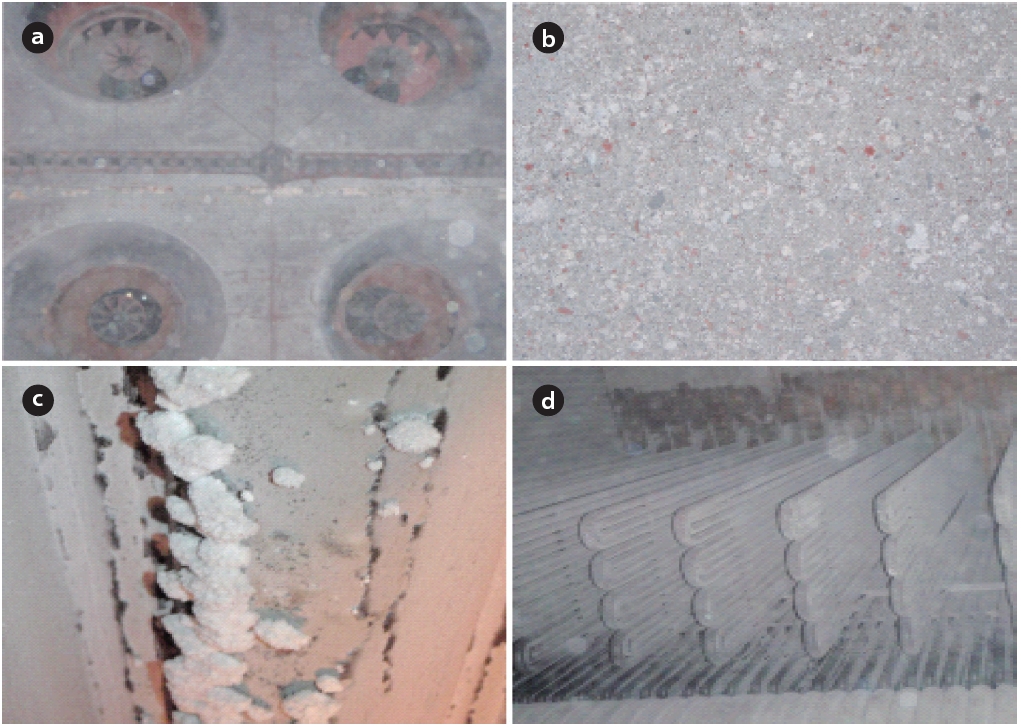
Fig. 2 shows the scale and disaggregate GAH for scale removal.As shown in Fig. 3, a large amount of the scale in the GAH appeared light grey or light yellow. As a result of the GAH scale analysis (Fig. 4), the major components were oxygen, sulfur, and iron; Fe2O3 was 38.5%, and sulfur was 18.4%. Hydrogen sulfide which was not removed but remained during the pretreatment process and moisture caused by the GAH heat riser combined to generate acidity. This acid reacted with iron in the GAH to cause Fe2O3 scale. It was discovered that the GAH scale was caused by sulfur gas (hydrogen sulfide).
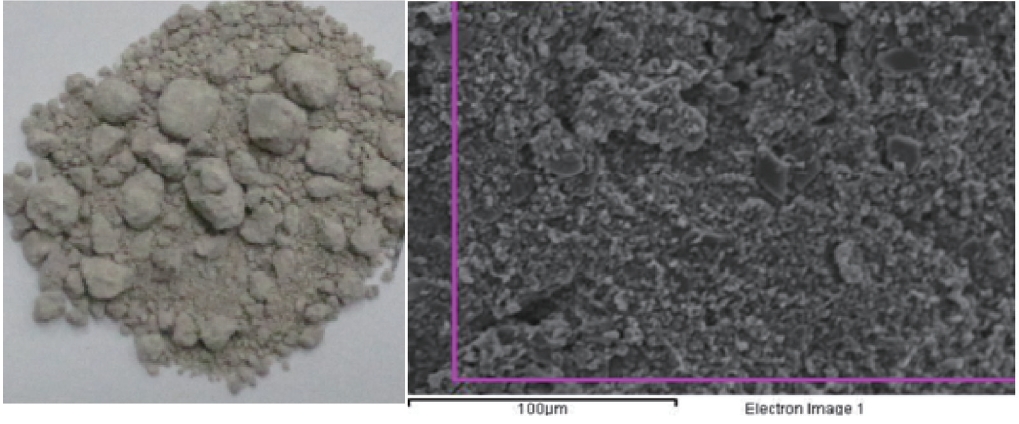
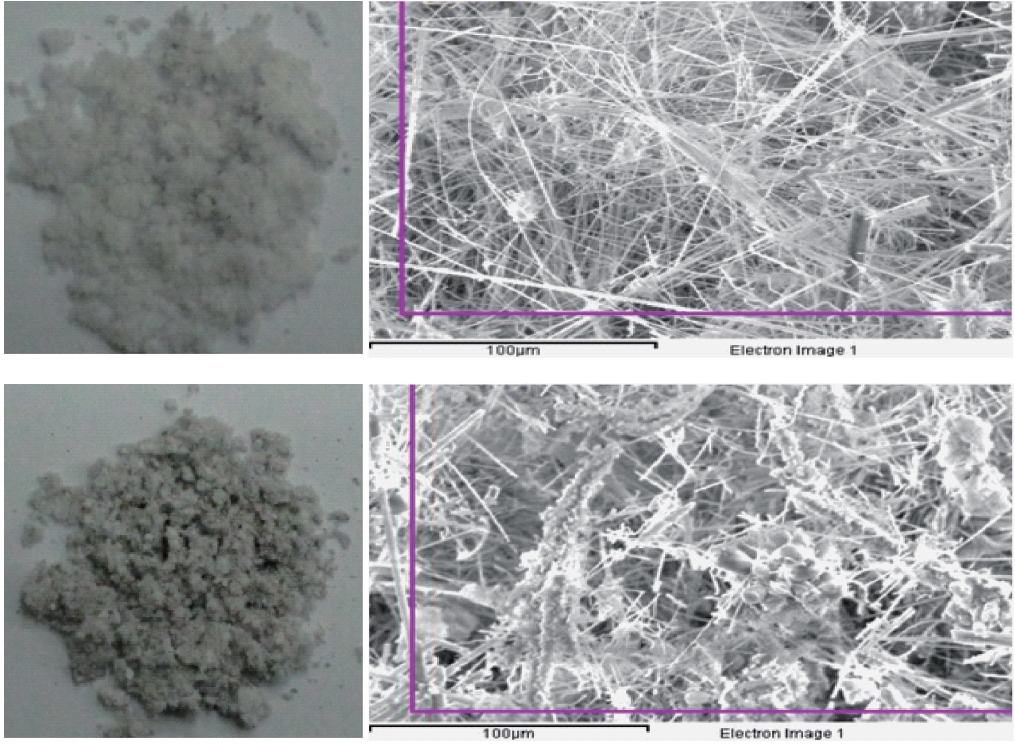
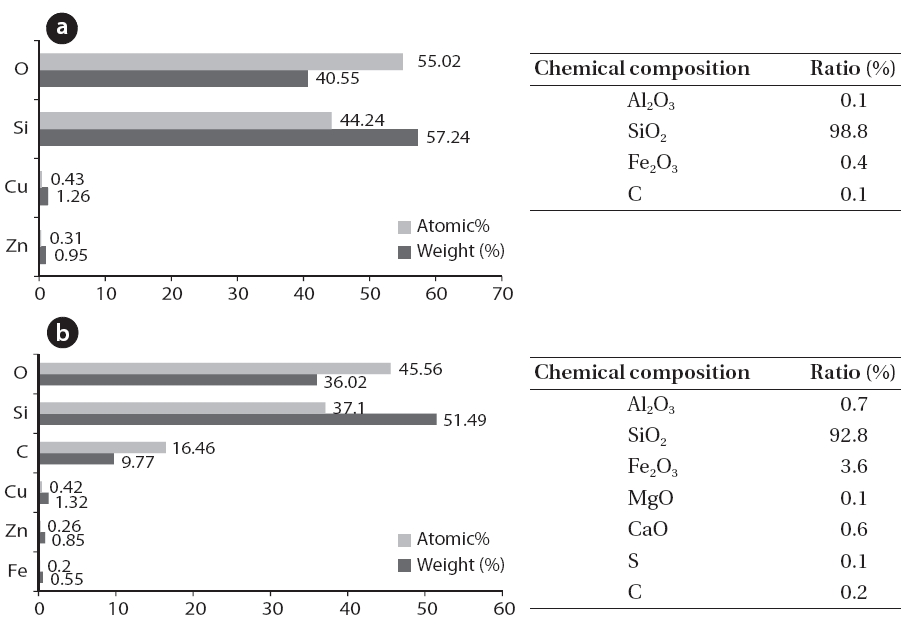
Fig. 5 shows the scale inside the boiler. The interior of the boiler was coated with white or light grey scale, and white crystalline scale was found on the walls (Figs. 5 and 6). An analysis of the elemental and chemical composition of the scale collected from the walls and the bottom of the boiler are shown in Figs.6 and 7. Scale collected from the walls of the boiler appeared like cotton and was the immediate filamentous type as shown by SEM. The scale on the walls of the boiler was pure silica and silicon crystals, which were composed of oxygen and silicon.The SEM-EDS analysis indicated that the scale collected on the bottom of boiler was light grey and looked like a thorn. It had the second largest content of carbon, (the first largest was oxygen and silicon), and the needle-like silicon was determined to be an organosilicone, which was directly combined with carbon atoms.
The reason that silicon dioxide scale is generated inside a boiler is related to the low removal rate of siloxane during the pretreatment process at LFG utility facilities. The S landfill LFG utility use a representative siloxane removal method by absorption,adsorption, freezing, cooling, and chilling (Fig. 1) [12].Impregnated activated carbon is used mainly as an absorbent,which is made from impregnated KOH, to remove acidic gas such as hydrogen sulfide. Condensing water or moisture generated
by the temperature and pressure differences during the process is different from nonpolar solvents such as methanol or acetone, which are effective for absorbing siloxane [8]. Therefore,some siloxane can be removed by absorption, but the removal efficiency of siloxane is poor during the pretreatment process that removes sulfur and moisture. It was determined that the siloxane that remained in the LFG at the pretreatment facility was converted into silica and some silica-generated scale.
Silica scale caused by siloxane results in abrasion of equipment,lower heat transfer efficiency, and clogging of valves and exhaust gas pipes in utility facilities. Because the equipment exterior is overheated if silica scale becomes thicker, it is necessary to remove the siloxane in advance or remove the silica.Silica scale has a low density due to its compositional features. Therefore, it was determined that such scale was deposited in the sludge pipe at the bottom of the boiler and valve and blocked the flow stream. Heat conduction of LFG by combustion worsened due to the low heat conduction of silica itself and an inner air layer of quilt (quilting by hand) when scale was deposited on the wall of the boiler functioning as a heat sink. Repair cost for silica scale damage is approximately US $60,000 per year based on a 1 MW engine [22]. The target LFG utility facility in this study suffers a loss due to maintenance fees and boiler shutdown (12 days per time) caused by periodic removal of silica scale.
We examined the creation of LFG and the characteristics of hydrogen sulfide and siloxane generation occurring at S landfill to investigate the effect of hydrogen sulfide and siloxane on LFG utility facilities. We also analyzed the scale components. The results we obtained are as follows:
1) As a result of analyzing LFG of the target S landfill, hydrogen sulfide averaged 436 ppmv (range, 22?1,211 ppmv), and total siloxane concentration averaged 7.95 mg/m3 (range, 1.85?21.18 mg/m3), which were similar to the general LFG composition range to satisfy CH4 concentrations for LFG utility facilities.
2) As a result of a scale analysis of the LFG utility facilities, the scale in GAH consisted mainly of Fe2O3 and the scale in the boiler consisted of >98% silicon dioxide.
3) The GAH scale was caused by hydrogen sulfide corrosiveness,and the scale on the walls and the bottom of the boiler were incurred by siloxane combustion.
4) The compositional characteristics of the immediate filamentous type added to the thermal cutoffs of the silicon dioxide scale resulting in adverse impacts on LFG utility facilities such as heat blocks and clogging of major components and exhaust gas pipes.