Supercavitation underwater vehicles use rocket propulsion systems with combustion of hydro-reactive metal fuel unlike other conventional underwater vehicles using the propeller propulsion systems. When a vehicle moves under the water, cavitation occurs on the body surface due to velocity difference between the body and the water. The cavitation on the surface develops rapidly with increasing velocity, and if this cavitation becomes supercavitation it is enough to wrap the whole body, subsequently the underwater vehicle escapes from the high drag force of water, and can potentially reach high speeds over 400 km/h. Moreover, a supercavitation underwater vehicle using a rocket propulsion system has a higher propulsive efficiency per fuel unit volume as compared to conventional underwater vehicles, because the surrounding water can directly serve as the oxidizer.
Aluminum (Al2O3) and magnesium (MgO2) are mostly used as hydro-reactive metal fuels. The combustion mechanism differs from other conventional particles (for example, coal or gunpowder). Indeed, oxide films covering the metal surface under normal state should be melted prior to the reaction with H2O. A uniform distribution of the metal particles in the jet helps their total surface to be larger, so the oxide films are able to melt easier. In the combustion reaction of water and hydro-reactive particles, Foote et al. (1996) reported that uniform mixing performance of water and the hydro-reactive particles causes a decrease of the ignition temperature and increase of the flame propagation speed, which indicate an increase in the specific impulse. Therefore, in order to design shear coaxial injectors that are able to uniformly spray water and particles, basic experiments on spray characteristics of the solid particles with the fluidization medium are required.
Investigations about particle injection have been actively carried out to develop coal combustors, which are part of the integrated gasification combined cycle plants since 1980.Modarress et al. (1984) investigated the effect of particle size, jet exit velocity, and loading ratio for an axisymmetric turbulent jet by measuring mean velocities, turbulent intensity, and shear stress. With increase of a particle loading ratio, a linear increase of jet center velocity at x/D = 20, a reduction of particle spreading angle, and a decrease of turbulent intensity are observed. Fleckhaus et al. (1987) examined the effect of the particle primary diameter on a particle-laden jet. They also fitted their experimental results with a set of analytical functions for improving the basic understanding of two phase flow phenomena. They concluded that the decrease of the particle primary diameter causes a reduction of the air velocity decay rate and the particle spreading angle, due to a decrease in the turbulent intensity. Gillandt et al. (2001)investigated the effects of influence turbulence modulation by analyzing the one-dimensional energy spectra of the axial velocity fluctuations for single and two phase jet flows. The addition of the particles to the jet causes turbulence intensity decrease because turbulence energy in the jet is dissipated by
[Table 1.] Experimental conditions of previous works
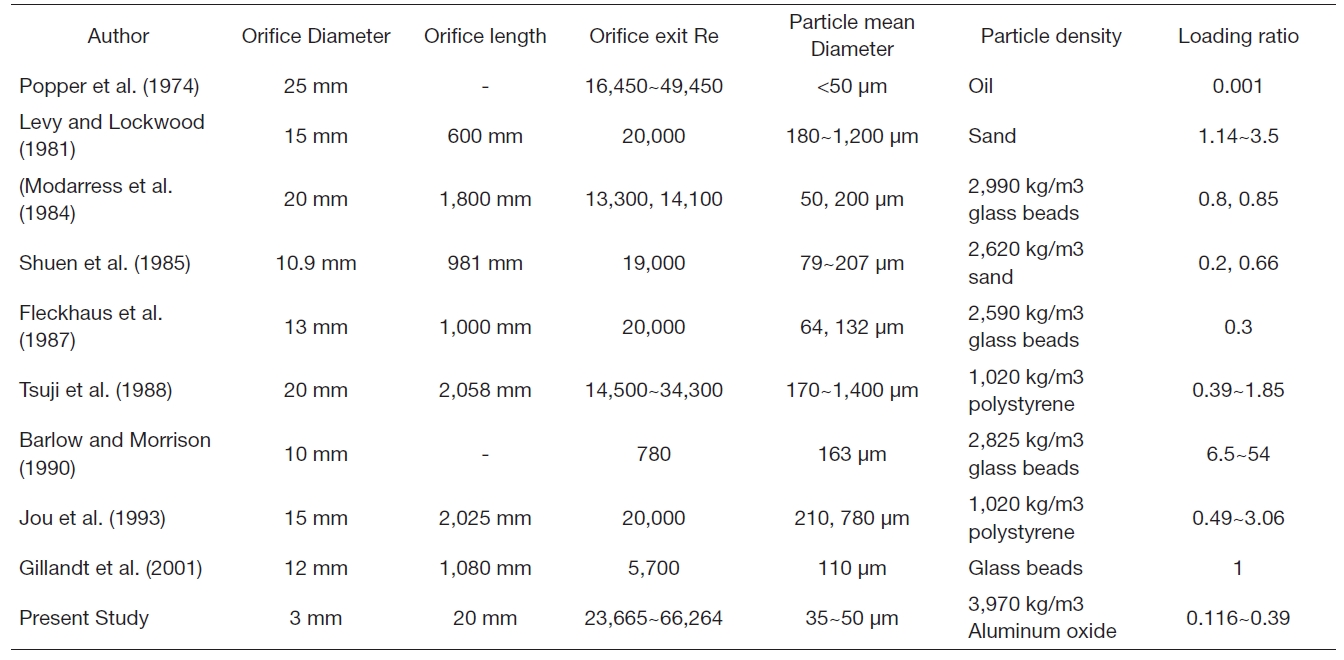
Experimental conditions of previous works
friction with the particle surface (Gillandt et al., 2001). Thus,it was found that the turbulent intensity is decreased with increasing total particle surface in the jet. Decreasing the turbulent intensity is related to diminishing the momentum exchange between the jet and the surrounding gas. As such,the decrease of the turbulent intensity causes the change in the jet velocity profile. The centerline velocity decay of the two phase jet is slower than that of a single phase jet, and the radial velocity profile of the two phase jet is steeper than that of the single phase jet (Laats, 1969). Additionally, the slip velocity is lessened by lowering decay rate of the gas phase due to diminishing the momentum exchange (Modarress et al., 1984).
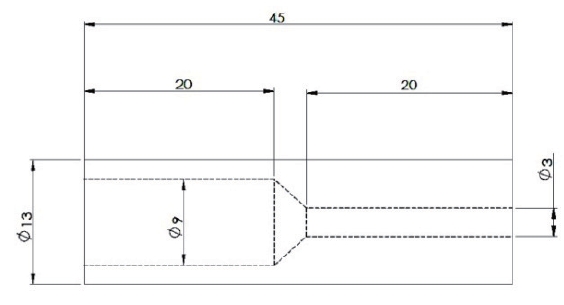
Experiment conditions of previous works are listed in Table 1. As shown in Table 1, all previous research adopted long orifice lengths from 600 mm to 2,025 mm, and large orifice diameters from 10 mm to 25 mm. Due to the limitation of space in the underwater vehicle, the orifice length and diameter should be downsized as compared with other investigations. In this study, with particle image velocimetry (PIV) measurement, the profiles of particles velocity, turbulent intensity, and number density of particles are investigated to know the effect of the loading ratio on the particle developing region and the particle spreading angle of the two phase jet using the plain orifice type injector.
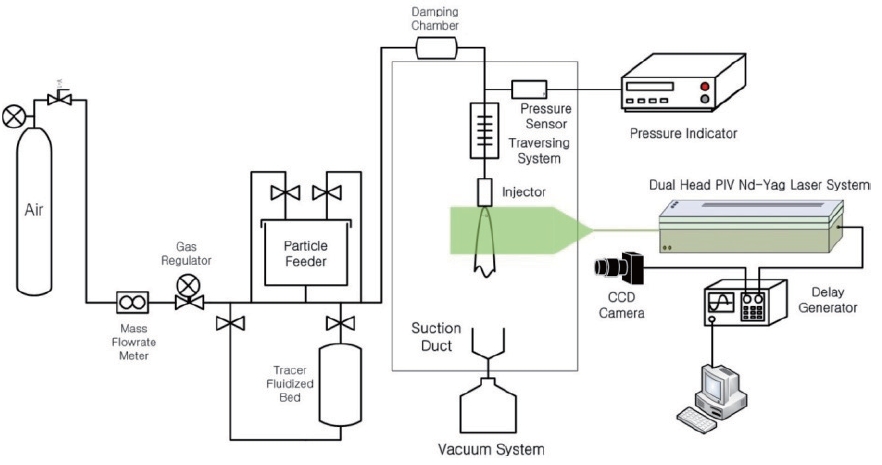
The experiment setup is shown in Fig. 1 Air is used as the carrier gas, and the air flow rate is measured by a mass flow meter (M-1500SLPM-D; Alicat Scientific, Tucson,AZ, USA), and manually controlled with a gas regulator.A pressure sensor (PTAF0020KAA; Sensys, Ansan, Korea)is used for a secondary measurement to check the air flow
rate. Particles of primary size 35~50 μm are supplied to the pipeline via a particle feeder using an automated feeding screw. To determine the orifice exit velocity, tracer particles with a primary size of 0.5~2 μm are respectively provided in the pipeline by a tracer feeder. A damping chamber is installed on the experimental rig to eliminate the pulsation of the particle flow rate. The injector shown in Fig. 2 is placed on a vertical traverse to enable vertical adjustment. The experimental rig is sealed with transparent polycarbonate covers with the ceiling open, and the rig size designed in order to avoid the boundary effect of 1,000 × 1,000 × 1,500.A PIV measurement is used to measure the air and particles velocities, respectively.
The laser system used in the experiment is a dual head PIV Nd-YAG laser (Surelite II-PIV). A pulsed laser sheet beam with a 10 Hz pulse frequency, made by a digital pulse generator (DG535; Stanford Research Systems, Sunnyvale,CA, USA) and optical lenses, passed vertically through the jet center, and particle scattering images are captured by a charge-coupled device (CCD) camera (MegaPlus ES2020;Princeton Instruments, Trenton, NJ, USA) with a 1,200 ×1,600 size. In each case, 300 pairs of CCD images are acquired to obtain averaged velocity vector fields. For the CCD image processing, in-house PIV code is used (Hart, 1998).
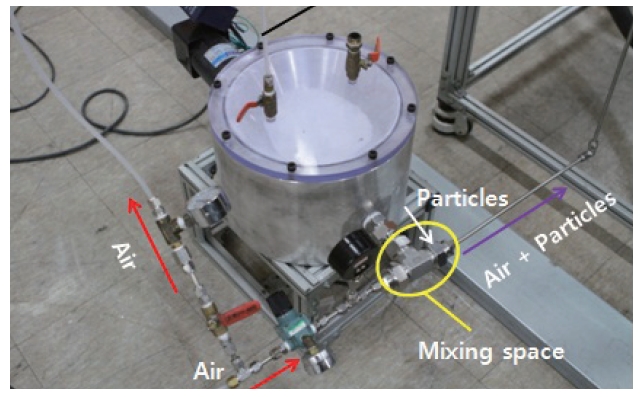
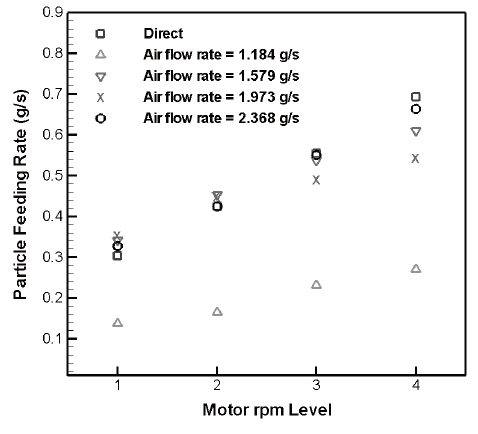
Figure 3 shows an automated particle feeder designed to supply constant particle mass flow rates. A cone structure inside of the particle feeder is sealed with a polycarbonate cover and pressurized to the same pressure using a tube where the air passes through to prevent a backward flow of particles. A screw, which is put inside the particle feeder, is rotated by an AC variable speed motor attached to an end of the screw. When the screw spins, particles loaded between the screw;s pitch are transported to an air line. The particles fluidized by the air are then sprayed through the injector orifice. In order to get particle flow rates for each feeding condition, particles sprayed through the orifice are collected into a flask filled with sticky syrup for a certain period of time,and then mass changes are measured by a load cell. Figure 4 shows averaged particle flow rates. In Fig. 4, the “Direct”condition means the particle supply rates of the particles coming out from the particle feeder exit are collected on the load cell and measured directly. Motor rpm levels, which represent gradations on the motor control panel, are arbitrary experimental conditions to get the constant particle flow rates. Direct points grow linearly with increasing motor rpm
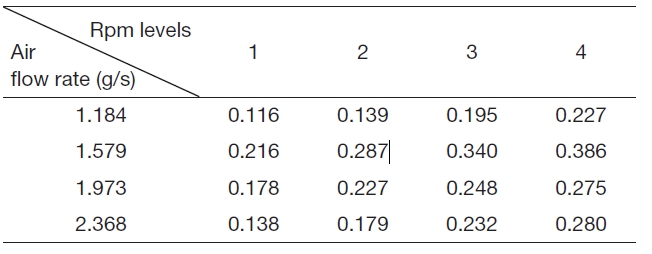
levels in Fig. 4 As such, it can be seen that the rotational speed of the screw increases linearly with increasing the motor rpm level step by step. Comparing “Direct” with other particle mass flow rates measured from the orifice exit, all feeding conditions are well supplied without any accumulation in the line except for the condition of air flow rate 1.184 g/s and the highest rpm condition. In the condition of air flow rate 1.184 g/s, the air velocity is not enough to carry the particles,so particles are believed to deposit in the damping chamber.The particle mass loading ratio is the ratio of particle mass flow rate to the gas mass flow rate. The mass loading ratios obtained from the experimental conditions are shown in Table .2 More information about the experiment is listed in Table 3.
In this experiment, the particle-laden jet shows the particle developing region, which is defined as a zone from the orifice exit to the point where particle velocity reaches maximum, as shown in Fig. 5 If the orifice length is short, the particles accelerated by drag force from the orifice entrance are not able to reach the air exit velocity due to their inertia,and so the particle developing region appears. After the particle developing region, the particle velocity dwindles,and the turbulent intensity increases. It is considered that

Loading ratios.
[Table 3.] Experimental conditions.
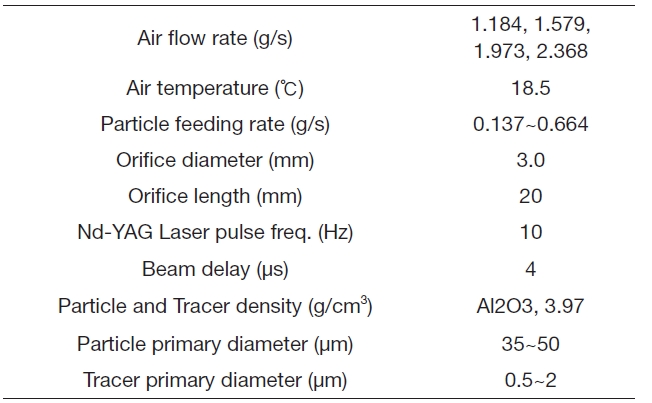
Experimental conditions.
the particles exchange momentum with surrounding gas entrained in the jet center after the particle developing region.From the orifice exit, the longer the particle developing region, the farther a spot where particles actively diffuse.Thus, it is believed that the length of the particle developing region contains information of the particle diffusivity along the axial direction.
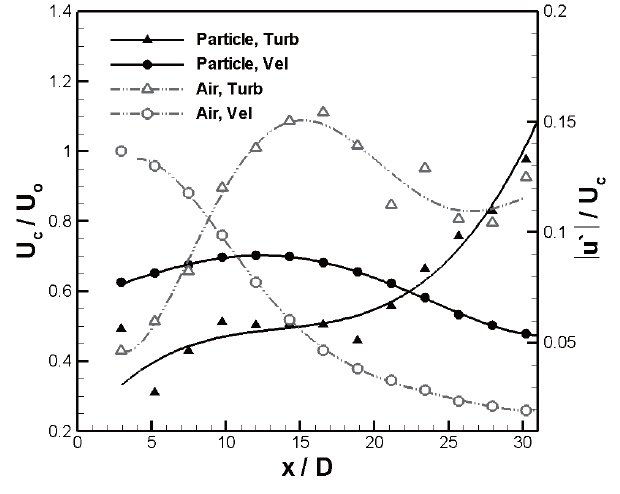
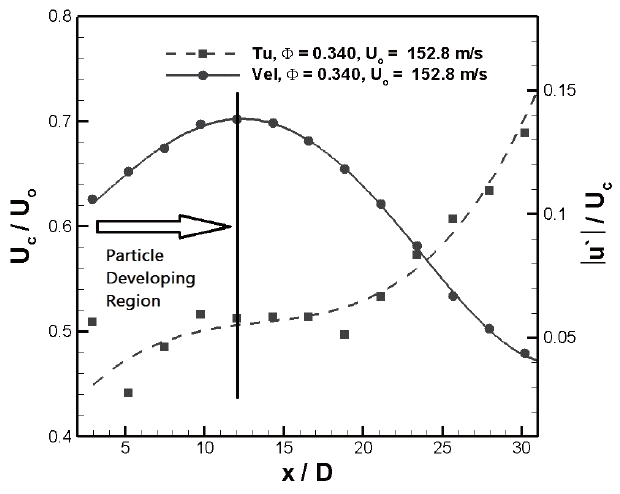
Figure 6 represents the velocity and turbulent intensity profiles of air and particles along the jet centerline. The turbulent intensity is defined as the ratio of the root-meansquare of the velocity fluctuation, 'u;', to the mean stream velocity. These profiles are obtained by the injection of the particles and tracers respectively, so profiles of air and particle are independent of each other. The reason that particles and tracer are not sprayed simultaneously is to focus only on the behavior of particles. If the tracer was sprayed with particles at once to measure the air velocity, the tracer could have an effect on the behavior of particles. According to Modarress et al. (1984), the velocity of air at the orifice exit is the same regardless the presence of particles in the jet. For this experiment, although particles and tracer are sprayed separately, it can be considered that the air velocities of both, with and without particles at the orifice exit, are similar because of similar spray conditions. Therefore, the centerline velocity profiles of both are normalized by measured air velocity at the orifice exit.
In Fig. 6,the velocity of particles is lower than that of air at the orifice exit. From the entrance of the orifice, with acceleration of air, particles are accelerated by the drag force,but the velocity of particles does not reach that of the air at the orifice exit due to collision between the particles and the orifice wall, inter-particle collision, inertia of particles,and insufficient orifice length to accelerate. After coming out of the orifice, the air momentum is transferred to the particles and surrounding air, and so its velocity rapidly decreases. Meanwhile, particles are accelerated by receiving momentum until they reach the end of a particle developing region, where particle velocity is at maximum (Park and Chen, 1989). After the particle developing region, air keeps the steep reduction of the velocity due to the momentum transfer to the surrounding air, while particles show a gradual reduction of the velocity because of their inertia. Therefore,the decay rates of the velocities of air and particles are different right after the particle developing region. As shown in Fig. 6,it has been observed that turbulent intensities rapidly increase from the point where velocities decrease for both air and particles. Especially, in the case of particles,the turbulent intensity starts to increase after the particle developing region. It seems that velocity decreases and turbulent intensity increases after the particle developing region because the entrainment of surrounding air totally permeates the jet center after that region.
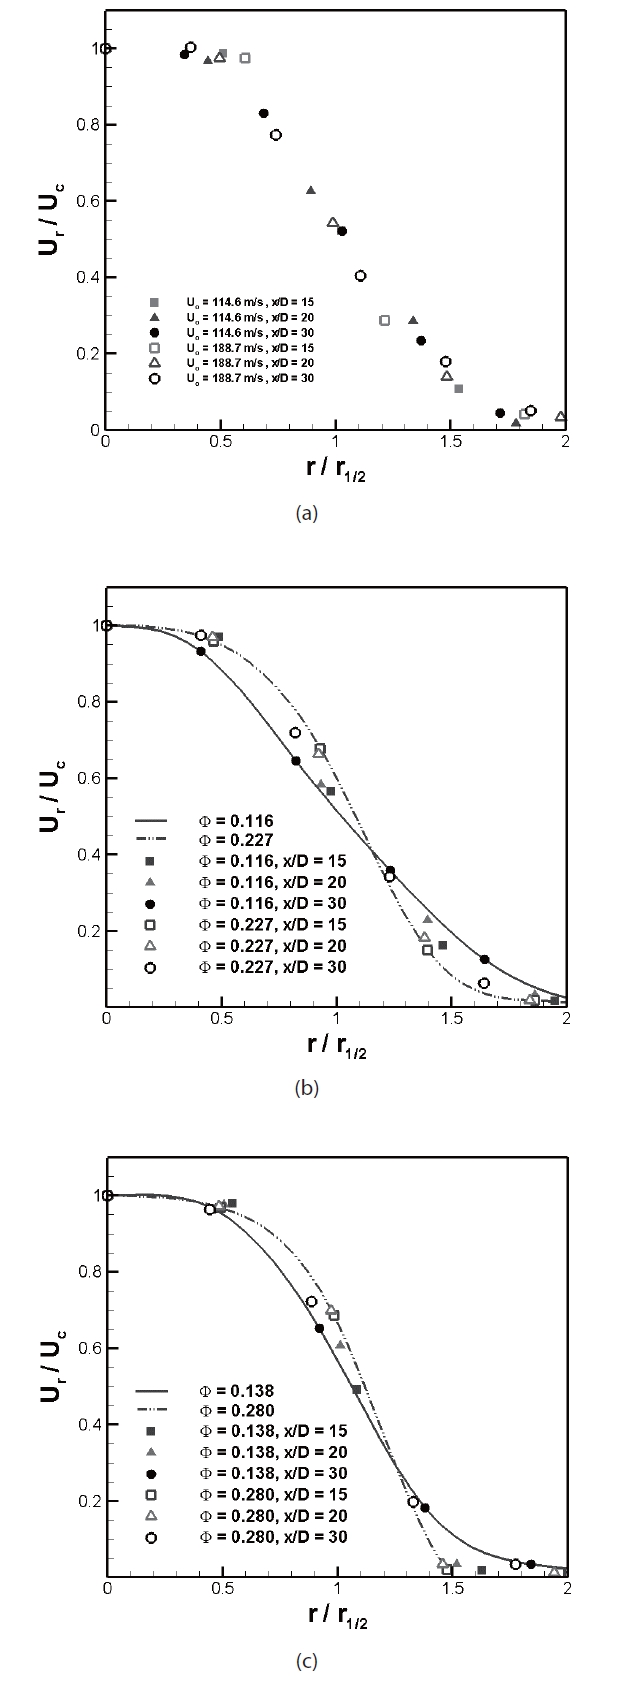
Figure 7 shows normal velocity profiles of particle and air along the radial direction for different orifice exit velocities and loading ratios. Normal velocities of radial direction are normalized by the centerline axial velocity, and radial distance from the jet center is normalized by r1/2 , which is full width at half maximum of the velocity profile. In Fig.7a, the velocity profiles of the air display self-similarity,regardless of the orifice exit velocity in the fully developed region where x/D is higher than 10. The velocity profiles of particles, as shown in Figs. 7b and c, are not self-similar with different loading ratios. In both graphs, the condition of higher loading ratio shows a steeper velocity profile than the other. A steeper velocity profile shows that the momentum exchange between the jet and the surrounding air is slow
compared to the less steep one. If the jet contains more particles, large eddies, which are produced by entrained air, easily break up into small eddies (Gillandt et al., 2001).This phenomenon causes that the momentum exchange to become small, and therefore the velocity profile of the particles becomes steep.
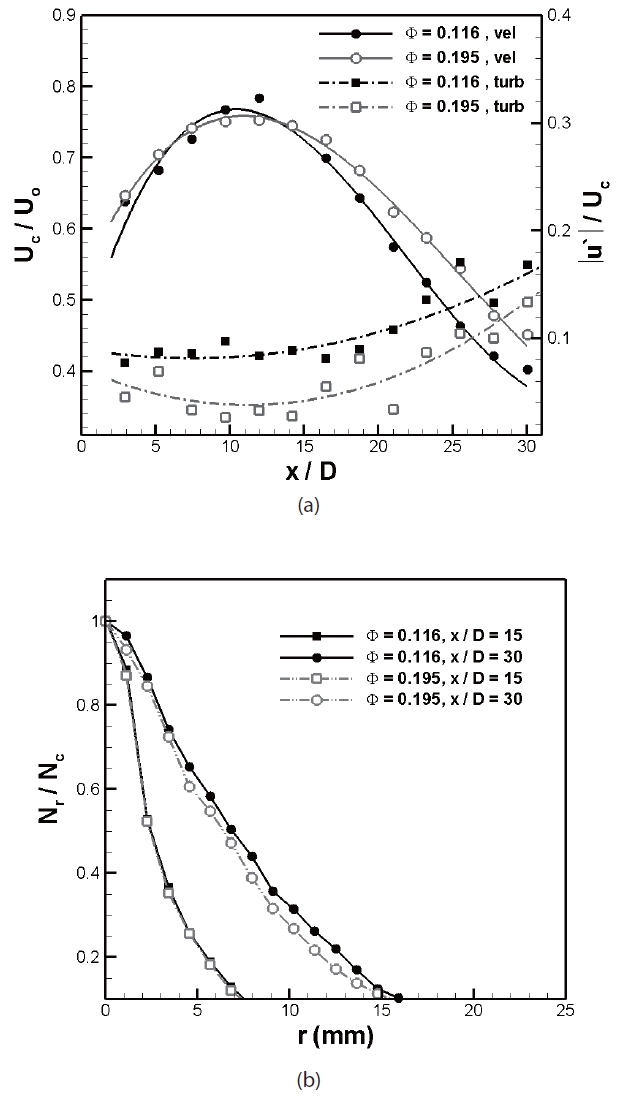
Figure 8a shows the changes in the profiles of velocity and turbulent intensity with different loading ratios in the same orifice exit velocity. According to Biing-Hwang Jou et al. (1993), the particle’s axial mean velocity is almost independent of the particle loading ratio. However, in this experiment, it has been found that the decay rate of the axial velocity becomes slow as the loading ratio increases. This is
also related to the eddy break up. Due to the increase of the particle loading ratio, large eddies are readily split into small eddies, thus the turbulent intensity which is strongly related to the eddy size, is damped, as shown in Fig.8 a. Damping of the turbulent intensity makes it difficult to exchange the momentum between particles and surrounding air, therefore the slowing down of the velocity decay rate can be explained.Radial profiles of the particle number density with different loading ratios are shown in Fig.8 b. Comparing profiles of x/D = 30, the condition of higher loading ratio has a slightly steeper distribution. From this result, it can be concluded that the increase of the loading ratio makes the distribution of particles narrow, owing to the decrease of the momentum exchange.
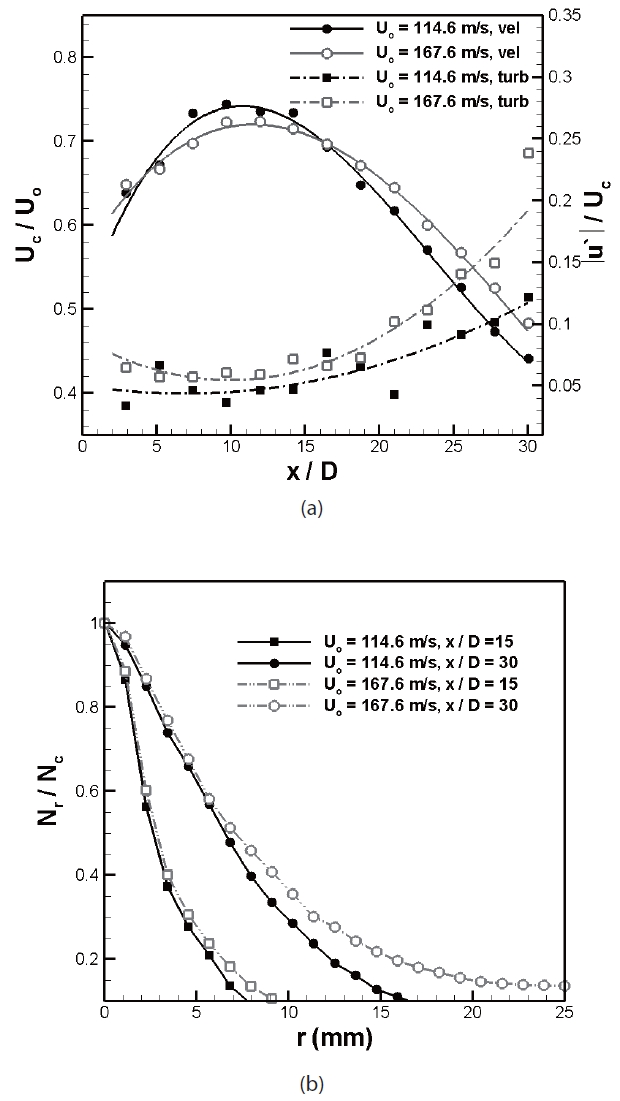
Turbulent intensity is proportional to jet velocity at the orifice exit, because if the velocity gap between the jet and the surrounding air becomes larger as the orifice exit velocity increases, bigger eddies are generated in the jet.Figure 9a shows the effect of the jet velocity at the orifice exit on particles. In this figure, although the turbulent intensity increases, the velocity profile of the centerline declines slowly, contrary to the effect of the loading ratio. This is because the jet for which exit velocity is 167.6 m/s has much more momentum than the other jet. It seems that the effect of the velocity is greater than that of the turbulent intensity on the velocity profiles. The effect of the turbulent intensity is
revealed better in the profiles of the particle number density.In Fig.9 b, the spray condition of exit velocity 167.6 m/s shows a much wider particle distribution than the spray condition of exit velocity 114.6 m/s at x/D = 30. The increase of the orifice exit velocity produces bigger eddies, and so particles are widely distributed due to the increase of the momentum transferring.
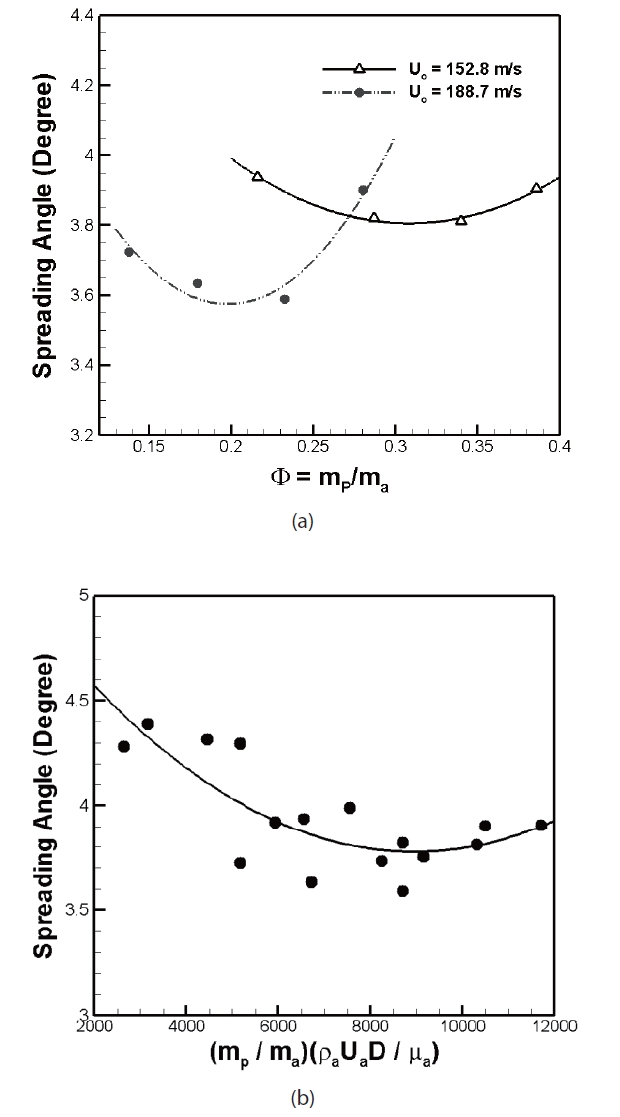
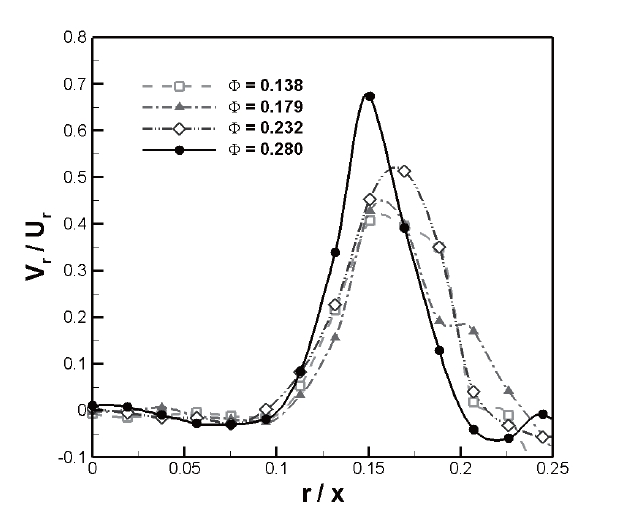
Figure 10 shows spreading angles with different spray conditions. The spreading angles are obtained from a distance between “D/2” and “r1/2” at x/D = 30. In Fig.10a, spreading angles are reduced with the increasing the orifice exit velocity, and are shown to be parabolic curves as the loading ratio increases. These trends correspond well to the trend of Fig.10 b. Decreasing of the spreading angle as the loading ratio increases can be explained by the reducing of the momentum exchange, but the tendency of the spreading angle to increase again is seen, as the radial velocity components of particles increase as shown in Fig. 11This is because, when the particle number density increases in the jet, inter-particle collisions become more intensified, making the radial velocity components enlarged.It is considered that the increase of axial velocity component and the decrease of the particle number density cause the diminution of the spreading angle with the increase of the orifice exit velocity. From Fig.10 b, it is predicted that the spreading angle increases again with a further increase of the orifice exit velocity.
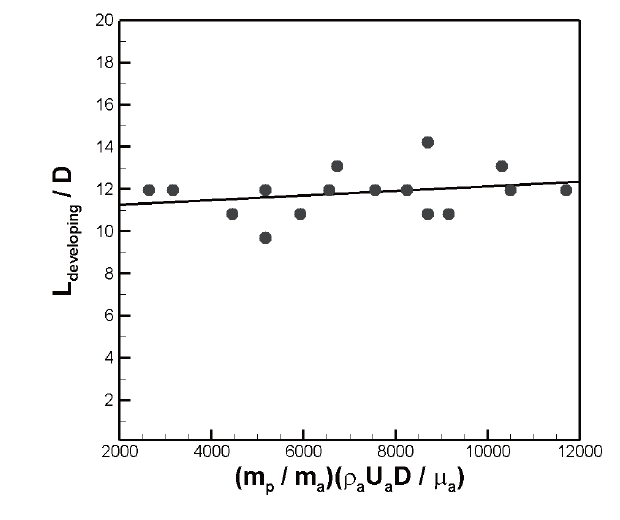
The result of changes in the length of the developing region considering all spray conditions is shown in Fig. 12 In the experimental conditions, the lengths of the developing region normalized by the orifice diameter are distributed
within the range of 9 to 14. This result means that the effects of the loading ratio and the orifice exit velocity on the length of the developing region are ambiguous, and so it is expected that the length of the particle developing region is a function of the orifice geometry.
An experiment of solid particle spray is conducted for designing a proper injector of the supercavitation underwater vehicle by using a plain orifice type injector.In a condition of orifice length 20 mm, which is a required design criteria, the effect of particle loading ratio and orifice exit velocity on the particles velocity, turbulent intensity, and particle number density are investigated by means of PIV measurement. Further, the particle spreading angle, and the length of particle developing region, which have information of particle distribution in the jet, are examined.
Axial velocity profiles of particle along the radial direction are not self-similar with different particle loading ratios, and the profiles of higher loading ratios become steeper.
As the particle loading ratio increases, the decay rate of axial particle velocity profiles becomes slow, and turbulent intensity profiles are reduced.
As the orifice exit velocity increases, the decay rate of axial particle velocity profiles becomes slow, and turbulent intensity profiles are increased.
Spreading angles are reduced with the increasing the orifice exit velocity, and are shown to be parabolic curves as the loading ratio increases.
The lengths of particle developing regions are within the range of 9 to 14 in the experiment conditions.