Earth's climate, biota, and ecosystems are changing constantly, and have been changing since life began billions of years ago. Only recently, though, have we begun to understand how these changes are regulated on a global scale. Some of the most exciting scientific discoveries of recent decades have shown us how physical, geological, chemical, biological, and human processes all interact with each other to control this never-ending process of global change.
Global Change Research is an attempt to increase our understanding of those processes and interactions that regulate the total Earth system, and of their cumulative effects on the future of our planet. The study of Global Change is particularly important, as it is now clear that human social and economic activities around the world are having an impact that can be measured at the level of the entire Earth and its atmosphere, oceans, and land surface. Human activities are probably the most rapidly changing component among the major regulators of the Earth system, and may, in the future, play a dominant role in the regulation of global climate, global biogeochemistry, and the diversity and stability of global ecosystems (http://www.lternet.edu/global_change) (Lee et al. 2006).
Our planet and global environment are witnessing the most profound changes in the brief history of the human species. Human activity is the major agent of those changes--depletion of stratospheric ozone, the threat of global warming, deforestation, acid precipitation, the extinction of species, and others that have not become apparent (Defries and Malone 1989).
Humans manage much of the Earth system, and their role in this regard is certain to increase in the future. However, this management of the whole Earth is not always acknowledged, much less clearly understood. It is incumbent on humans to understand how their actions have global effects, and to use that understanding to manage their impacts on the global as well as the local levels. For this reason, Global Change Research is a high national and international scientific priority (http://www.lternet.edu/global_change).
The term “Long Term Ecological Research (LTER)” was used for the first time as NSF of USA begins to supply research fund by the name. LTER is a method of ecological research which is progressed long time in a given ecosystem as a research system being required necessarily in the ecological study, in which spatial scale for research object is big and thereby long period is required for understanding the reality. This research system began long period to get agreement globally as the importance and research efficiency of LTER are embossed from 1990’s (Ministry of Environment of Korea 2004b) and similar research programs of various countries around the world were joined into ILTER in 1993 (Ministry of Environment of Korea 2004a).
LTER sites are windows to global change. As observatories, LTER sites serve to document long-term changes in plants, animals, microbes, and soils in relation to long-term climate and short-term weather changes. As locations for long-term experiments, LTER sites illuminate interactions among the physical, chemical, and biological components of ecosystems through controlled manipulations. As representatives of global biodiversity, LTER sites allow for comparisons of the relative sensitivity of populations, communities, and ecosystems to environmental changes. Finally, synthesis and modeling of results from LTER sites provides predictions of feedbacks, both positive and negative, on global change. Research at LTER sites spans a broad range from relatively less-managed landscapes such as arctic tundra, to intensively managed cities and farmlands.
The Korean National Long-Term Ecological Research (KNLTER) designated Mts. Jeombong, Worak, and Jiri as the representative research sites for the northern, central and southern areas of South Korea, respectively. In addition, Mt. Nam, the Yeocheon industrial complex, Wanju, Jeju Island, and Samcheok were designated as sites for researches on terrestrial ecosystem of urban, industrial, agricultural, island and burned areas, respectively. The Han River, Nakdong River, Upo swamp, Daecheong Dam, Saemangum tidal flat, Hampyung Bay, and Goraebul sand dunes were designated as research sites for the monitoring of the aquatic ecosystems.
Forest environments are currently faced with severe environmental stress and disturbances. Excessive development of forests from population increases, climate change due to increases in warming gases, environmental pollution, and resultant severe changes are predicted. In order to cope with this real aspect and the changes that may occur in the future, the dynamics of forest communities need to be analyzed. The accumulation of basic data through the LTER could be helpful for understanding of the structure and function of the global ecosystem, and may also contribute profoundly maintenance and management of the ecosystem.
Mt. Nam is located in the center of Seoul, as a LTER site of urban area. The area, where Mt. Nam is located, has experienced very rapid changes in landscape structure due to urbanization and industrialization accelerated since the 1960s. Changes in the landscape structure of Seoul were attributable to increases of urbanized area. Forest and agricultural fields such as paddy and upper fields have decreased as the result of these changes. Excessive land use by humans has resulted not only in quantitative reductions but also qualitative degradation of greenery space, which absorbs and filters environmental stresses such as air pollution, acid rain, and the urban heat island effect. Causal factors of forest decline in Seoul are difficult to clarify through temporary and partial research as forest decline is result from the interaction of various factors. In this regard, Mt. Nam is a crucial site for long-term ecological research on the urban landscape (Cho et al. 2009a, 2009b).
Mt. Jeombong is located on Girin-myeon, Inje-gun, Gangwon-do, in central-eastern Korea, and is the representative forest area in Korea. Deciduous broad-leaved forest is well developed and diverse plant communities appear, and thus the area is of high academic value (Lee et al. 2000).
The objectives of this study are as follows: 1) to clarify the ecological characteristics of Mts. Nam and Jeombong by analyzing the structure and dynamics of the
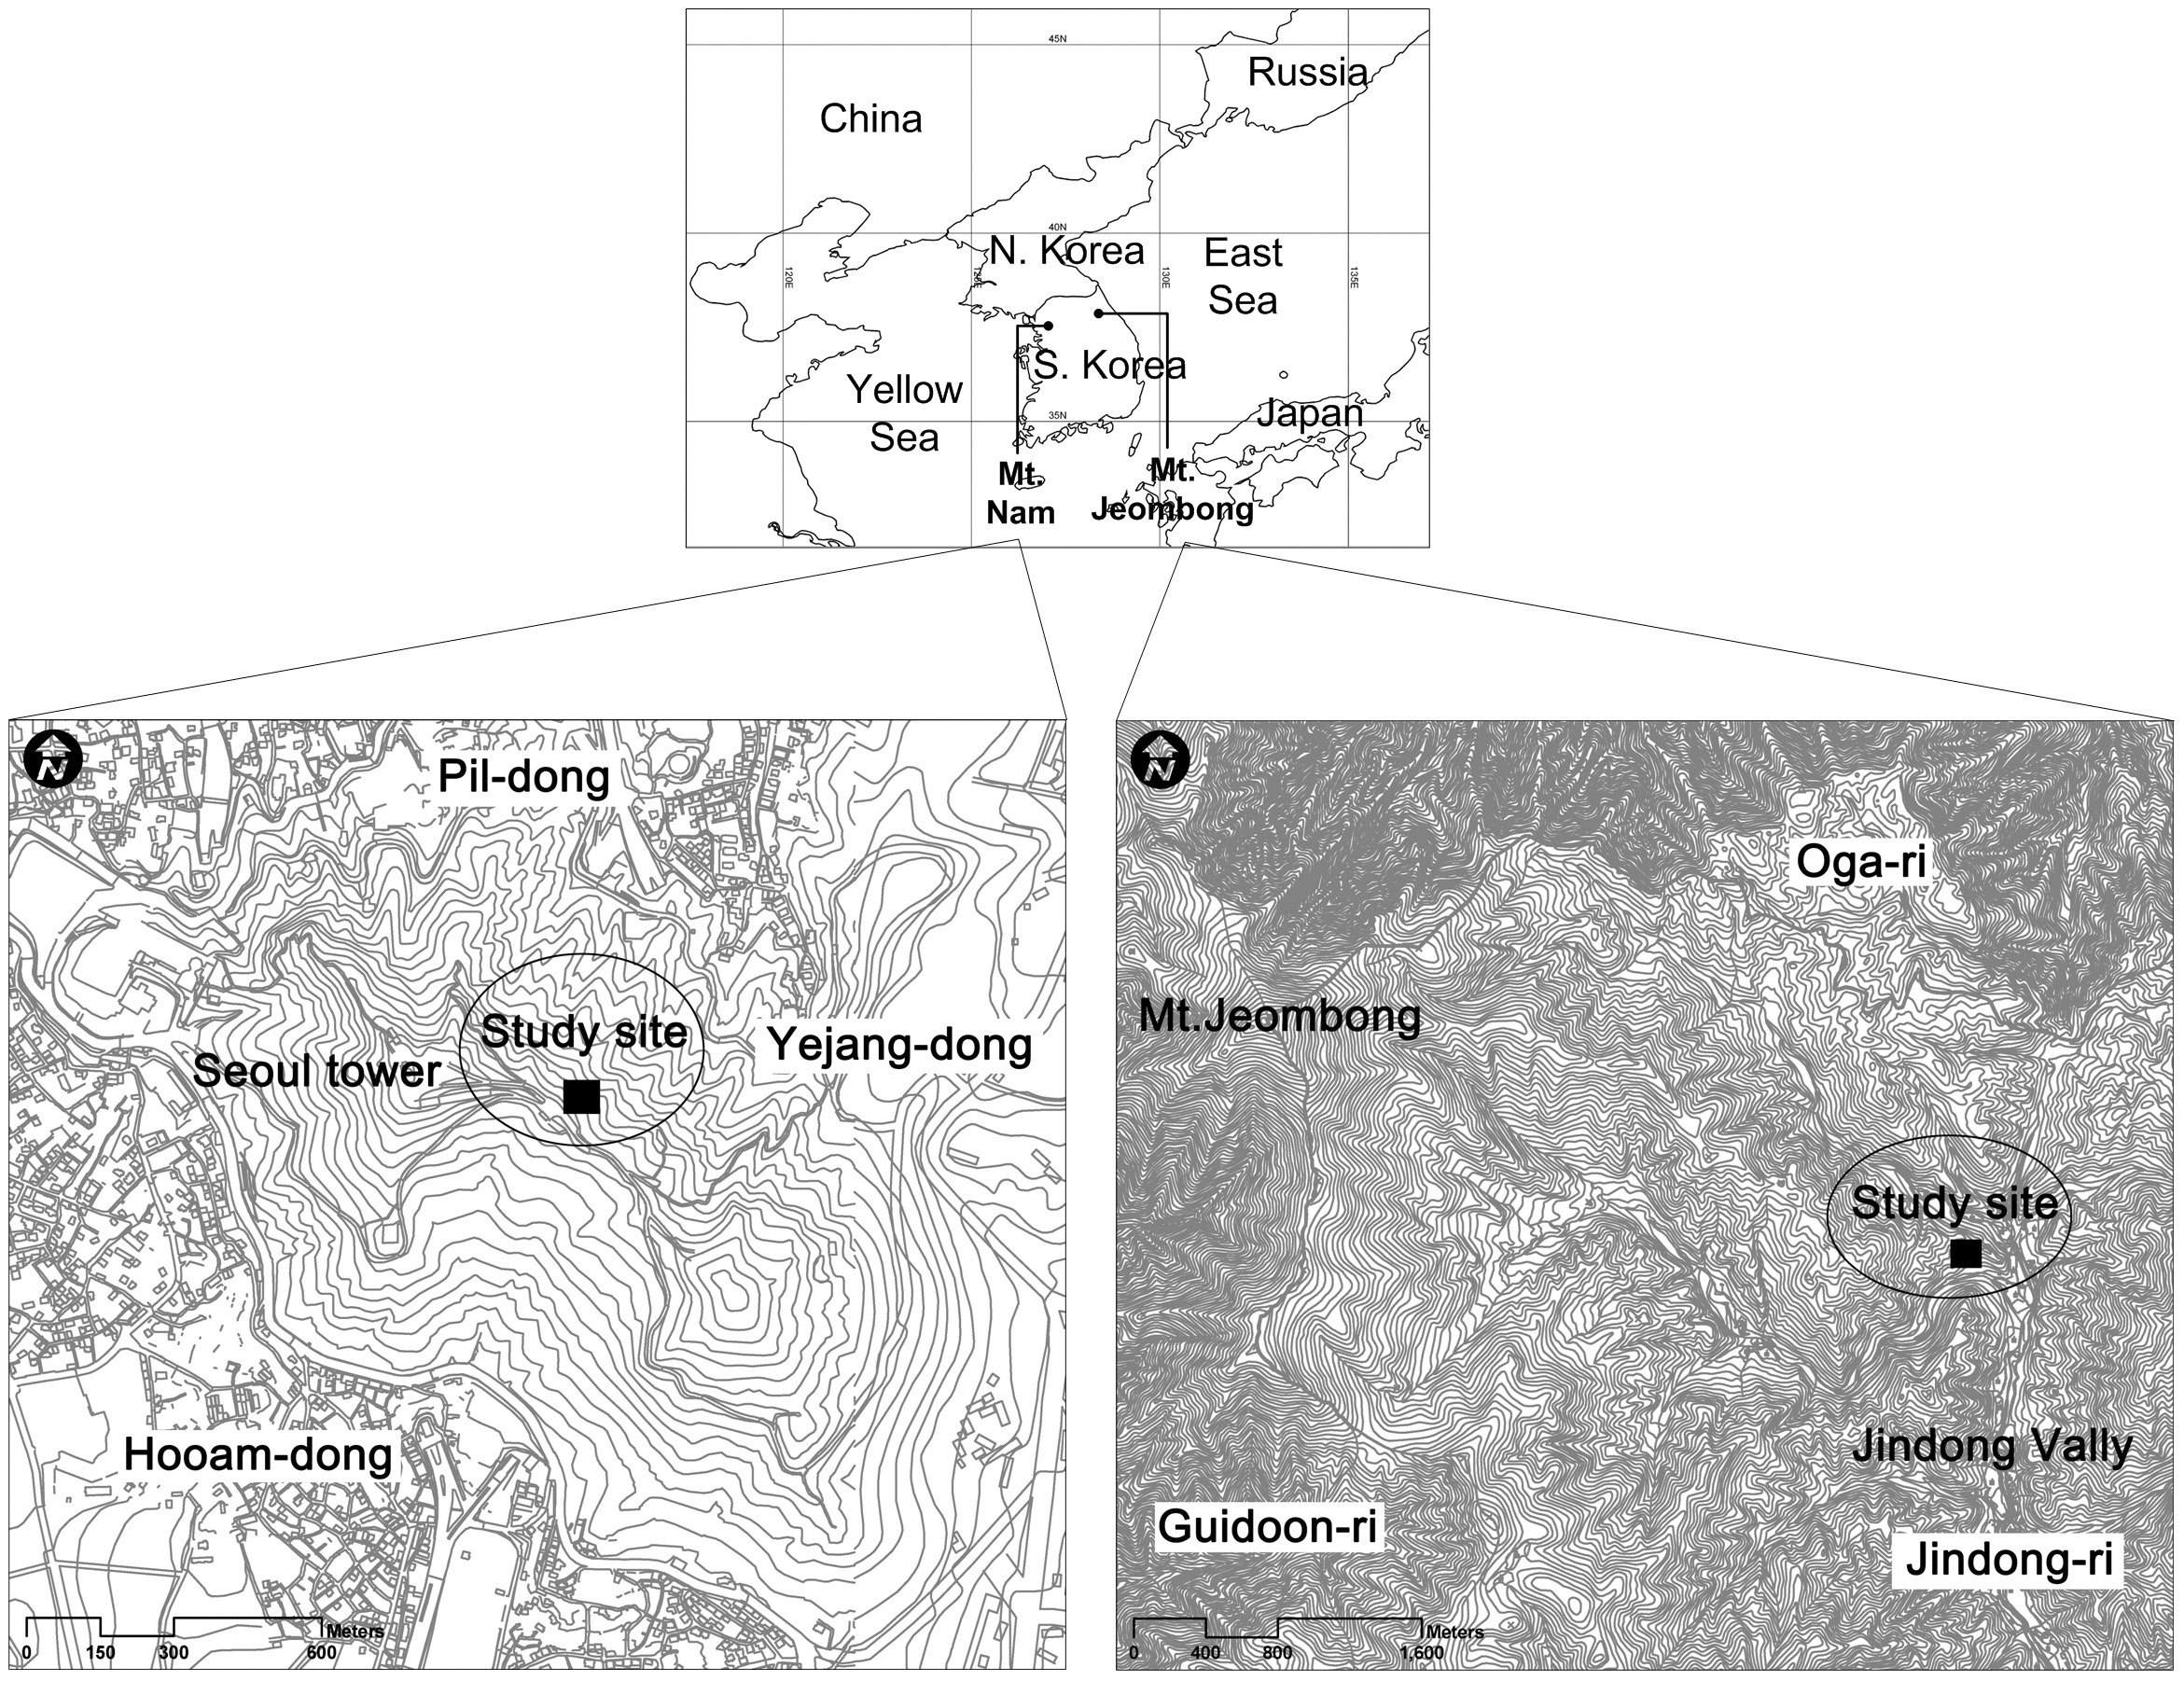
[Fig. 1.] Physiognomic vegetation maps of Mts. Nam and Jeombong showing the location of study sites.
orgmonitoring of Q.
Mt. Nam
Mt. Nam is located in the central part of Seoul and ranged from 37°32' to 33' N in latitude and 126°58' to 127°00' E in longitude (Fig.1 ).
Its northern and western slopes are steep with many outcrops, whereas its southern and eastern slopes are characterized by a gentle and simple topography (Seoul Metropolitan Government 2004).
The soil of Mt. Nam is composed of sandy loam, clay loam and sand, the northern slope in usually covered with clay loam, and the southern slope with sandy loam. Soil depth is usually deep, and the soil moisture condition is medium to moist (Seoul Metropolitan Government 2004).
The landscape of Mt. Nam is composed of secondary forest, plantation, plantation for landscape architecture, and urbanized areas. The secondary forest is usually consisted of Q.
Mt. Jeombong
Mt. Jeombong stretches out Inje-gun and Yangyang-gun, Gangwon-do, from 128°25' to 30' E in longitude and from 38°0' to 5' N in latitude, and is located on the southern tip of Mt. Seorak National park. This mountain was designated as a Biosphere Reserve by United Nations Educational, Scientific and Cultural Organization (UNESCO)’s Man and Biosphere Project (Fig.1 ) (Lee and Cho 2000).
The annual mean temperature and precipitation of Inje-gun, where Mt. Jeombong is located, are 10.2°C
and 1,135.7 mm, respectively. The mean temperature in January--the coldest month--and August--the warmest month--are -4.8°C, and 16.6°C, respectively (http://www.kma.go.kr).
In Mt. Jeombong, artificial disturbances are relatively rare and thus the forest condition is close in natural forest. The dominant tree species are Q.
Installation of permanent plots
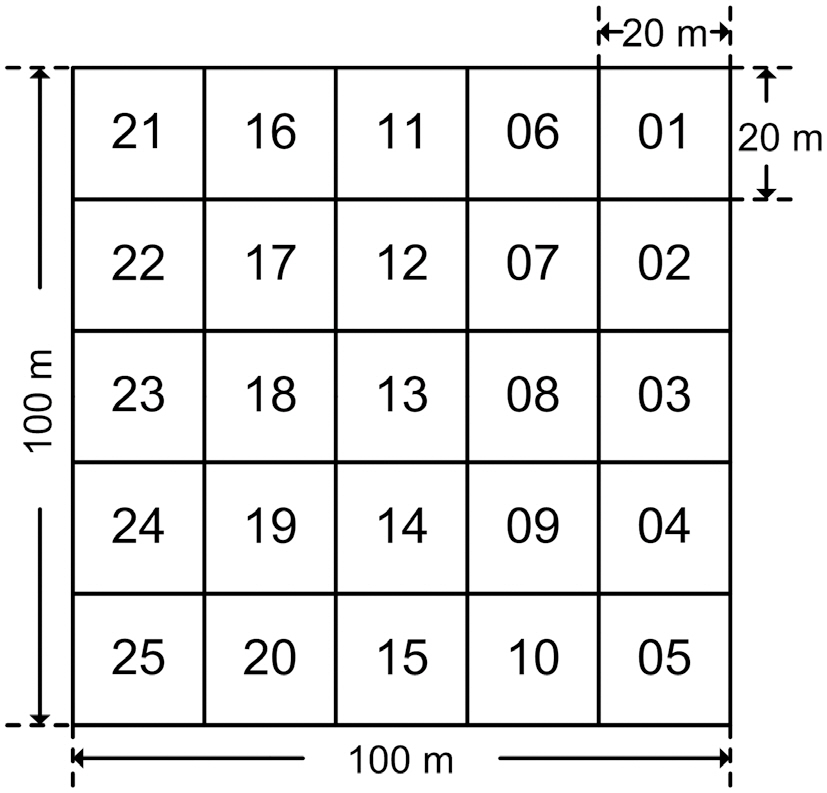
Permanent study plots of 1 ha (100 m × 100 m) per site were installed in the Q.
In order to carry out survey and management efficiently, the 1 ha plots were divided into 25 subplots of 20 m × 20 m each (Fig.2).
Measurement of topographic factors
Altitude above sea level (m), longitude, and latitude were measured by GPSMAP 60CSx (Garmin Inc., Olathe, KS, USA) and the slope and aspect of each subplot were measured with a clinometers (SUNNTO) and compass (SUNNTO), respectively.
Collection and analysis of vegetation data
The vegetation survey was conducted from April to October, 2005 at the Mt. Nam site and in May, 2009 at Mt. Jeombong. The dominance of each species in each site was evaluated on the Braun-Blanquet (1964) scale, and each ordinal scale was converted to the median value of the percent cover range in each cover class. Differences in species composition among study sites were analyzed via detrended correspondence analysis (DCA) (Hill and Gauch 1980) using PC-ORD 4 (McCune and Mefford 1999).
Vegetation stratification was analyzed by constructing stand profile diagrams by height range and mean coverage of each vegetation layer collected in 25 subplots of each site. Species diversity was compared via Shannon-Wiener index and species rank-dominance curve (Shannon 1948, Magurran 2003).
In order to predict the likelihood of continuous maintenance and successional trends of actual vegetation, frequency distribution diagrams by diameter class of major species were prepared (Daubenmire 1968, Oh and variChoi 1993, Lee et al. 1998) and a transitional probability model based on Markov chain was applied (Jin and Kim 2005). Diameters were measured with measuring tape at a height of 1.3 m from ground level for woody plants more than 2.5 cm in diameter at breast height. Height was measured with an ultrasonic distance meter (Haglof Vertex Laser VL400; Haglof Company Group, Langsele, Sweden). Basal area and density were obtained based on the collected data, and the importance value of each species was obtained by dividing the sum of the relative values of two indices by two.
Plant growth was measured by analyzing annual ring growth. Core samples of annual rings were collected at a height of 30 cm from the ground surface of Q.
The age of S.
Analysis on air pollution
Air pollution was analyzed based on SO2, NO2, and O3 concentrations. Recent states of air pollution from 2006 to 2009 were measured with a passive sampler installed in the Q.
Long-term changes in air pollution from 1979 to 2006
were compared based on data from the weather stations of Seoul and Goseong (http://www.airkorea.or.kr) (Ministry of Environment of Korea 1992).
All descriptive statistics were analyzed using Excel 2007 and SigmaPlot 2001 ver. 7.0 (SPSS Inc., Chicago, IL, USA) and were conducted using SPSS ver. 10 ( SPSS Inc., Chicago, IL, USA) for correlation analysis. DCA ordination was conducted using PC-ORD ver. 4.20 (McCune and Mefford 1999).
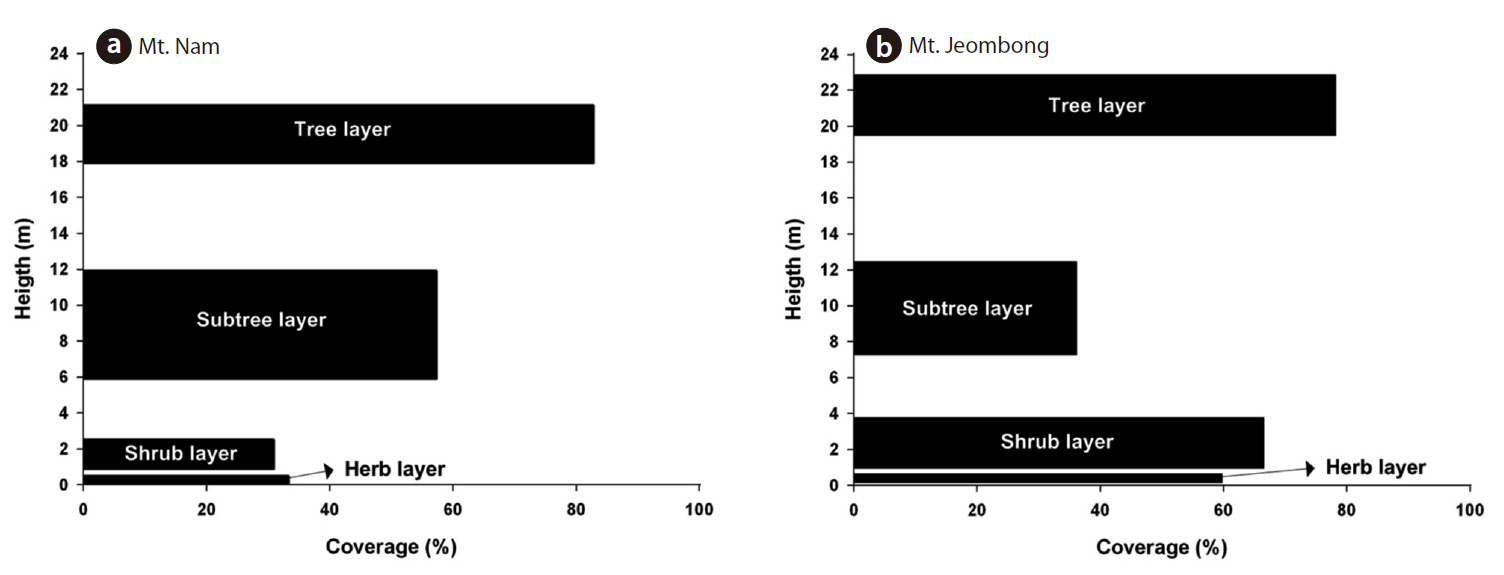
The vegetation stratification of Mt. Nam is composed of four layers of tree (18-21 m), subtree (6-12 m), shrub (1-2.5 m) and herb strata (below 0.5 m) and the coverage of each stratum was shown in 82.8%, 57.3%, 30.9% and 33.3%, respectively (Fig.3 ).
The vegetation stratification of Mt. Jeombong is composed of four layers of tree (19-23 m), subtree (7-12 m), shrub (1-4 m) and herb strata (below 0.6 m) and the coverage of each stratum was shown in 78.2%, 36.2%, 66.6% and 59.8%, respectively (Fig.3 ).
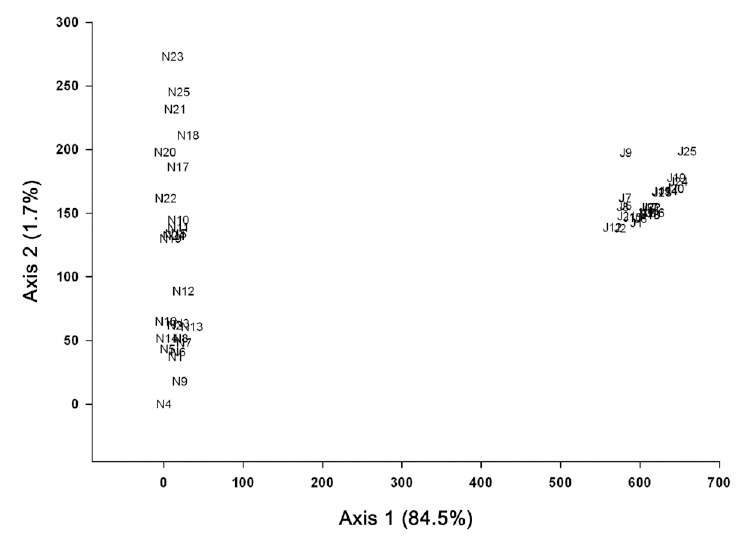
As the results of the DCA ordination based on the vegetation data of Mts. Nam and Jeombong, the total variance was 4.2188, and the eigenvalue of axes 1 and 2 were shown in 0.933 and 0.349, respectively. Species composition tended to show local characteristics, as subplots of Mts. Nam and Jeombong were distributed on the left and right tips. In the subplots of Mt. Nam, which is restricted in the left side on axis 1, Robinia pseudoacacia, S. japonica,
The species composition of subplots of Mt. Jeombong showed a homogeneous pattern, as the subplots were concentrated in a small area. Meanwhile, species composition in Mt. Nam differed widely among subplots, as they were scattered broadly along axis 2. Their distribution was divided depending on aspects, as subplots on the western (N10-11, N14-15, N17-25) and eastern (N1-9, N12-13, N16) slopes were distributed to the upper and the lower parts, respectively (Fig.4 ). Dryopteris chinensis, Forsythia koreana, and Polygonatum odoratum appeared in high frequency in the former subplots and Liriope spicata, D. chinensis, and Viburnum erosum showed high frequency in the latter subplots.
The Shannon-Wiener diversity index (H') of the Q.
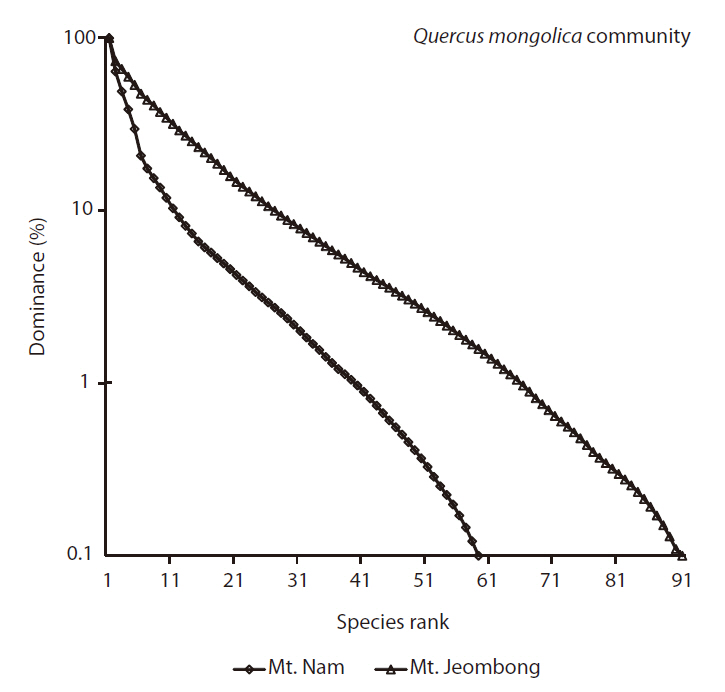
Species rank-dominance curves of both sites reflected such a trend as Mt. Jeombong showed higher richness; the curve was more gentle at the Mt. Jeombong site than at the Mt. Nam site (Fig.5 ).
>
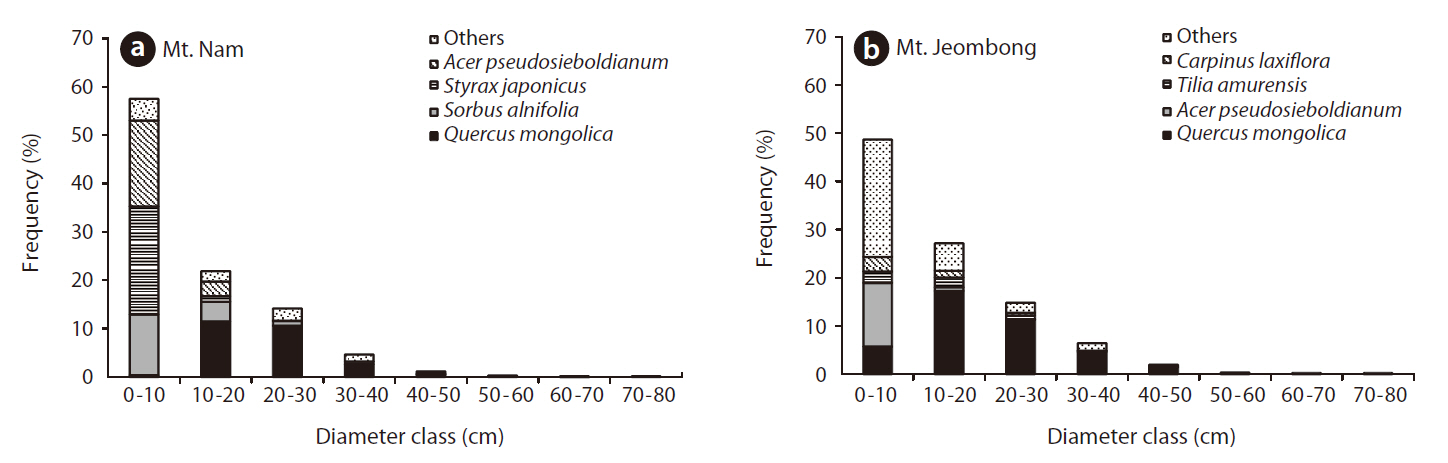
Frequency distribution of diameter classes
In a frequency distribution diagram of major tree species in Mt. Nam, Q.
In the frequency distribution diagram of major tree species in Mt. Jeombong, Q.
>
Vegetation dynamics based on transitional probability model
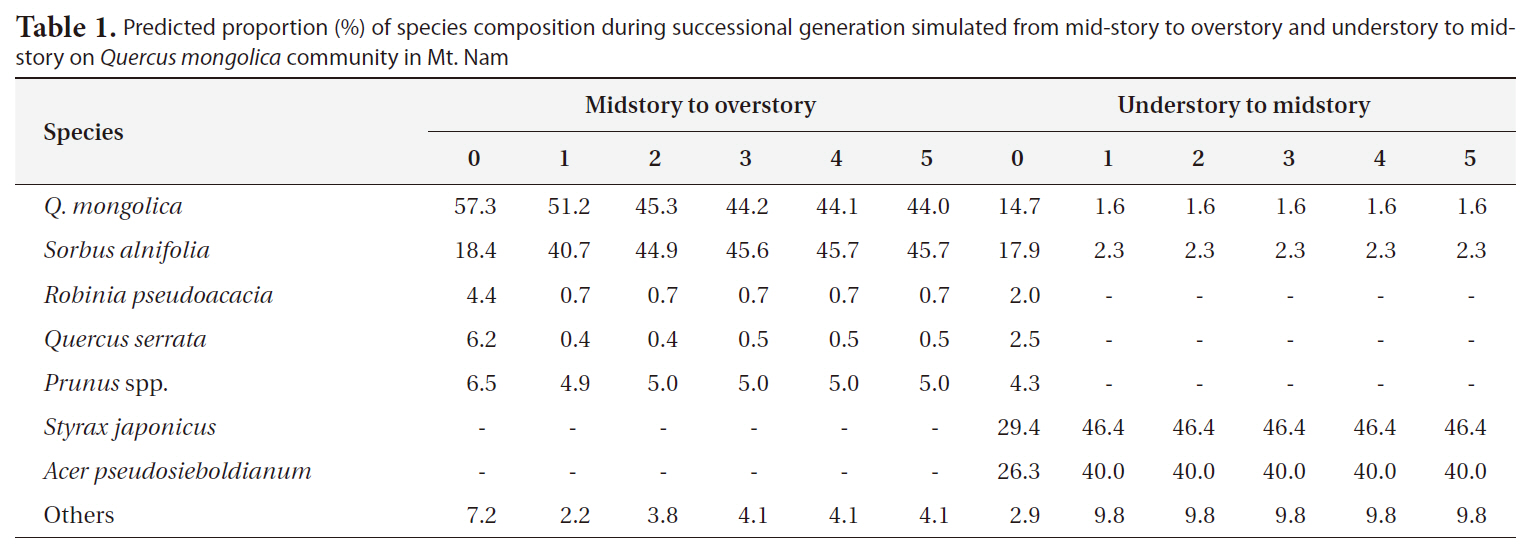
As the result of prediction on successional trends via application of the transitional probability model based on Markov chain theory (Horn 1971, Kim 1993, Ze and ocKim 2005), Q.

Predicted proportion (%) of species composition during successional generation simulated from mid-story to overstory and understory to midstory on Quercus mongolica community in Mt. Nam

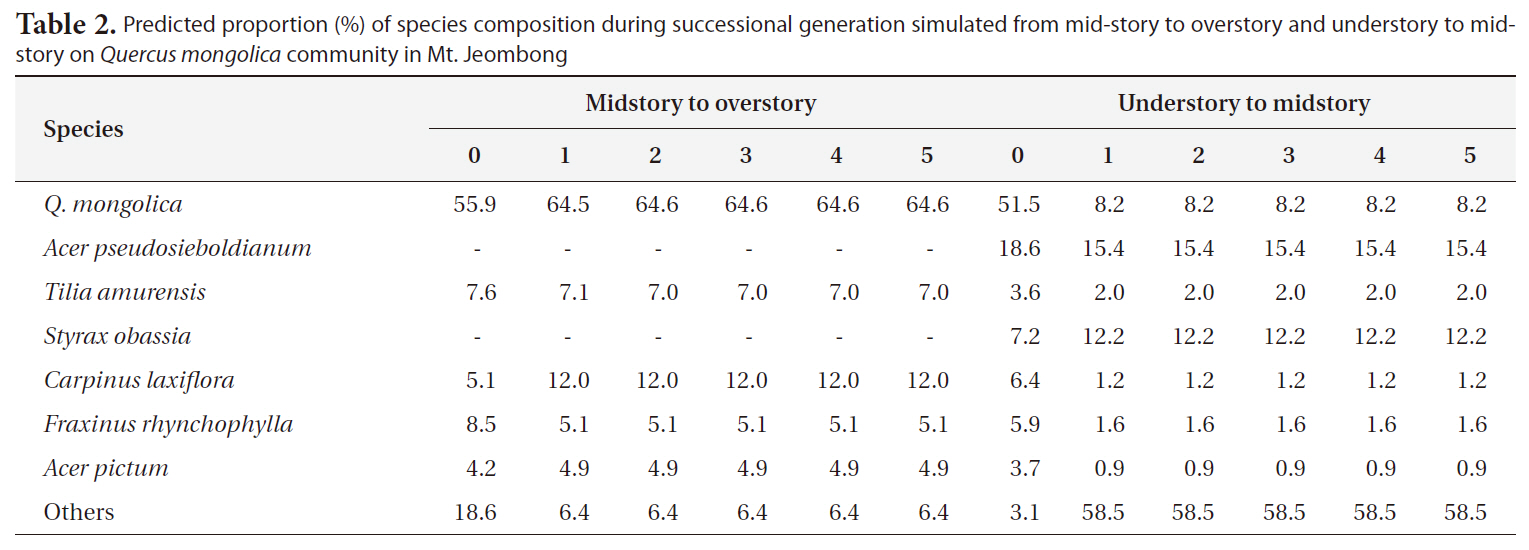
Predicted proportion (%) of species composition during successional generation simulated from mid-story to overstory and understory to midstory on Quercus mongolica community in Mt. Jeombong
occupancy of 18.4% at present, but it was expected that its percentage would increase over generations and thus would become codominant with Q.
cupancy of S. japonica would increase greatly, and would become codominant with Acer pseudosieboldianum.
As the results of prediction of successional trends in Mt. Jeombong via the same procedures, it was predicted that the Q.
>
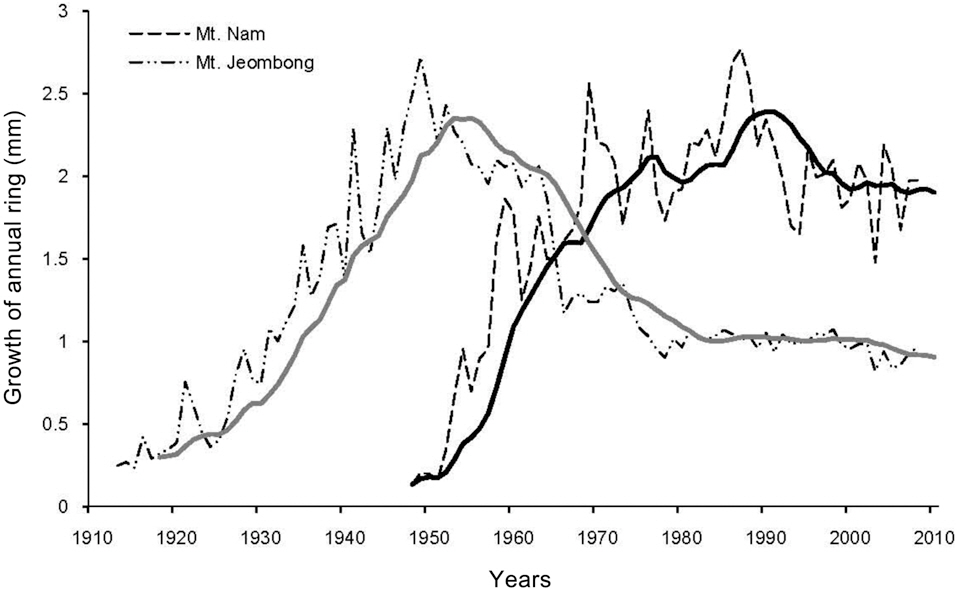
Annual ring growth of Quercus mongolica
The results of analyses on the annual rings of Q.
>
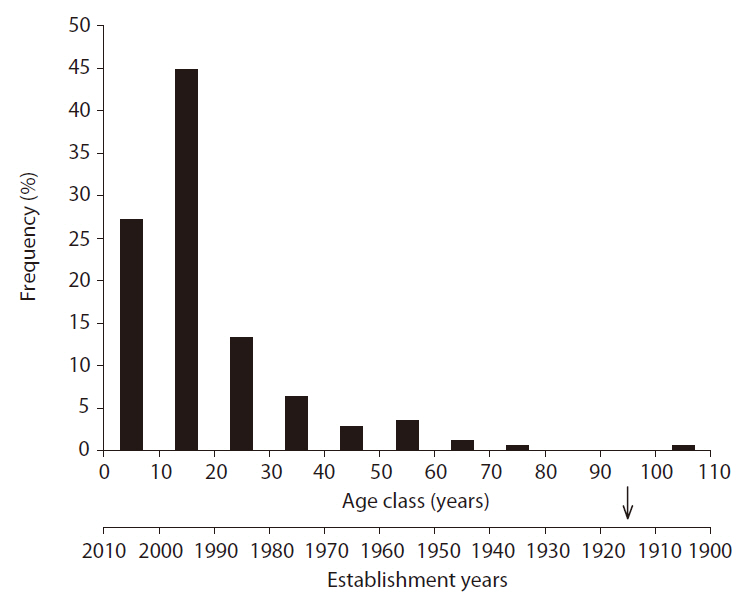
Age distribution of Sorbus alnifolia
In order to clarify the period of appearance of S.
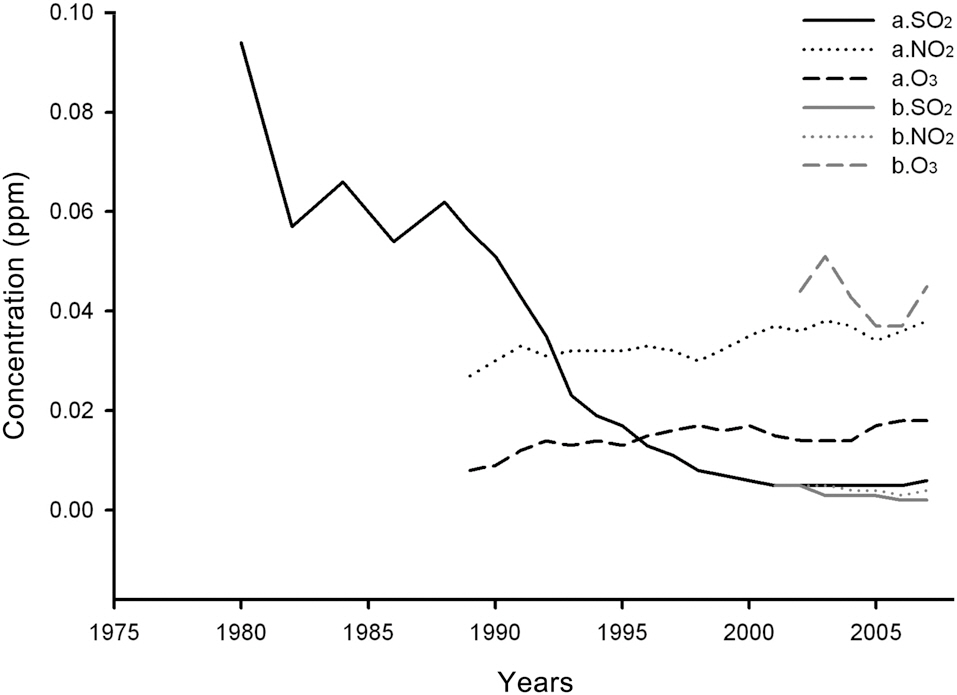
Yearly changes in SO2, NO2, and O3 concentrations measured at Mt. Nam and in the vicinity of Mt. Jeombong from 1980 to 2007 are shown in Fig. 9 (http://www.airkorea.or.kr). In the case of Mt. Nam, SO2 concentrations declined sharply, from 0.094 ppm in 1980 to 0.006 ppm in 2007. Even at the Mt. Jeombong site, the concentration was continuously reduced from 0.005 ppm in 2001 to 0.002 ppm in 2007. In the case of NO2, the concentration increased from 0.027 ppm in 1989 to 0.038 ppm in 2007 on Mt. Nam, whereas it barely changed at the Mt. Jeombong site. O3 concentrations at the Mt. Nam site increased continuously from 0.008 ppm in 1989 to 0.018 ppm in 2007. O3 concentrations at Mt. Jeombong showed periodic fluctuations rather than change. As is shown in the results referenced above, SO2 and NO2 concentrations were higher at the Mt. Nam site than the Mt. Jeombong site, but O3 concentrations showed reversed results.
>
Structural differences in vegetation
The Q.
Differences in the species composition of the Q.
As was shown in the results referenced above, the plant species that dominate specific species composition of Q.
The species diversity of Q.
Mts. Nam and Jeombong also exhibited differing successional trends (Fig.6 ). In particular, the high frequency of shade-intolerant trees such as S.
The age distribution of S.
This retrogressive successional trend exemplified by the case of the Q.
Among SO2, NO2, and O3, SO2 has been measured for the longest time, and also evidences the most obvious changes. The concentration of SO2 at the Mt. Nam site has been greatly reduced since the 1980s, after then it fluctuated and finally settled at approximately 0.002 ppm, which is a very low level. The stable state of SO2 concentration at the Mt. Nam site differs only slightly from the measured levels at the Mt. Jeombong site. According to Roberts (1984) and Fowler (1992), who outlined the criteria for SO2 damage, the previous concentrations probably contributed to a reduction in the growth of the Mongolian oak, which is relatively sensitive (Lee and Bae 1991).
The NO2 concentration at the Mt. Nam site was not high enough to disrupt plant growth; rather, it is likely to have increased growth (Luttermann and Freedman 2000).
Conversely, the SO2 concentrations prior to 1990, which exceeded the environmental standard value of 0.05 ppm, was quite high and almost certainly affected the growth of plants in the area, including Q.
Although the O3 concentrations at the Mt. Nam site were lower than the environment standard values, the concentrations at Mt. Jeombong were more than double the Mt. Nam values. This raises some concerns regarding vegetation damage due to O3 in the future.
Precursors of O3 occurrence, such as NOx (NO + NO2), hydrocarbons, CO, etc. which originate from automobiles, can be eliminated by combination with the precursor, NO. The lower O3 concentration measured at the Mt. Nam site compared with the Mt. Jeombong site may be attributable to this mechanism (Kim and Kwon 2004).