Many industry-produced wastewater contains different types of organic and inorganic pollutants [1]. Generally, the wastewater from printing and dyeing units in a textile plant is rich in color, containing residue of dyes and chemicals [2,3].Moreover, dyes used may be toxic to aquatic organisms and can be resistant to natural biological degradation [4]. Active azo dyes have double bound of nitrogen to nitrogen (-N=N-),which is bounded to an aromatic group [5, 6] so, they can produce harmful health effects and it is essential to have a proper method to remove this dyes from wastewater. As a result, the removal of color from waste effluents has become environmentally important [7-9]. Many researchers use cheap and ecofriendly adsorbents to substitute the more expensive,commercially available activated carbons. Such alternatives include: biosorbents, natural materials, agricultural waste and industrial by products [10-12]. Adsorption of organic pollutants onto solid/water interfaces has been found to be an efficient and economically cheap method compared to the other purification and separation methods [13]. This paper reports on the ability of Activated Carbon from Walnut shell(ACW) to remove Reactive Yellow 15 (RY15) and Reactive Black 5 (RB5) from aqueous solutions. The effect of pH,initial dye concentrations, temperature, kinetics and dose of ACW were investigated. The Langmuir, Freundlich, Temkin and Dubinin-Radushkevich (D-R) were used to fit the equilibrium data. Pseudo first-order and pseudo second-order kinetic models were attempted.
The walnut shell was obtained from local natural resources. After obtained, fresh walnut shells were washed several times with distilled water to remove surface impurities and then dried at room temperature for one day. The samples were heated and burned and the charcoals were crushed by grinder and then ground to pass through a 100-mesh sieve for further experiments. It was activated to a final temperature of 500oC in muffle furnace for six hours. Some physical and chemical properties of walnut shell were showed in Table 1.This was performed by he adsorption of N2 at 77 K using Micrometrics Surface Area Analyzer (ASAP 2010, Micromerities Inc., USA).
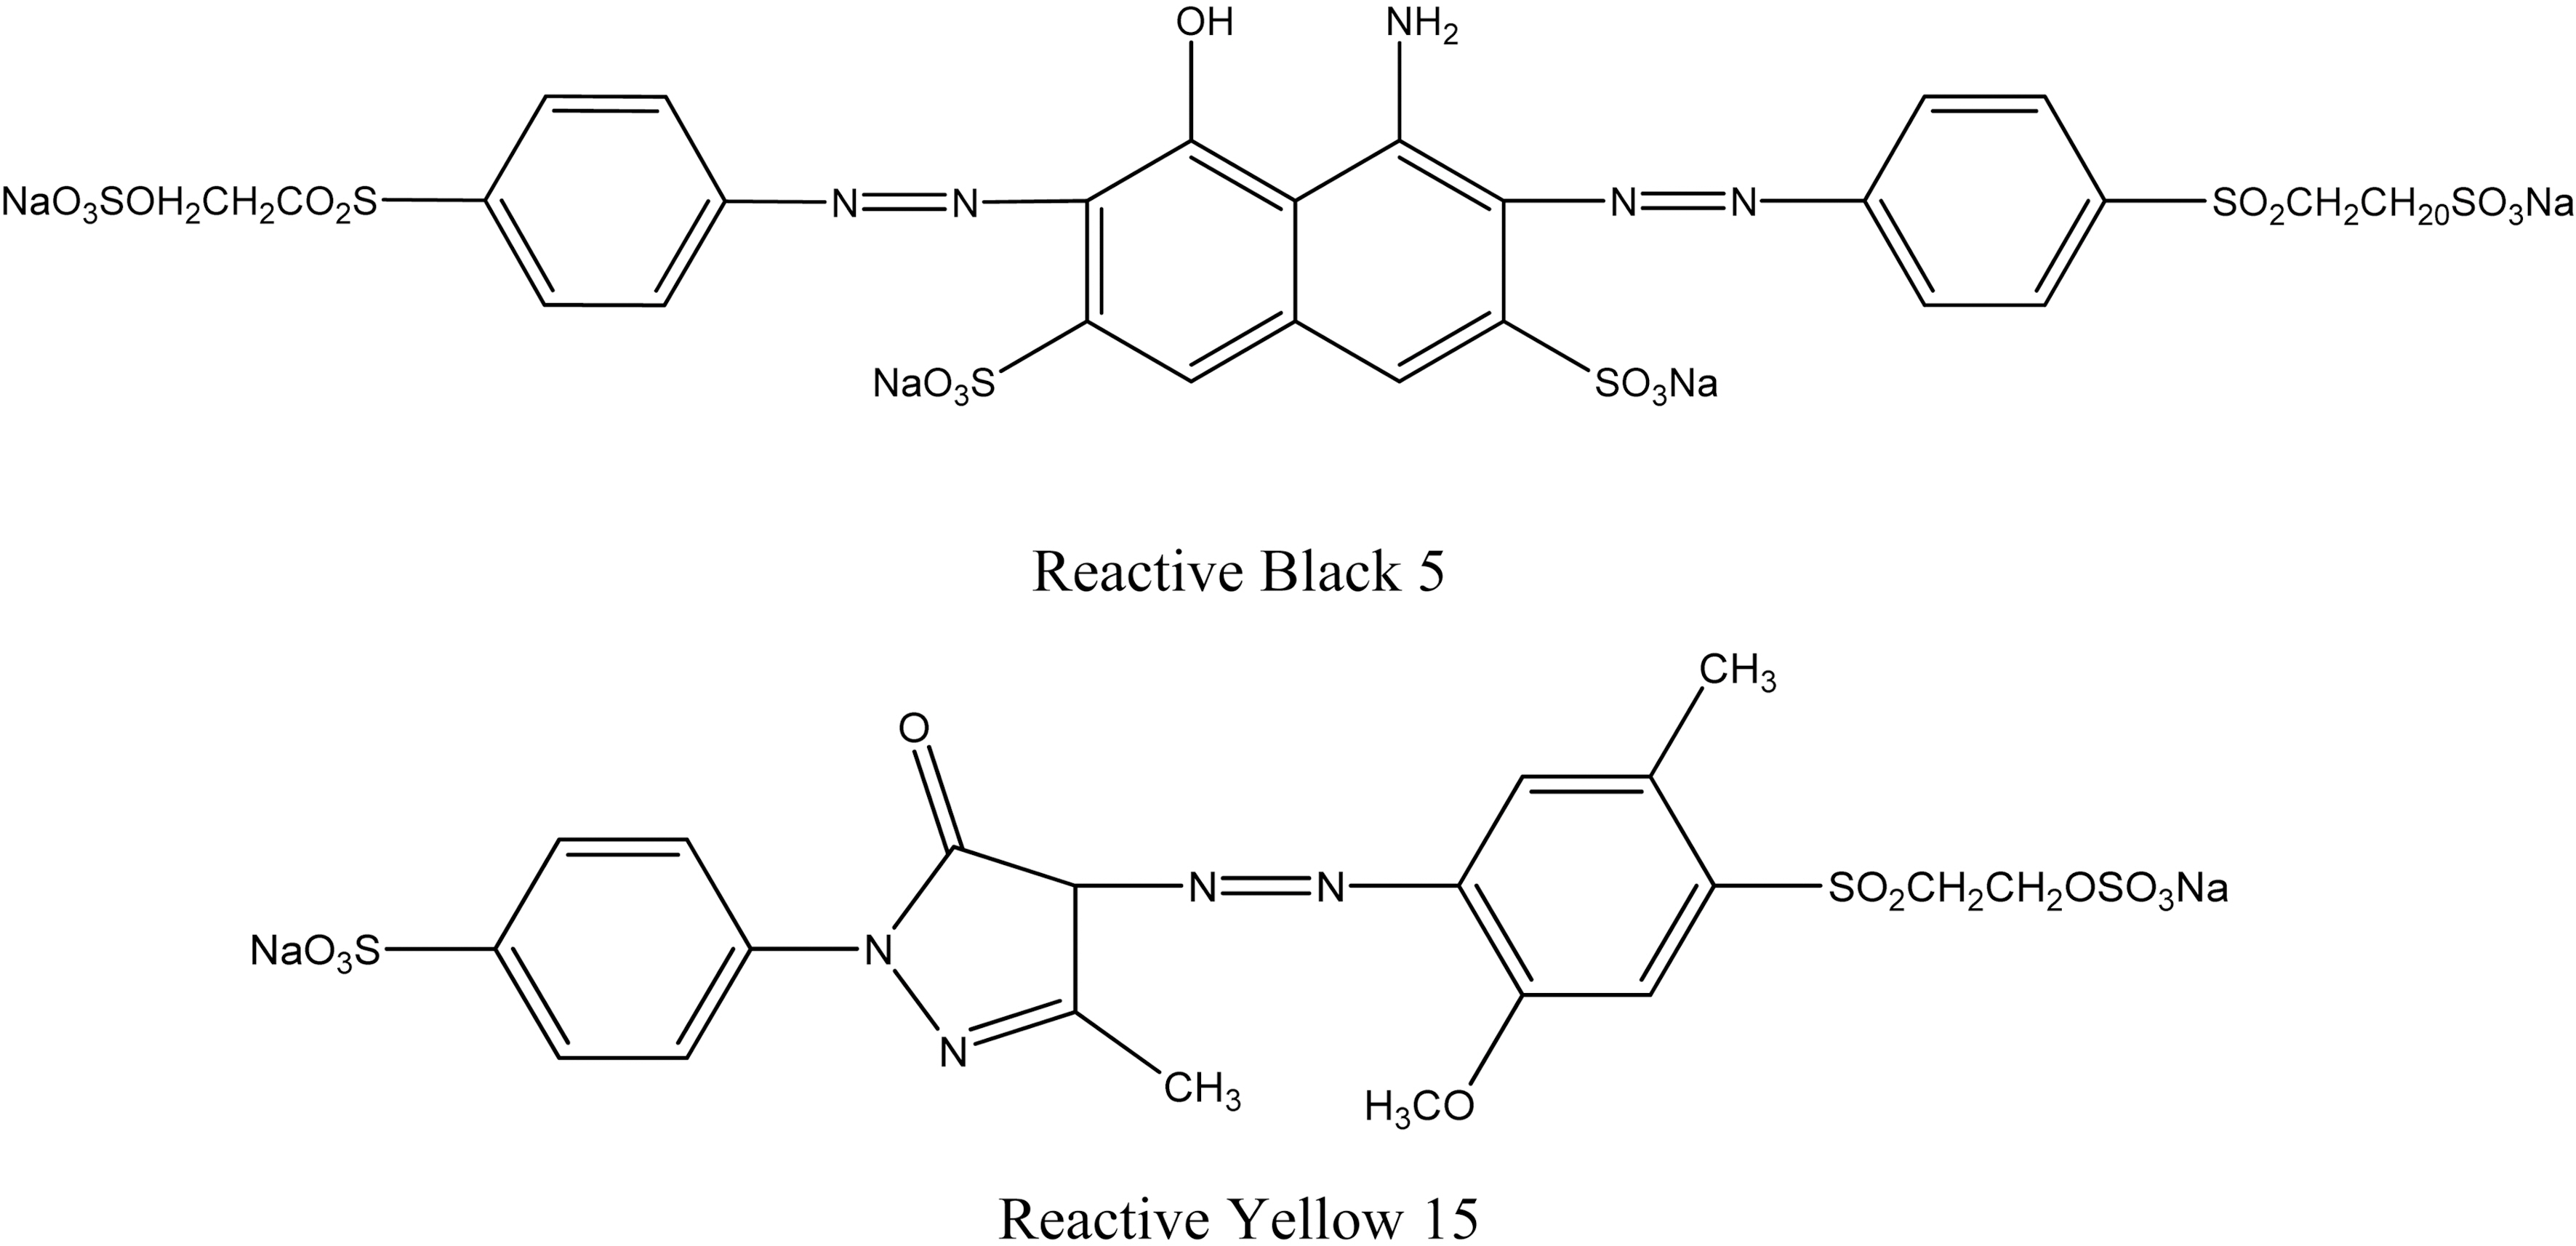
RY15 (Reactive Yellow 15, C.I. 11859; chemical formula,C48 H40 N13 Na O13 S3; Mw, 1172.13 g/mol) and RB5 (Reactive
[Table 1.] Physicochemical Properties of ACW
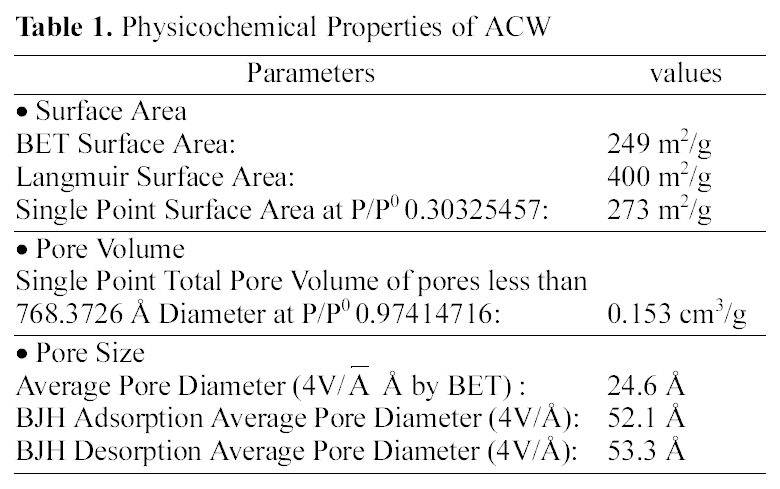
Physicochemical Properties of ACW
Black 5, C.I. 20505; chemical formula, C26H21N5Na4O18S6;Mw, 975.82 g/mol) were used as the adsorbates in this study.They were all prepared from Alvan Saabet Company in Iran and used without any further purification. The chemical structures of RY15 and RB5, shown in Fig. 1. They have a maximum visible adsorbance at wavelenghs of 415 nm for RY15 and 598 nm for RB5.
Adsorption of RY15 and RB5 were carried out by a batch technique in aqueous solutions and experiments were conducted to observe the effect of various parameters effect of pH, temperature, amount of adsorbent, initial dye concentrations and kinetics. Adsorption experiments were carried out at various concentrations of dye solutions in the range of 1 × 10⁻⁵ to 5.5×10⁻⁵ M by adding a fixed amount of ACW (1 g) to a series of 100 mL conical flasks. The conical
flasks were then placed in room temperature for 48 h and then filtered. The final concentrations of dyes were measured at maximum wavelengths of RY15 and RB5 using a single beam UV-Vis spectrophotometer (Shimadzu, UV1101, Japan). The amount of dye adsorbed onto the adsorbent, qe(mol/g), was calculated by equation:
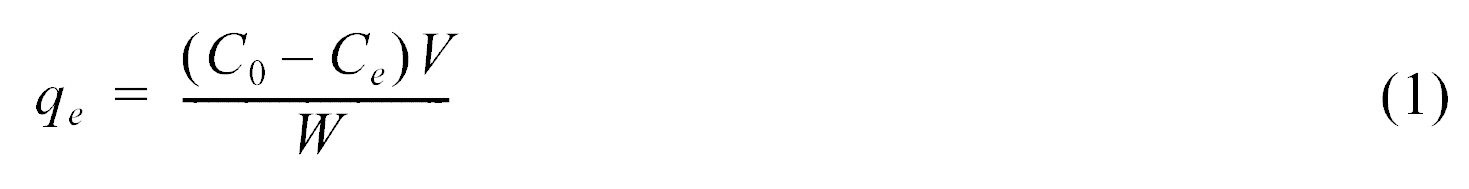
where C0 and Ce (mol/L) are the initial and equilibrium state dye concentrations, respectively. V is the volume of the solution (L) and W is the mass of adsorbent used (g).
The effect of ACW dose on the amount of RY15 and RB5 adsorbed were studied by adding different amounts (0.2, 0.4,0.6, 0.8, 1, 1.2, 1.4 and 1.6 g) of ACW into amount of 100 mL conical flasks containing a definite volume of fixed initial concentration (3.5×10⁻⁵ M) of dye solutions. The flasks were placed in room temperature for 48 h and then dye concentrations were measured at equilibrium. The dye removal percentage was calculated using the following relationship:

where Ci and Cf (mol/L) are the liquid-phase concentrations of dye at initial and equilibrium, respectively.
To study the effect of pH was studied by adjusting the pH of dye solutions using 1 M H2SO4 and 1 M NaOH solutions.The pH was measured using a pH meter (PB-11).Experiments were carried out using different initial solution pH values from 1 to 11.
To study the effect of temperature, 1 g sample of ACW was added to each 100 mL volumes of RY15 and RB5 aqueous solutions at different initial concentrations. The
experiments were carried out at 303 to 333 K. Temperature control was provided by the water bath shaker units.
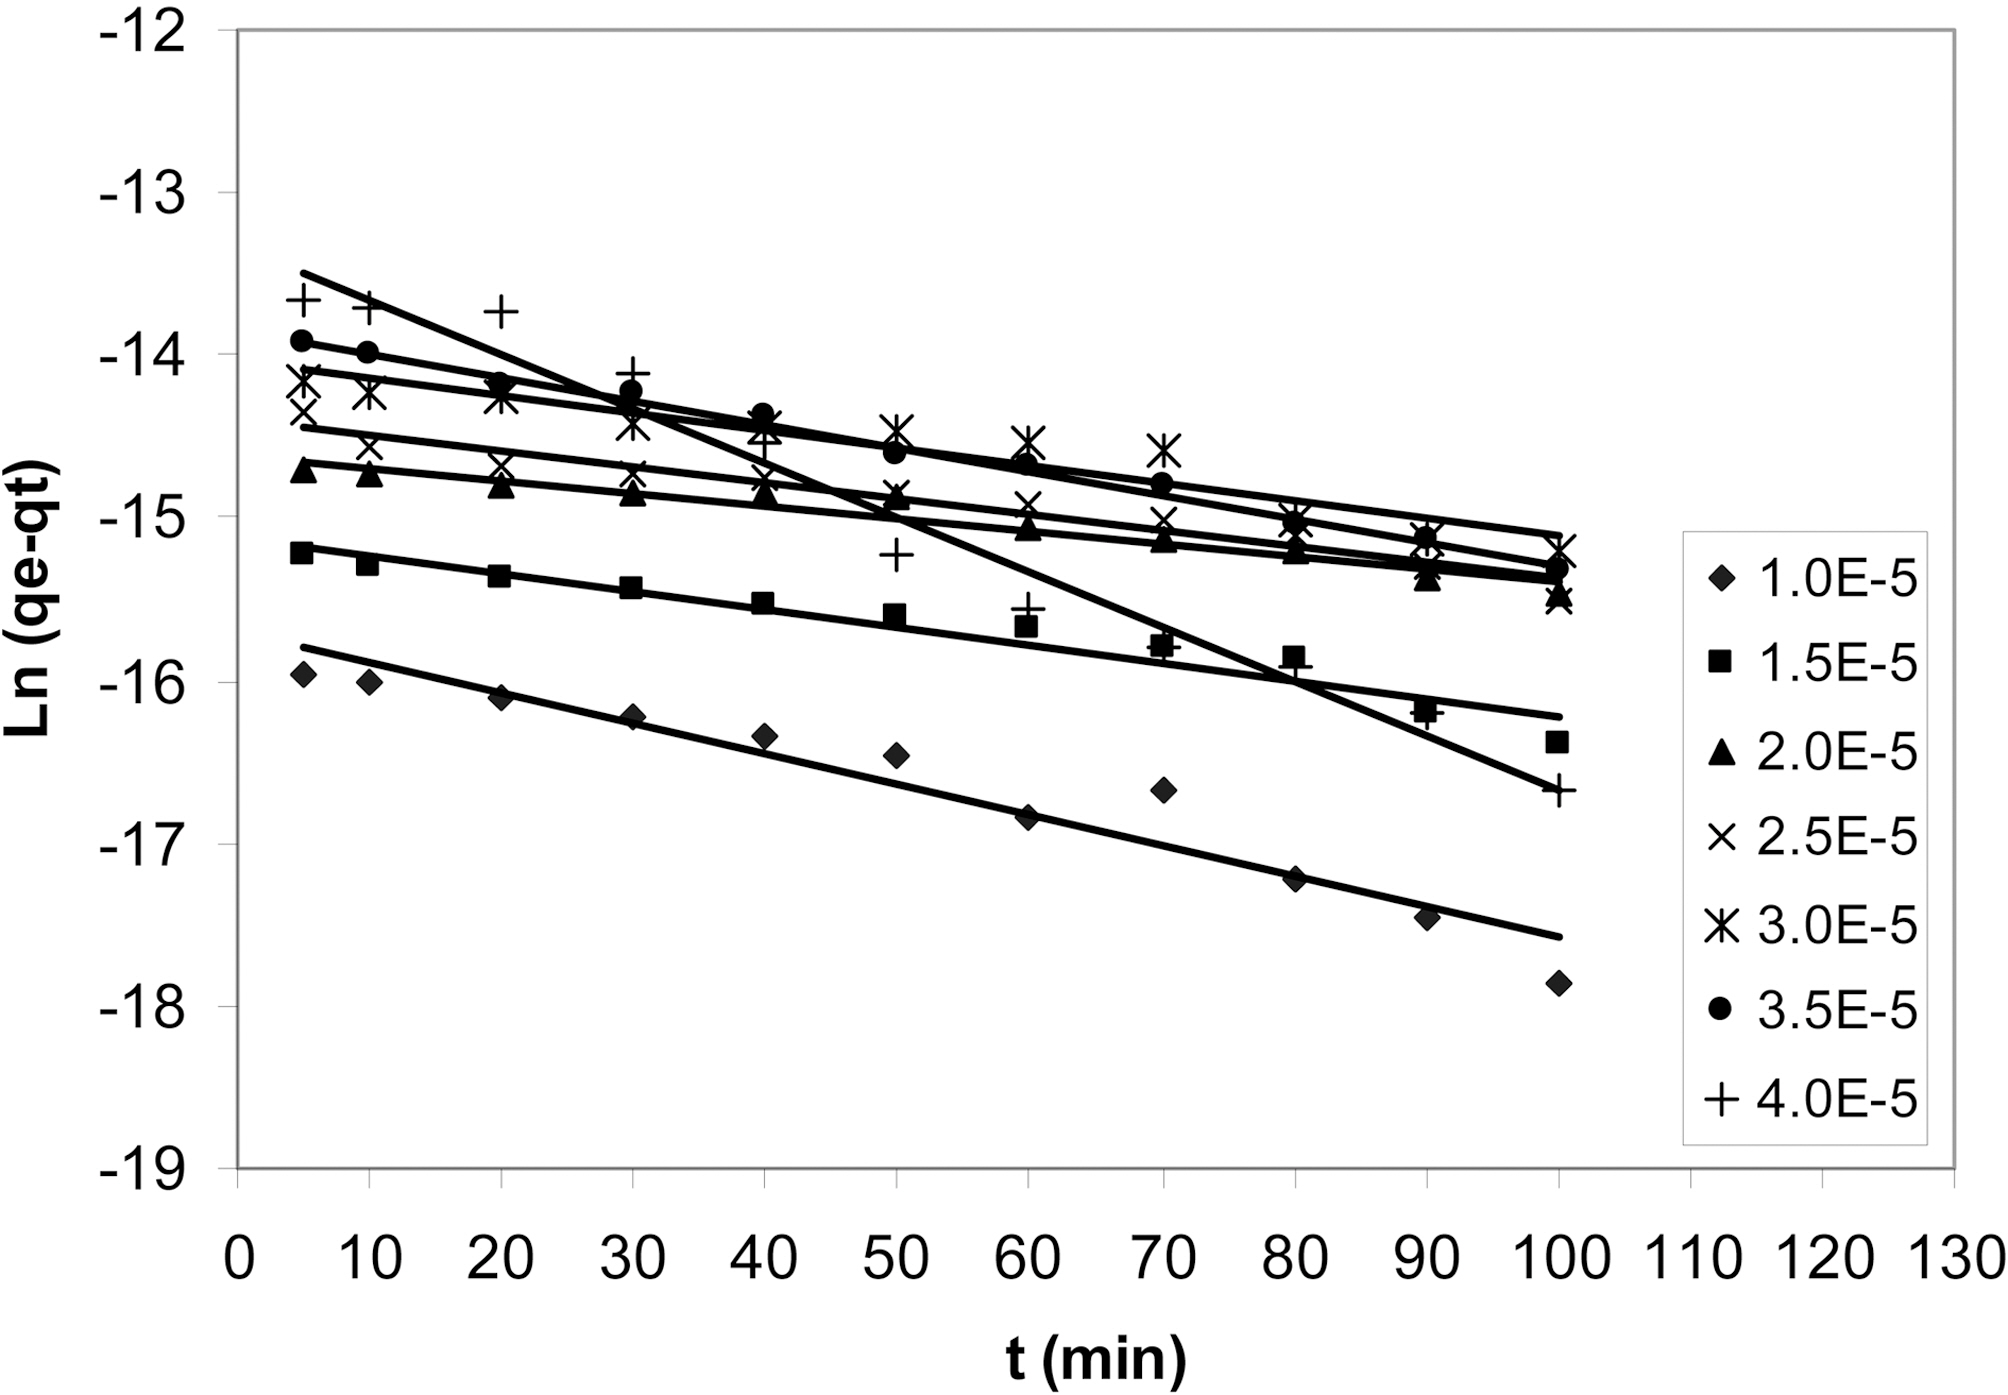
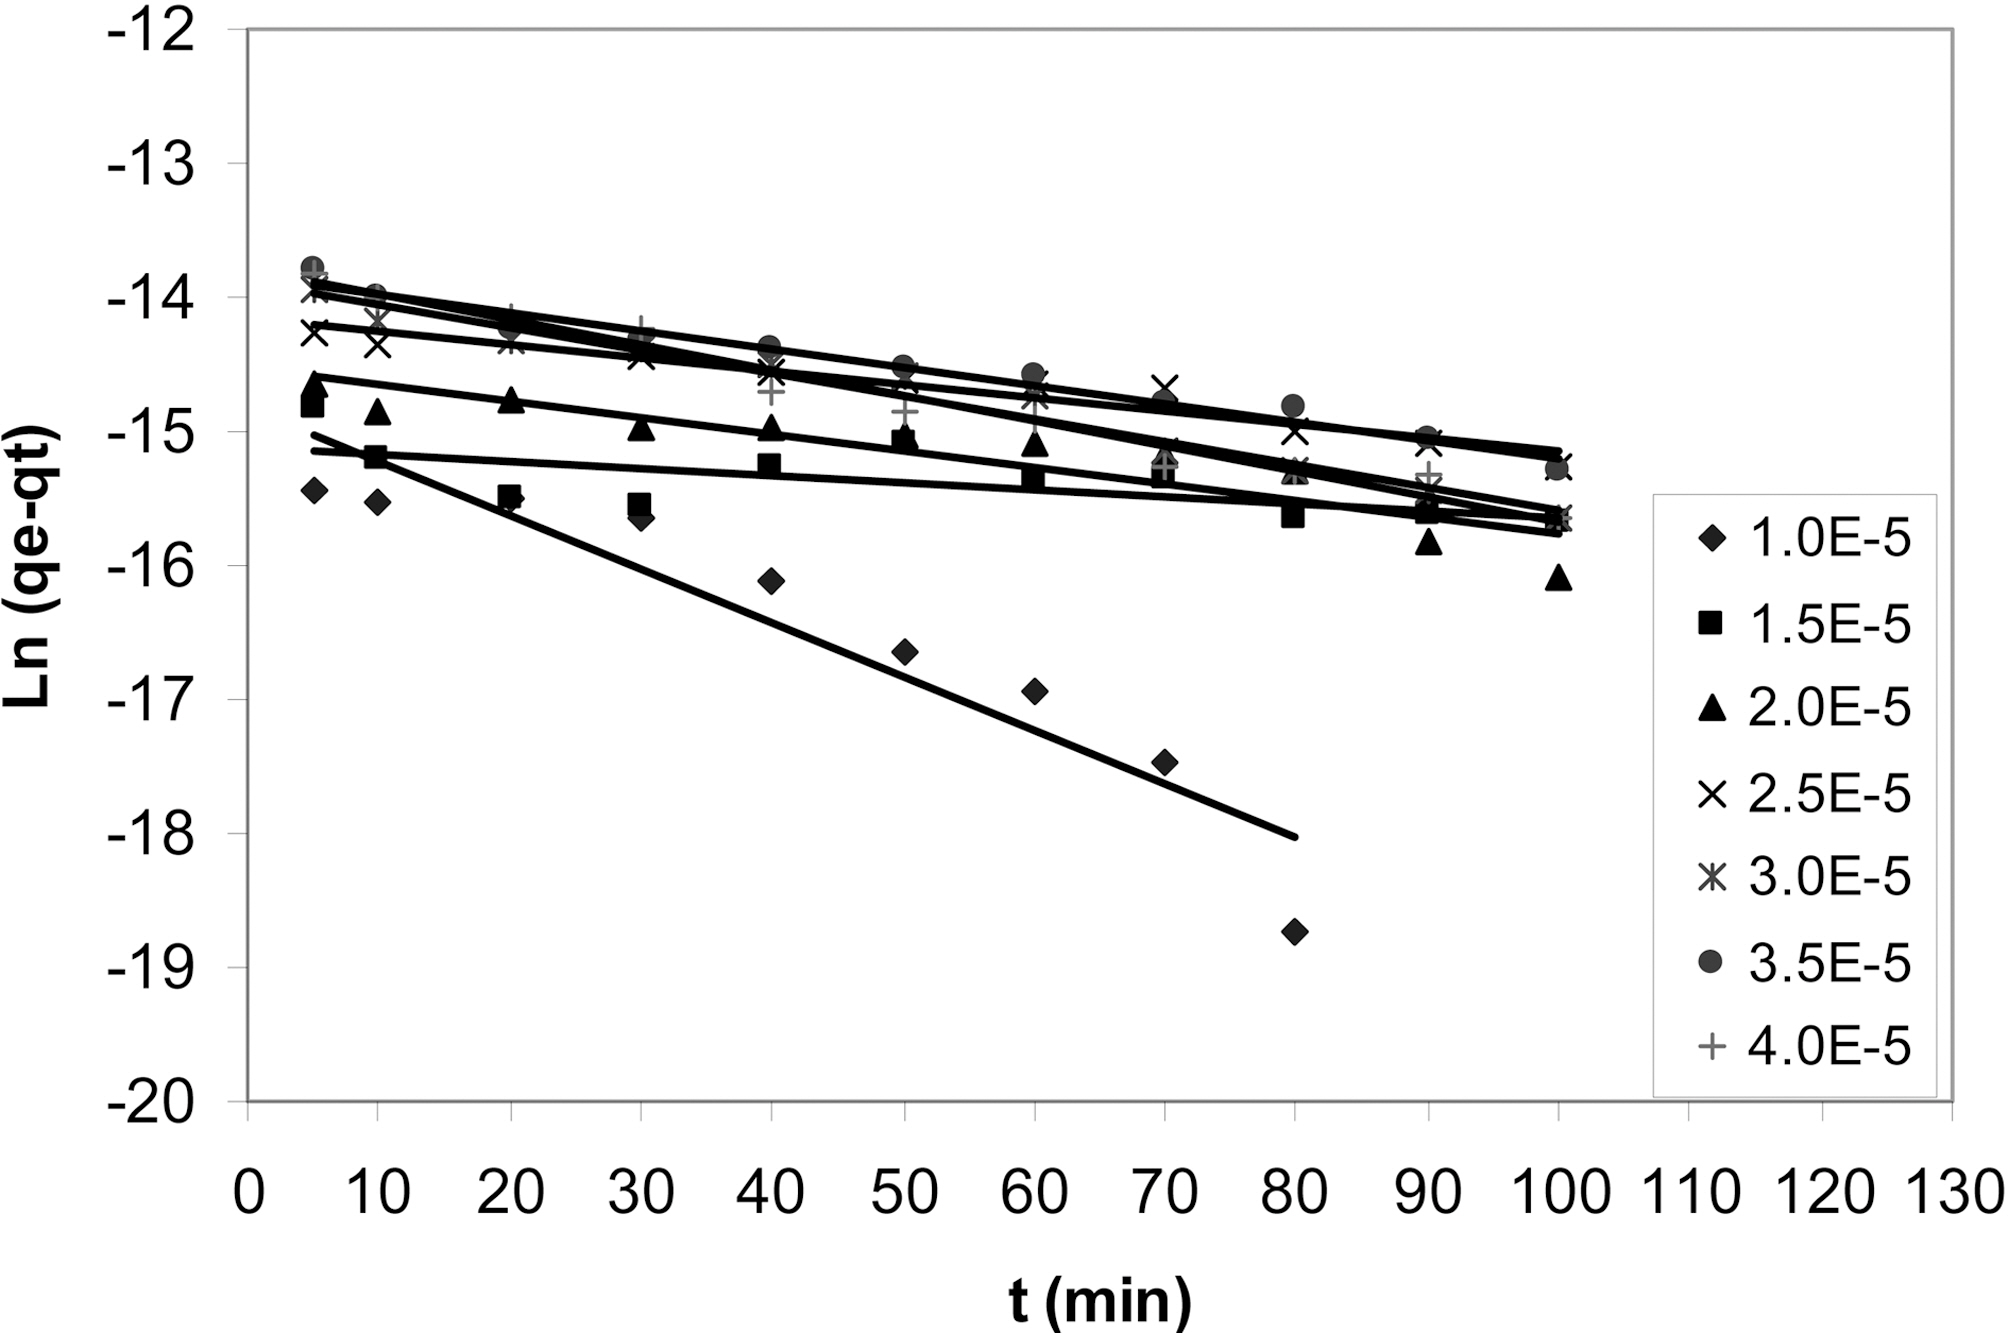
The kinetic studies were carried out using a mechanical stirrer. The adsorbance of all samples were determined at certain time intervals (5, 10, 20, 30, 40, 50, 60, 70, 80, 90 and 100 min) during the adsorption process. The amount of adsorption at time t, qt (mol/g) was calculated by:
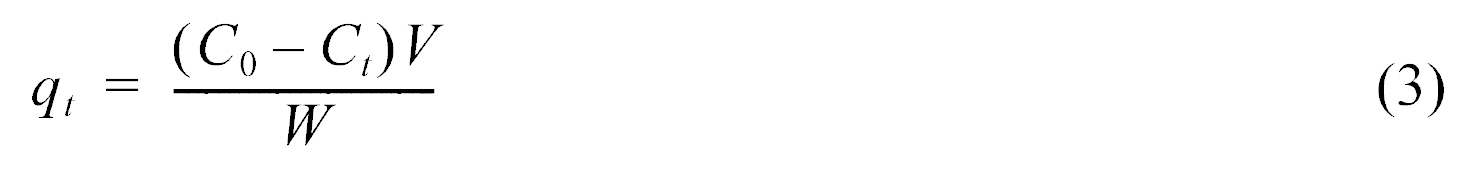
where Ct (mol/L) is the liquid-phase concentration of dye at any time.
3.1. Characterization of the prepared ACW
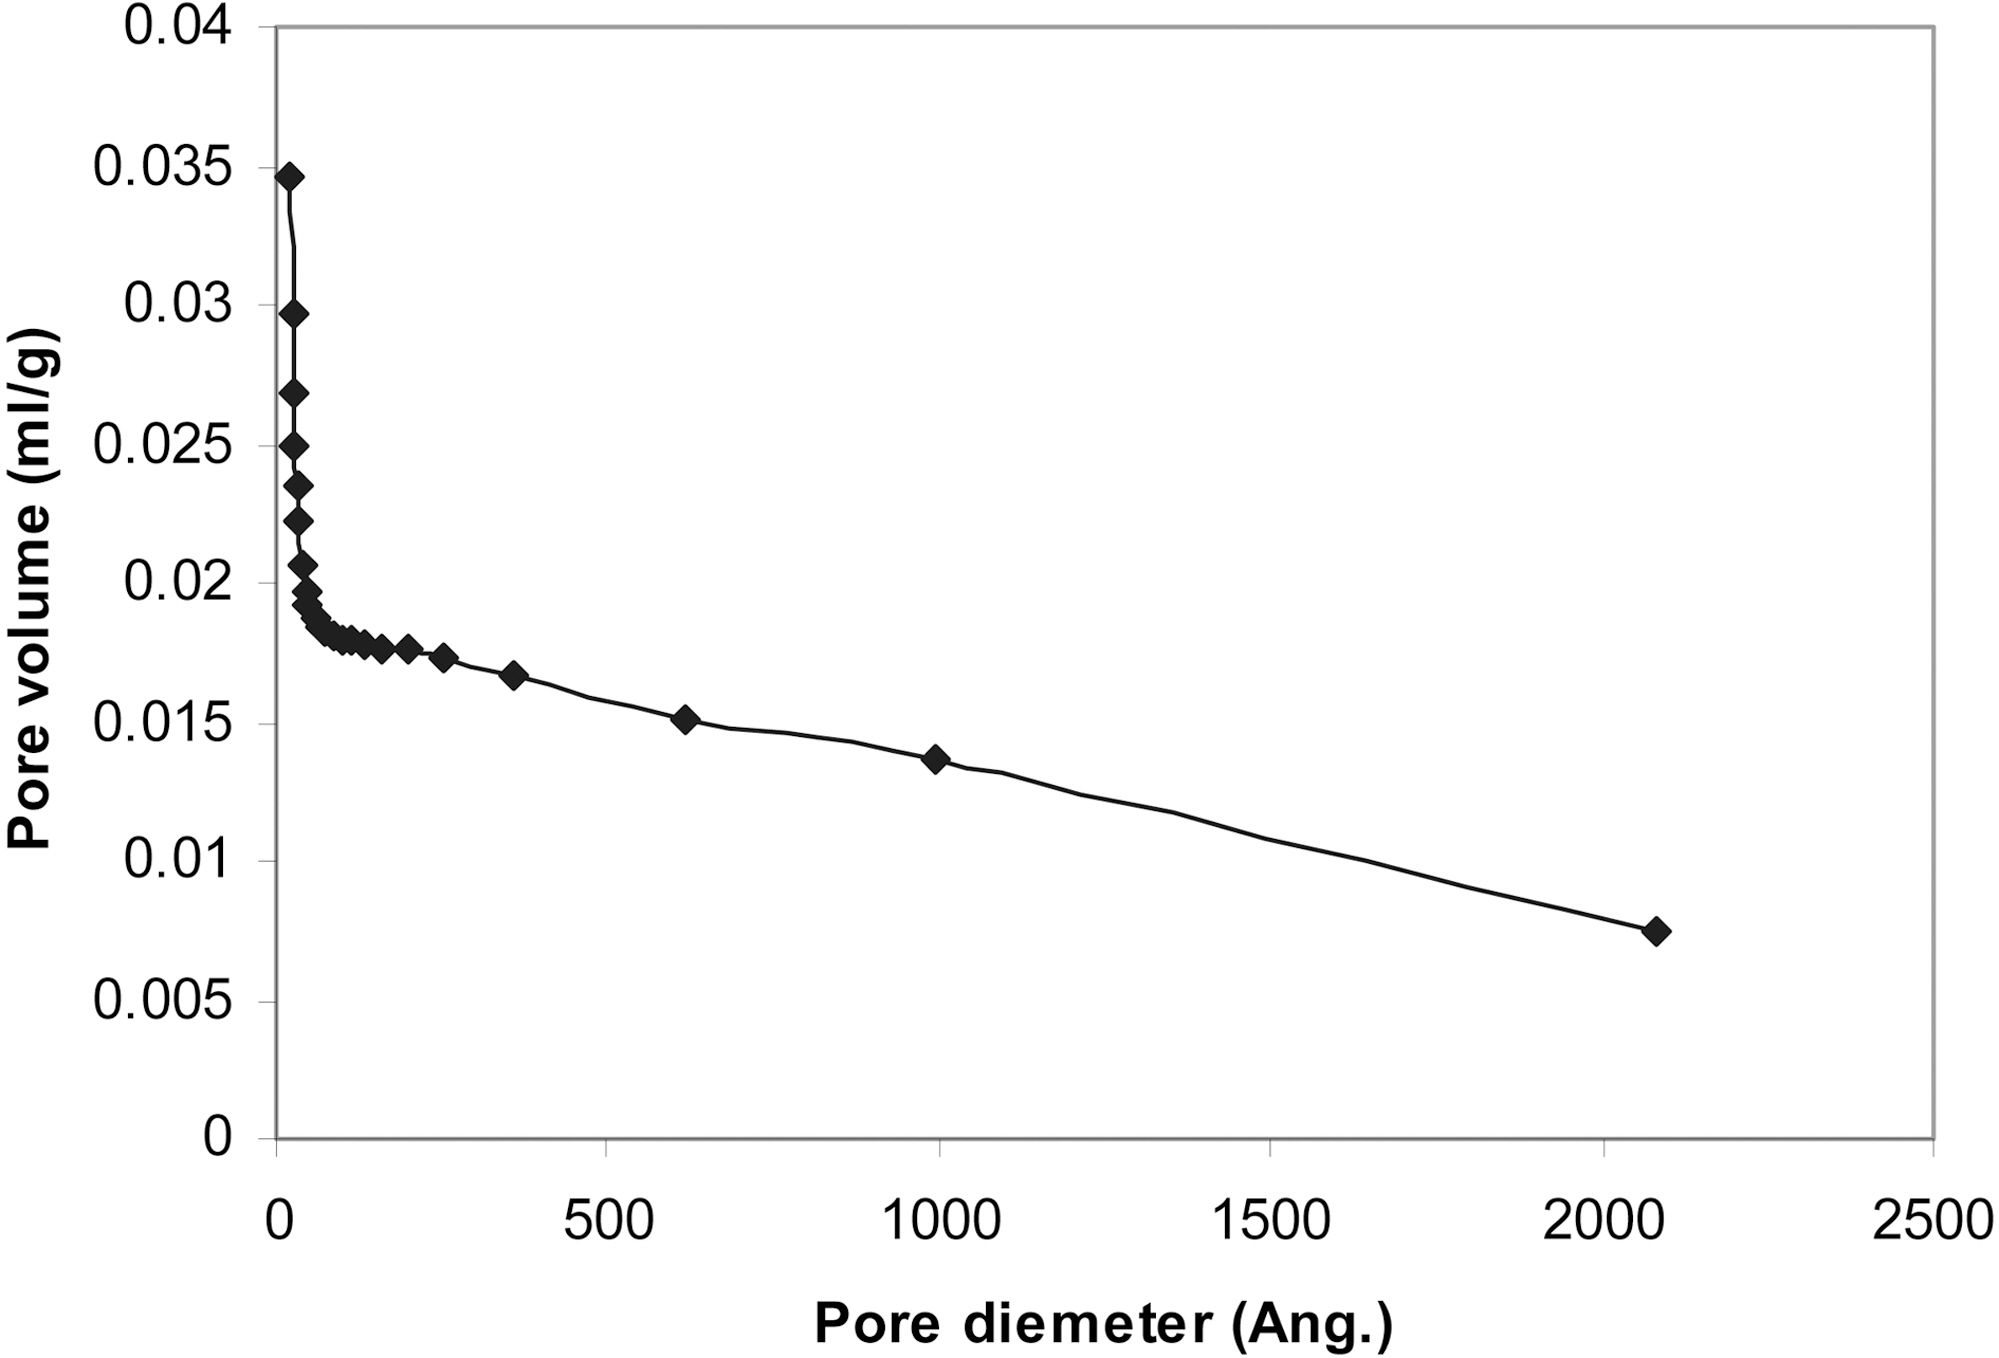
The pores in activated carbons are divided into three groups:the micropores with diameters less than 2 nm, mesopores with diameters between 2 and 50 nm, and macropores with diameters greater than 50 nm [14]. According to Table 1, the BJH results show that the pores are distributed on the ACW surface as follows: 13.64% (micropores), 77.77% (mesopores)and 8.59% (macropores). The BET surface area of the prepared ACW is 248.99 m2/g with a total pore volume of 0.153 cm3/g. Fig. 2 shows cumulative pore volume (cm3/g)vs. pore diameter (A). Interestingly, it becomes obvious from this figure that the pore volumes decrease as the pore diameters increase.
3.2. Effect of adsorbent dose on dyes adsorption
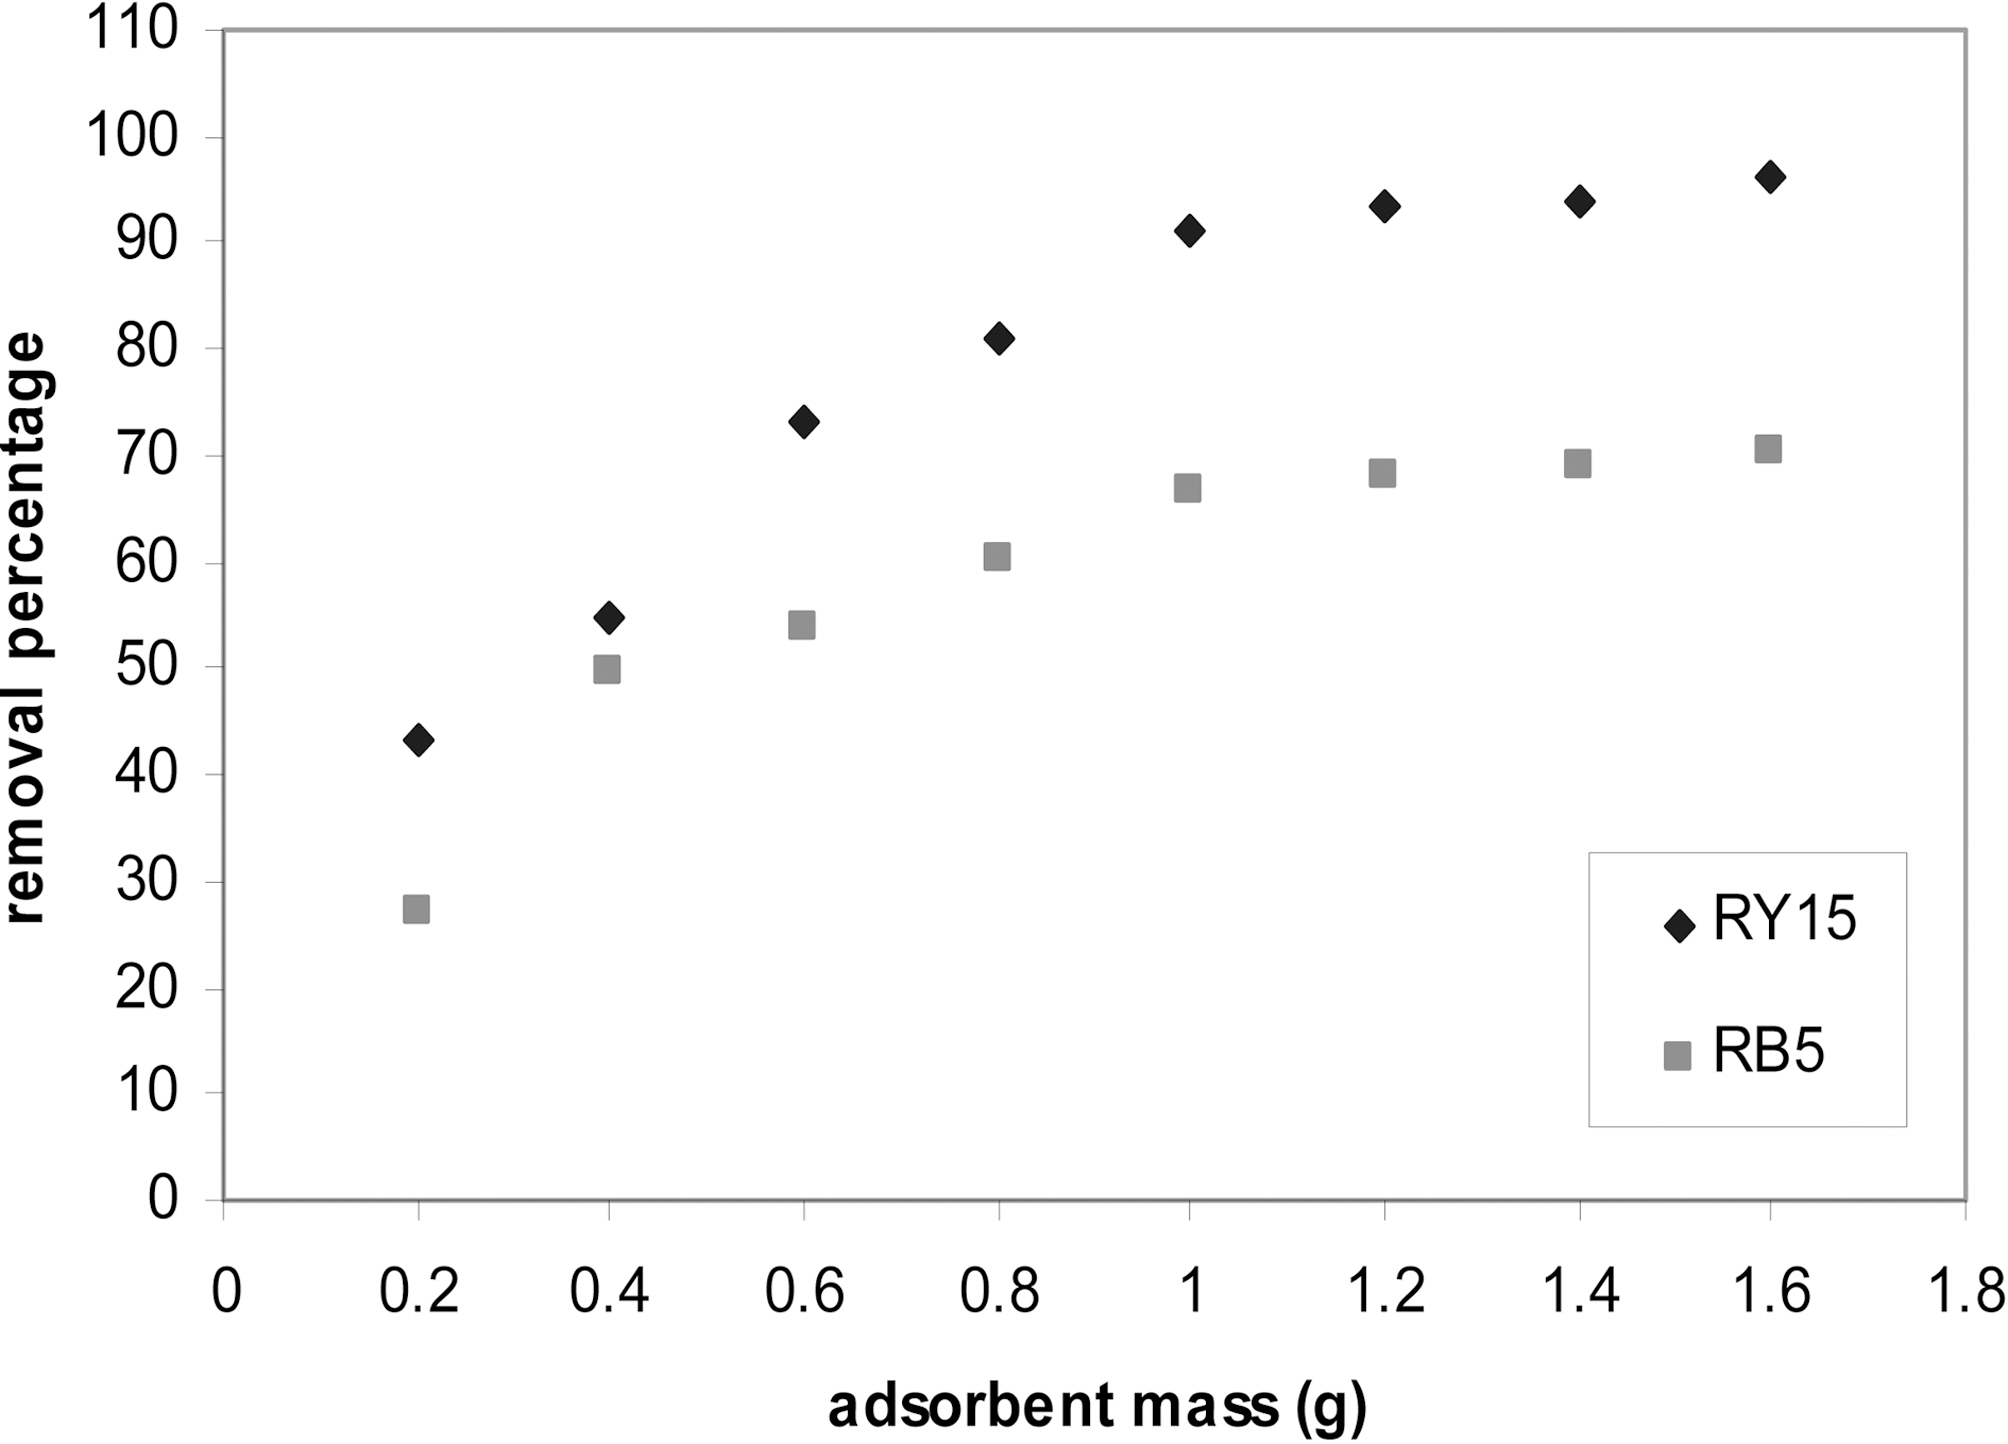
To optimize the adsorbent dose for the removal of RY15 and RB5 from aqueous solutions, adsorption was carried out with different adsorbent dosage at room temperature. Fig. 3 shows the effect of ACW dose on the removal percentage of
RY15 and RB5. It was observed that the removal of RY15 and RB5 increase up to 1 g and then it remain almost constant. The increases in colors removal percentage were duo to the increases of the available sorption surface and availability of more adsorption sites. A similar behaviour was reported for the adsorption of methylene blue on peanut hull [15].
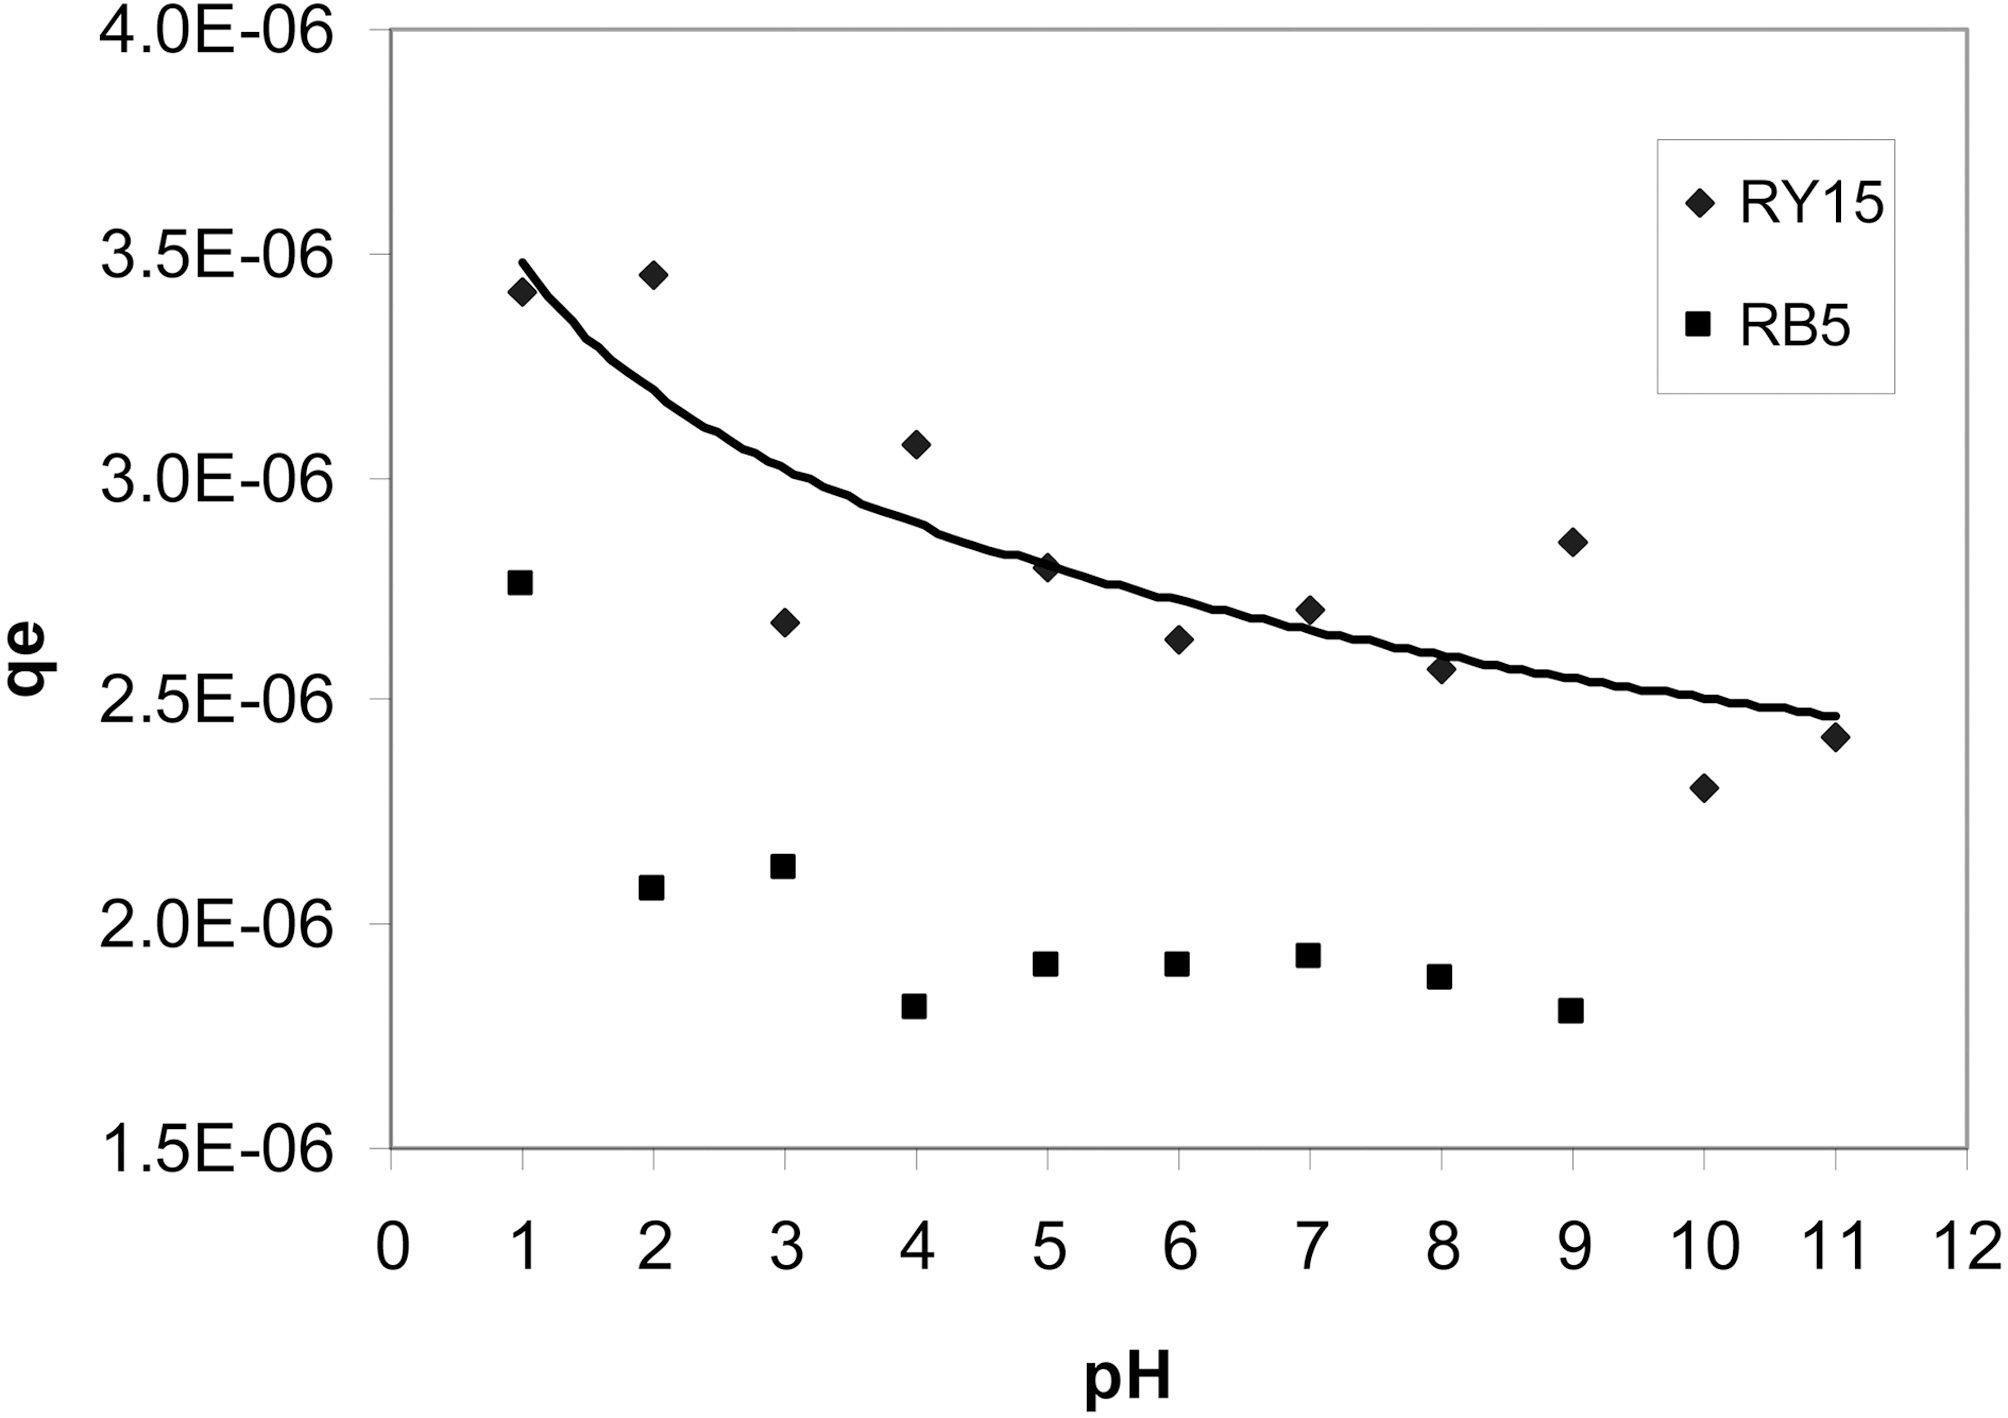
The influence of pH on adsorption of the two dyes is shown in Fig. 4 and the maximum removal was achieved at pH 1. In acidic condition, the positive charge dominates the surface of the adsorbent. Thus a significantly high electrostatic attraction exists between the positively charged surface of the adsorbent and negatively charged dye species. This attractive force increases the adsorption chances of dye species onto the surface of the adsorbent. The lower pH
negatively charged surface site on the adsorbent did not favour the adsorption of RY15 due to electrostatic repulsion but, adsorption of RB5 shows the percent removal remained constant in pH=9-5. A similar result was observed for the adsorption of acid red 14 by soy meal hull [16] and removal of acid dyes using a biosorbent [17].
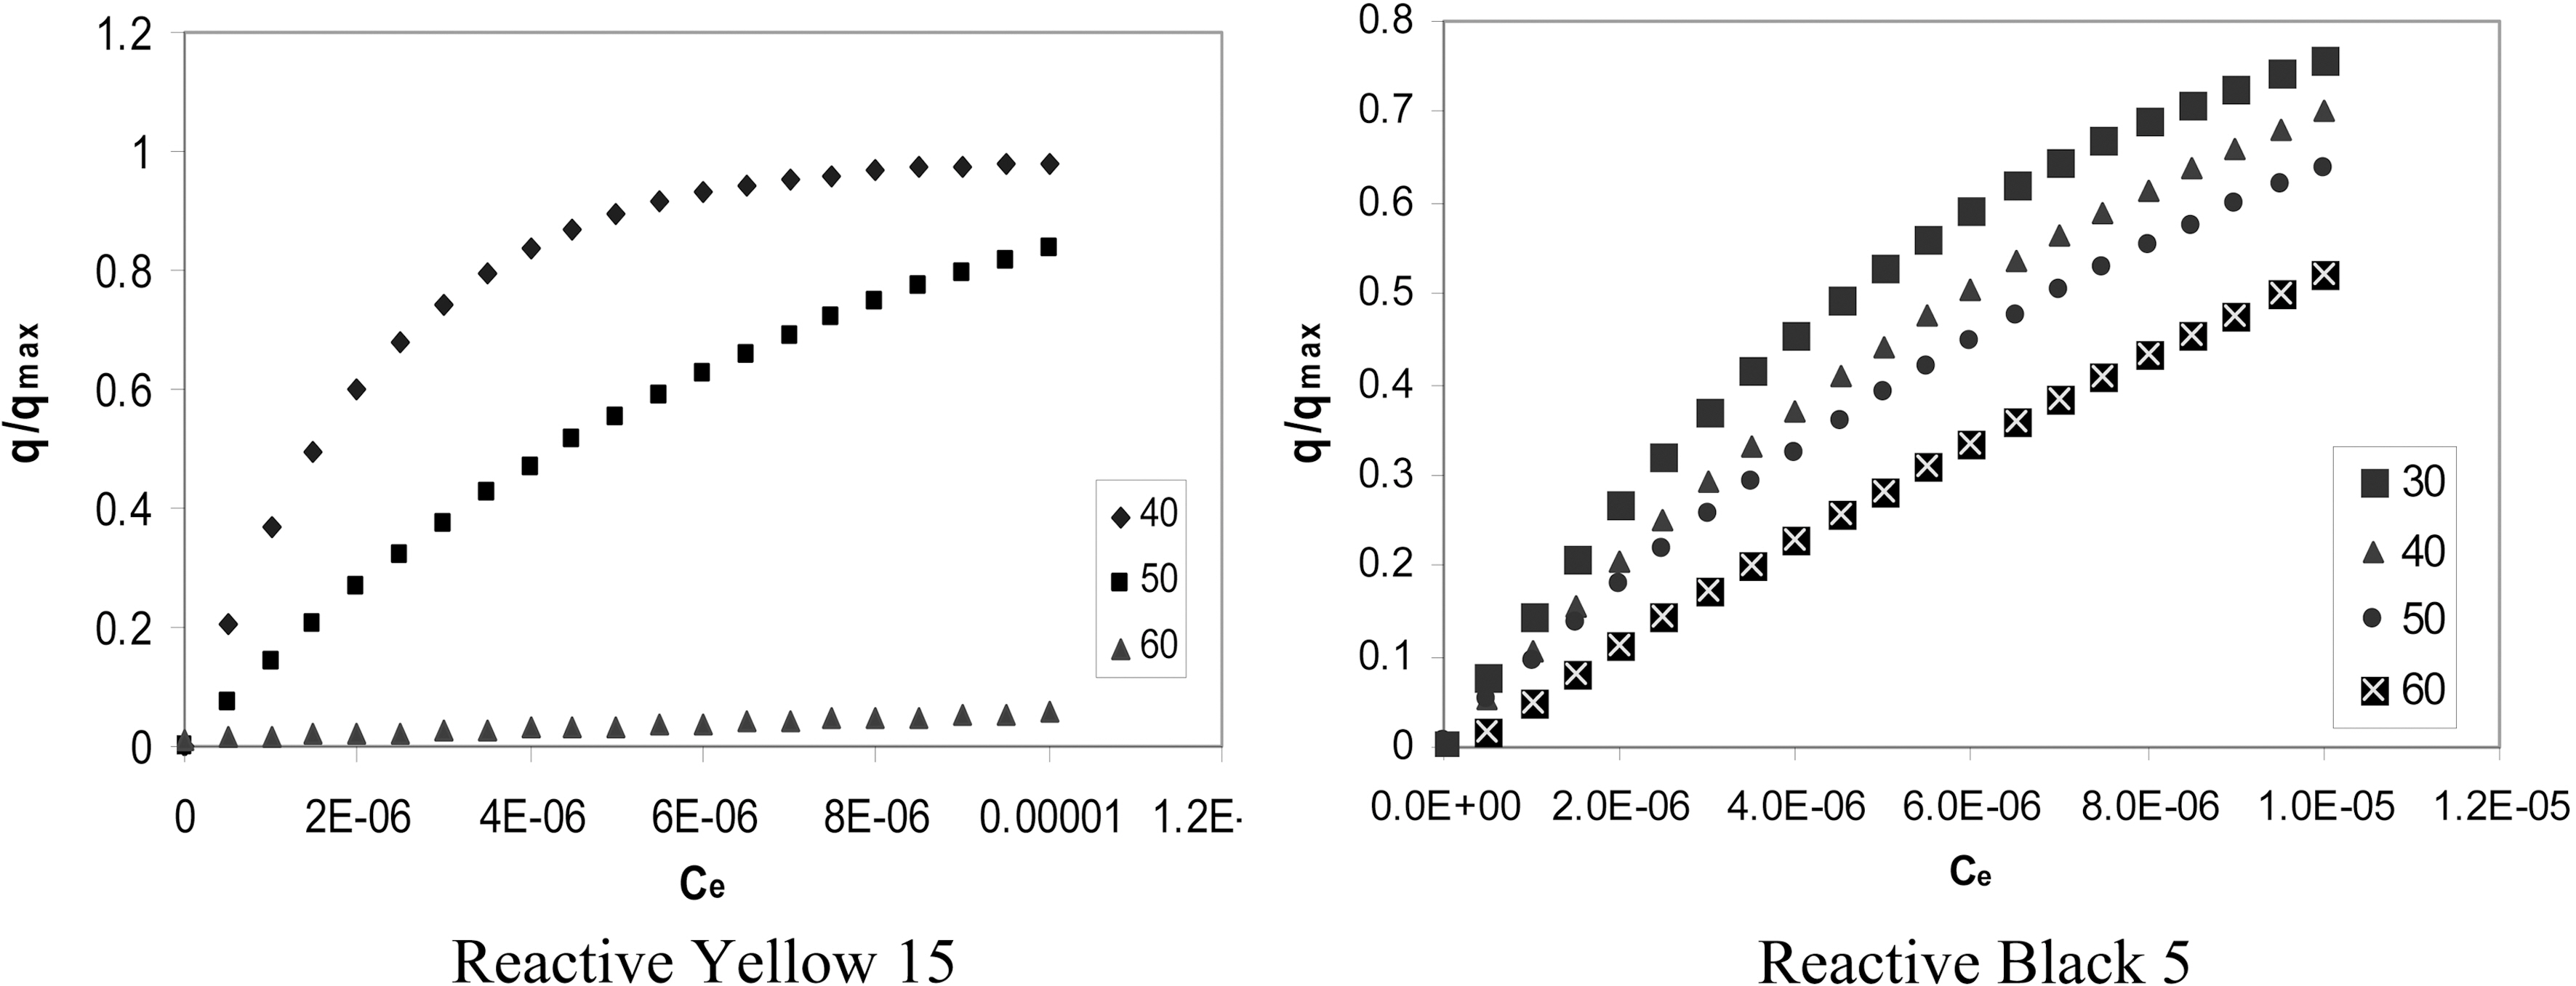
In order to observe the effect of temperature batch adsorption studies were carried out with both dyes. Adsorptions of both dyes were measured at various temperatures (303~333 K).Fig. 5 shows a decrease in adsorption with an increase in solution temperature. Therefore, adsorption of both studied dyes were exothermic and chemisorption in nature.
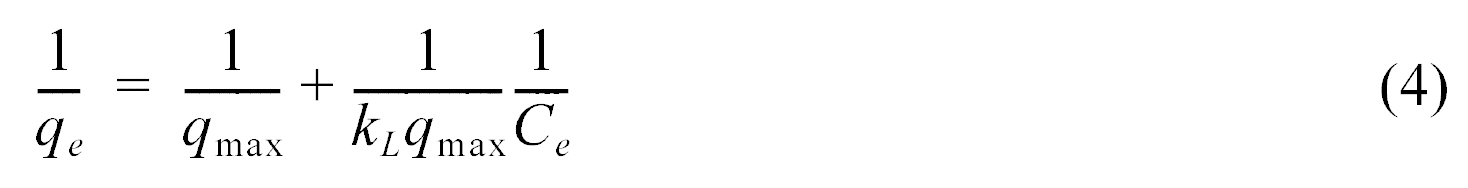
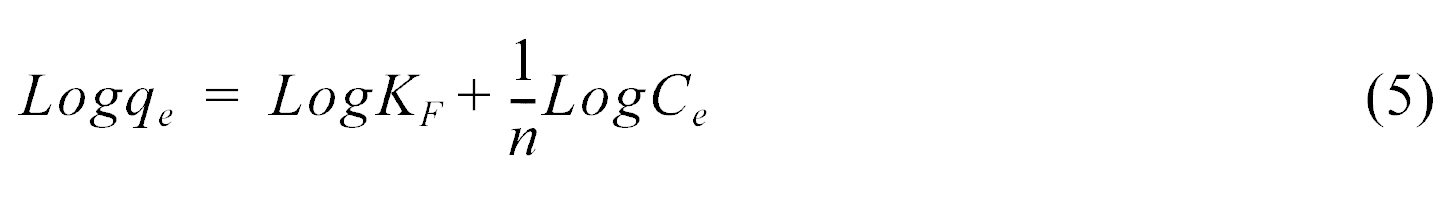
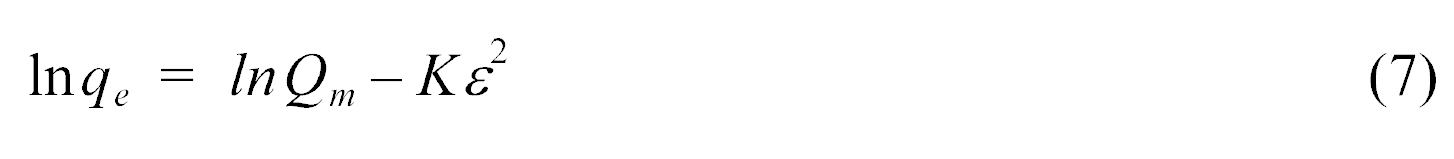
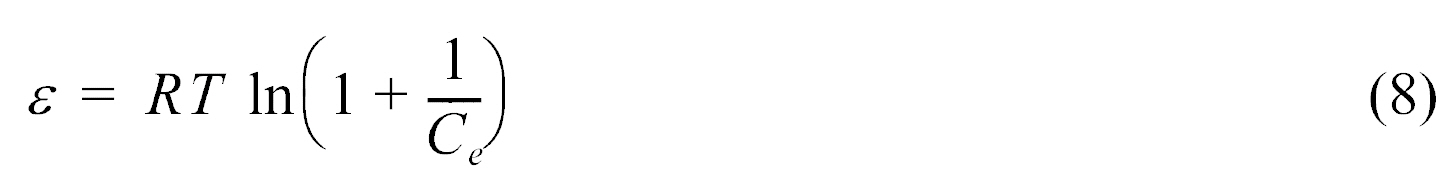
The adsorption data obtained for equilibrium conditions have been analyzed by using the linear forms of the Langmuir, Freundlich, Temkin and D-R isotherms. The Langmuir adsorption isotherm (Eq. (4)), is based on the assumption [18] that adsorption takes place at specific homogeneous sites within the adsorbent and once a dye molecule occupies a site, no further adsorption take place at that site. The Freundlich isotherm (Eq. (5)), is an empirical equation employed to describe heterogeneous systems [19].The Temkin equation (Eq. (6)), suggests a linear decrease of sorption energy as the degree of completion of the sorptional centres of an adsorbent is increased. The heat of adsorption of all the molecules in the layer would decrease linearly with coverage due to adsorbent-adsorbate interactions [20]. The D-R isotherm model [21] does not assume a homogeneous surface or constant sorption potential. It was applied to estimate the porosity apparent free energy and the characteristic of adsorption and it has commonly been applied in the following form Eq. (7) and ε is the Polanyi potential that can be calculated from Eq. (8).

where
[Table 2.] Comparison of the Coefficients Isotherm Parameters by RY15 and RB5 Adsorption Onto ACW
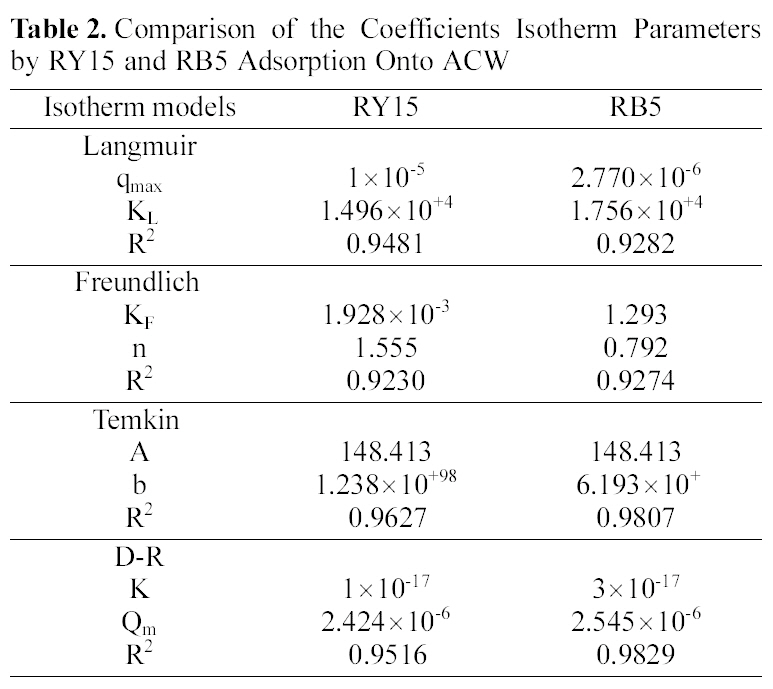
Comparison of the Coefficients Isotherm Parameters by RY15 and RB5 Adsorption Onto ACW
mol), qmax is the maximum adsorption capacity (mol/g), KF is adsorption capacity unit concentration, 1/n is adsorption intensity,
[Table 3.] Kinetics Constants for Pseudo-first and Pseudo-second Order Models
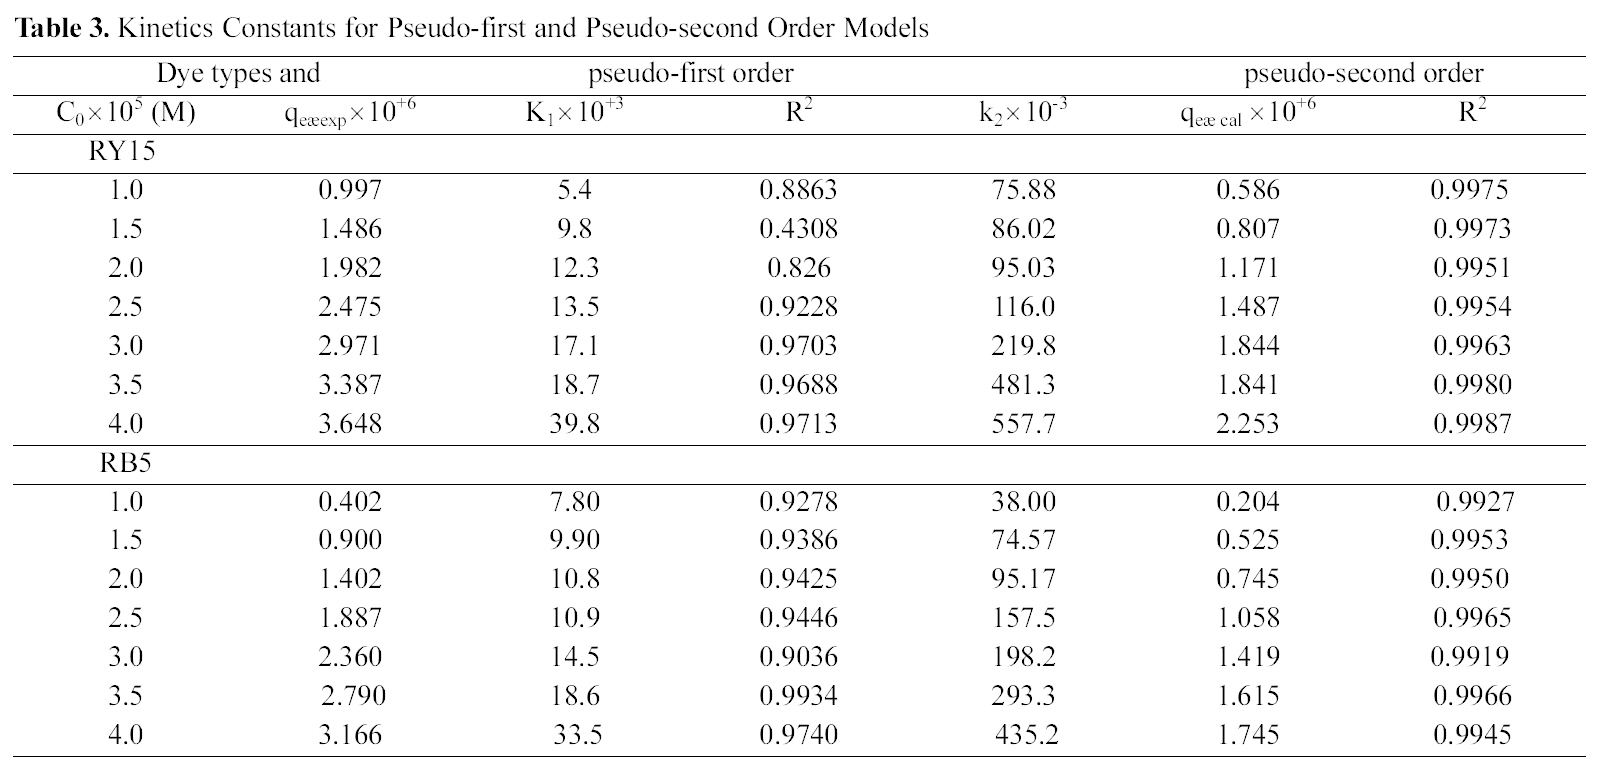
Kinetics Constants for Pseudo-first and Pseudo-second Order Models
In order to examine the controlling mechanism of the adsorption process, pseudo-first order and pseudo-second order equations were used to test the experimental data.Pseudo-first order equation of Lagergren based on solid capacity is given by [22]:

Where qt is the amount of dye adsorbed (mol/g) at time t, k1 the equilibrium rate constant of pseudo-first order kinetics(min-1) and t is the constant time (min). According to Eq. (9)the plots of
adsorption of RY15 and RB5 onto ACW have also been tested to obtain the rate parameters. The k1 and R2 were calculated from these plots and are given in Table 3.
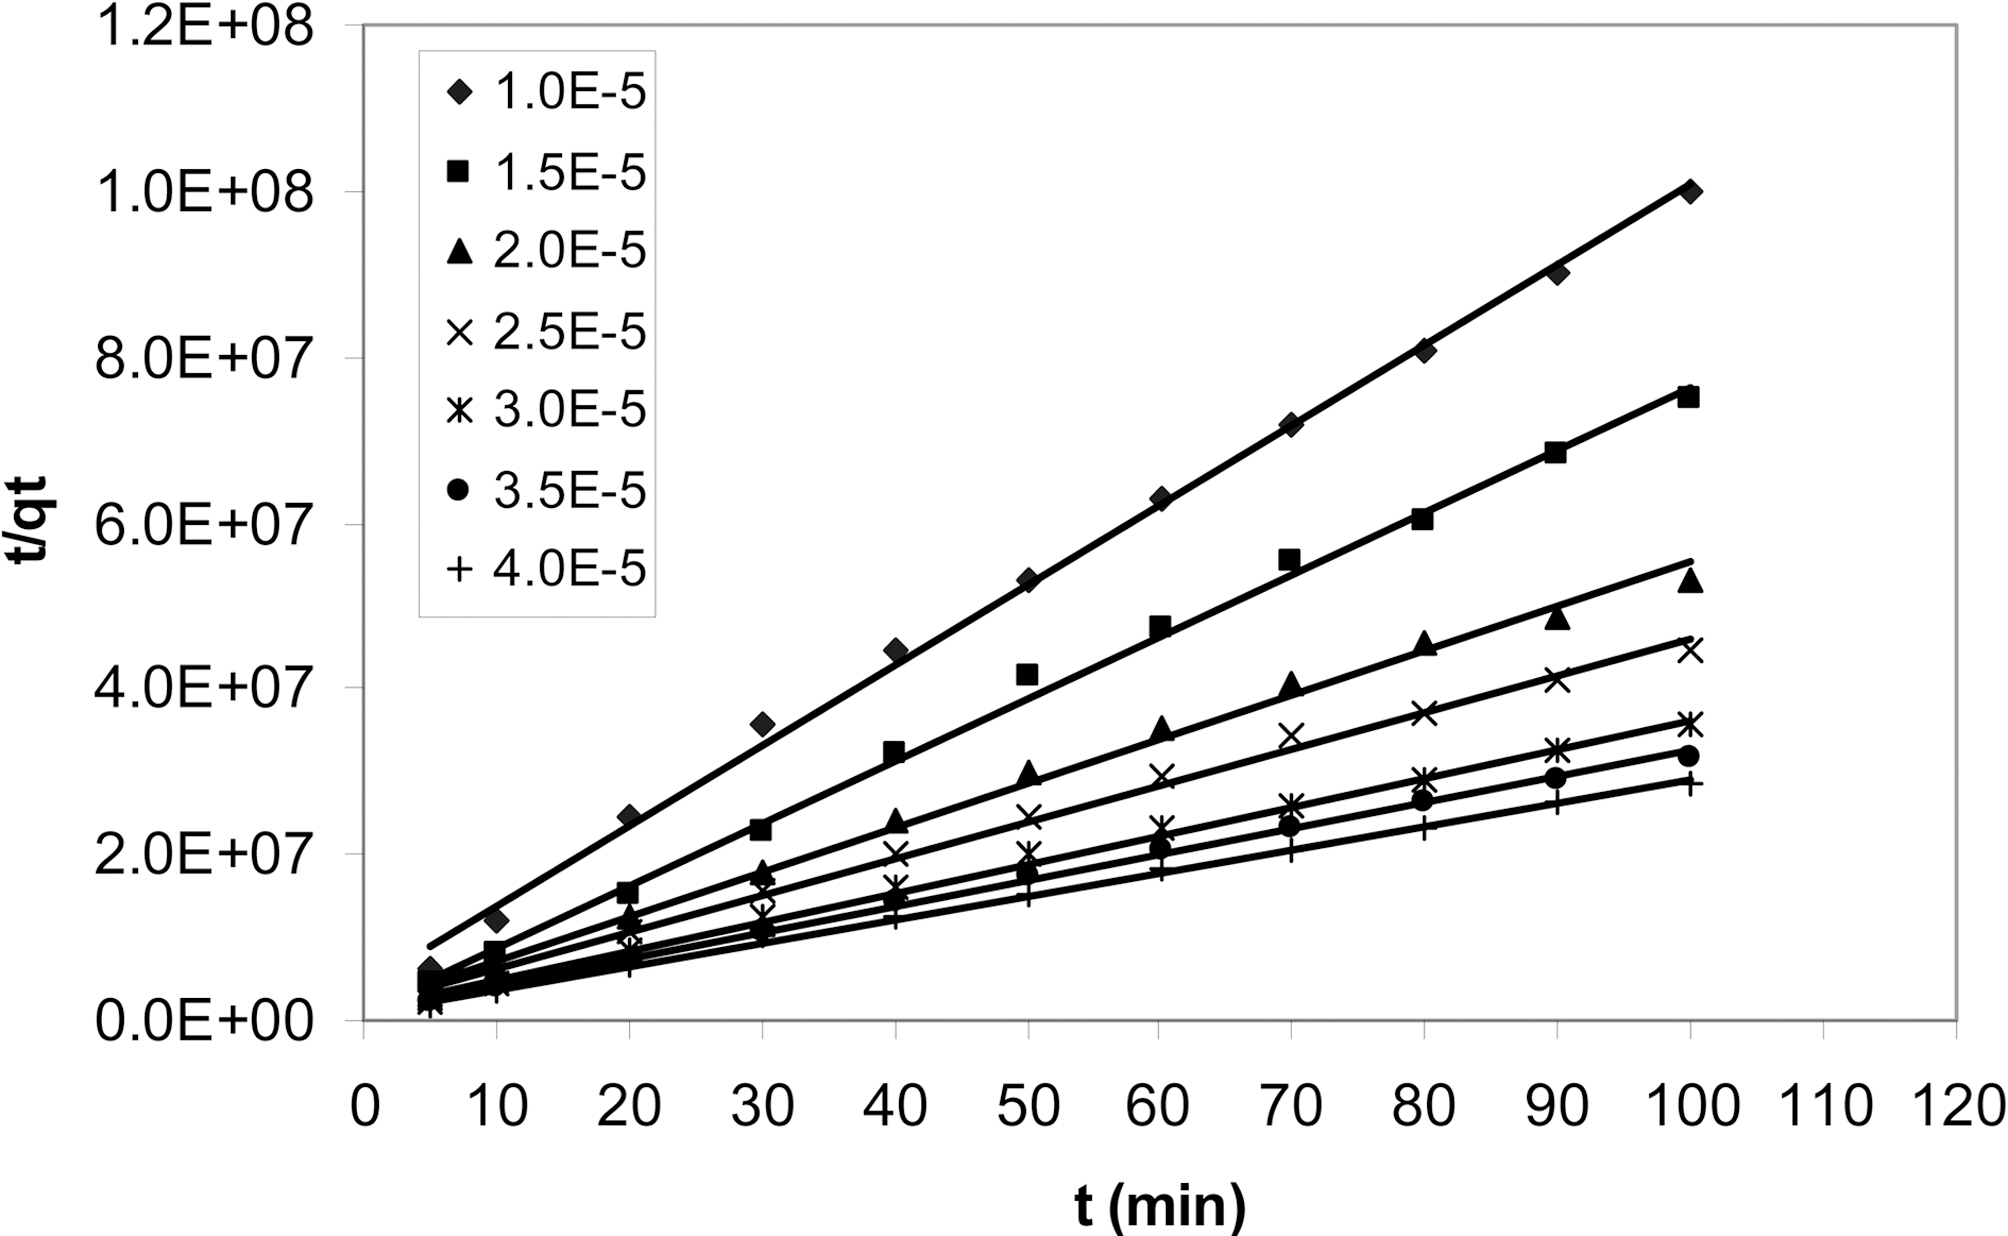
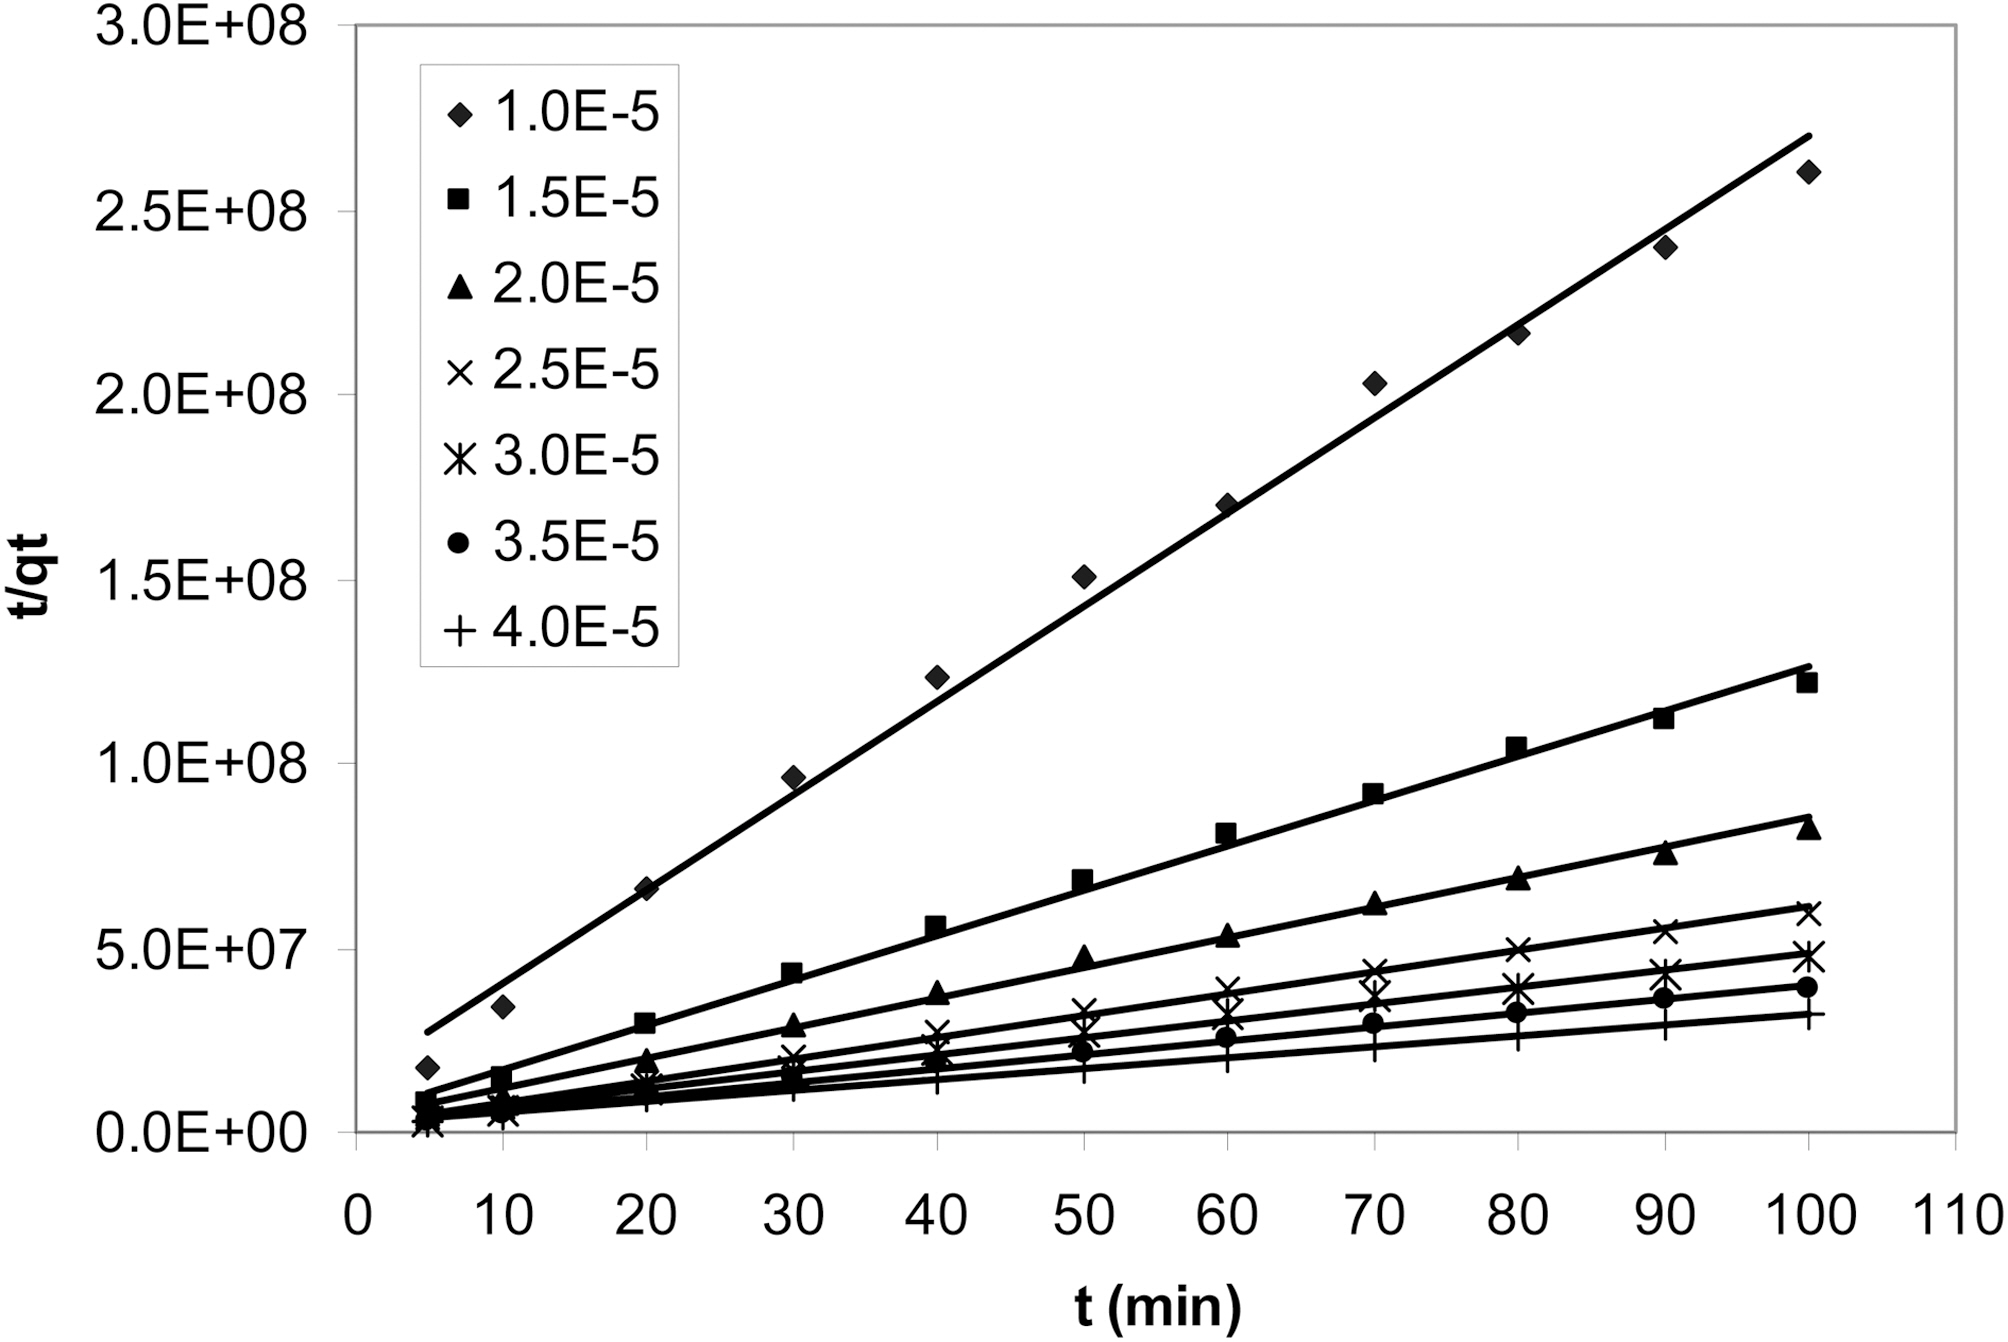
The pseudo-second order kinetic model [23] is based on adsorption equilibrium capacity and can be expressed as:
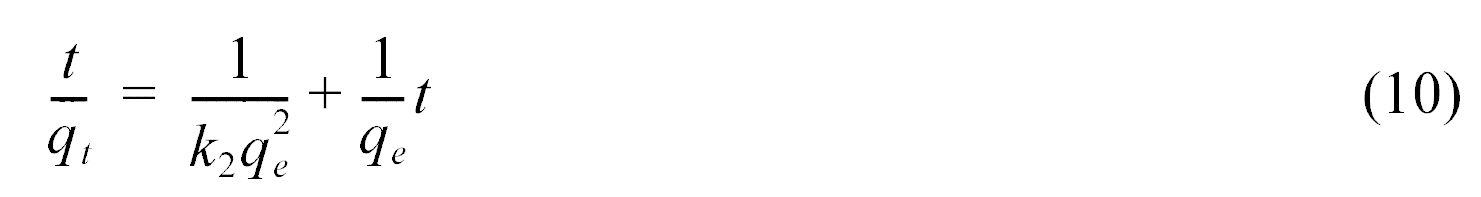
Where k2 (g/mol min) is the rate constant for pseudo-second order adsorption. The intercept and slop of
These results suggest that the adsorption of RY15 and RB5 on ACW may be best described by the pseudo-second order kinetic model with high correlation coefficients. The calculated qe values also agreed well with the experimental data. The over all rate of the RY15 and RB5 adsorption process are most likely to be controlled by the chemisorption process for ACW. Similar results have been observed in the adsorption of acid red 57 onto calcined alunite [24,25].
This study indicates that walnut shell was an effective adsorbent for removal of RY15 and RB5. The data indicates that the adsorption kinetics of dyes on ACW followed the pseudo-second order rate expression and the most favorable adsorption occurred in acidic pH. By comparing the correlation coefficients determined for each linear transformation of isotherm analysis, the Temkin and D-R isotherm models,which fit the experimental data reasonably well, were found to provide the best prediction for the adsorbent of RY15 and RB5. the results of the present investigation indicated that ACW, a low-cost adsorbent could be employed as an alternative to commercial activated carbon for the removal of RY15 and RB5 from aqueous solutions.