Carbon fibers are fibrous carbon materials with carbon content more than 92%[1]. Three precursors namely polyacrylonitrile (PAN), pitch, and viscose rayon (regenerated cellulose) have received major attraction for making carbon fibers with high mechanical properties. Especially, PAN is the only precursor which has found maximum attention, as of today, for developing high performance carbon fibers.
Pitch-based carbon fibers provide properties not readily obtainable with PAN-based fibers. Whereas the PAN-based fiber has an excellent strength at a modulus of 200 GPa, the strength decreases as the modulus increased, and the upper limit of modulus is about 650 GPa. Pitch-based fibers are capable of modulus levels up to the theoretical modulus of graphite, 1000 GPs, and have much better thermal and electrical conductivity properties than PAN-based fibers [2]. Pitch and PAN-based fibers should be considered complementary, each filling a different set of commercial needs.
The raw materials for pitch are abundant and cheap. They are by-products of petroleum and coal chemical industry such as petroleum refined residue, coal tar, and pitch (the residue of solvent refined coal and petroleum), and some pure aromatic hydrocarbon such as naphthalene, anthracene. Pitch with proper softening point and good spinnability can be purified by the methods of thermal modification [3,4], solvent modification [5], hydrogenation [6], catalytic modification [7], etc. Naphtha cracking bottom (NCB) oil, which is only the wastes, can be used as one of raw materials by thermal modification. Authors have reported the preparation of pitchbased carbon fibers from NCB [4,8-9].
As mentioned, carbon fibers show good electrical conductivity resulting in temperature increase by increasing the electrical voltage. Therefore, recently carbon fibers are using as a source of film heaters. However, there is no report on the relationship between temperature increase and the carbon content of fibers. The carbon content is depending on the carbonization conditions.
The purpose of this study is the investigation of the relationship between exothermic heat and carbon contents of fibers by changing the conditions in the carbonization process. To obtain the purpose, i) isotropic pitch-based carbon fibers were prepared by reforming NCB oil and various carbonization conditions, ii) exothermic heat (temperature increase) of fiber tows was measured by changing the electrical voltage with specially designed apparatus, and iii) the relationship between temperature increase and carbon contents of fibers were investigated with regarding to crystalline size (stacking size) of fibers.
Naphtha cracking bottom (NCB, S.K. Oil Co.) oil was used as a raw material of pitch-based carbon fibers. NCB oil was

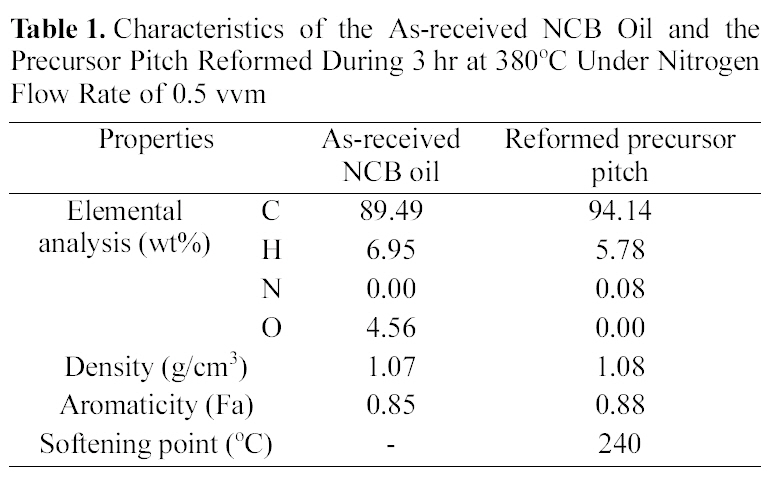
Characteristics of the As-received NCB Oil and the Precursor Pitch Reformed During 3 hr at 380℃ Under Nitrogen Flow Rate of 0.5 vvm
heat-reformed following the previous reports [8,9]. Table 1 shows the characteristics of the as-received NCB oil and the precursor pitch which was reformed at 380℃, 3 hr, 0.5 vvm
nitrogen flow. Molecular weight distributions of the asreceived NCB oil and the reformed precursor pitch were measured by MALDI/MS (Voager DE-STR, PerSeptive Biosystems). 2.5-dihydroxy benzoic acid was used as a matrix.
The precursor pitch was melt spun to pitch fiber at around 290℃ and stabilized in air surrounding at 300℃ for 1 hr. The stabilized fiber tow was carbonized at different temperature (700~1000℃) and time (1~4 hr) in carbonization furnace with nitrogen flow. Carbon content of each tow sample was analyzed by elemental analysis apparatus (Flash EA 1112, Thermo Fisher Scientific Co.), crystallinity was analyzed by x-ray diffraction (D/MAX-2200 Ultima/PC, Rigaku Inter.Co.) [10]. Temperature increase of fiber tows was measured to estimate the exothermic heat.
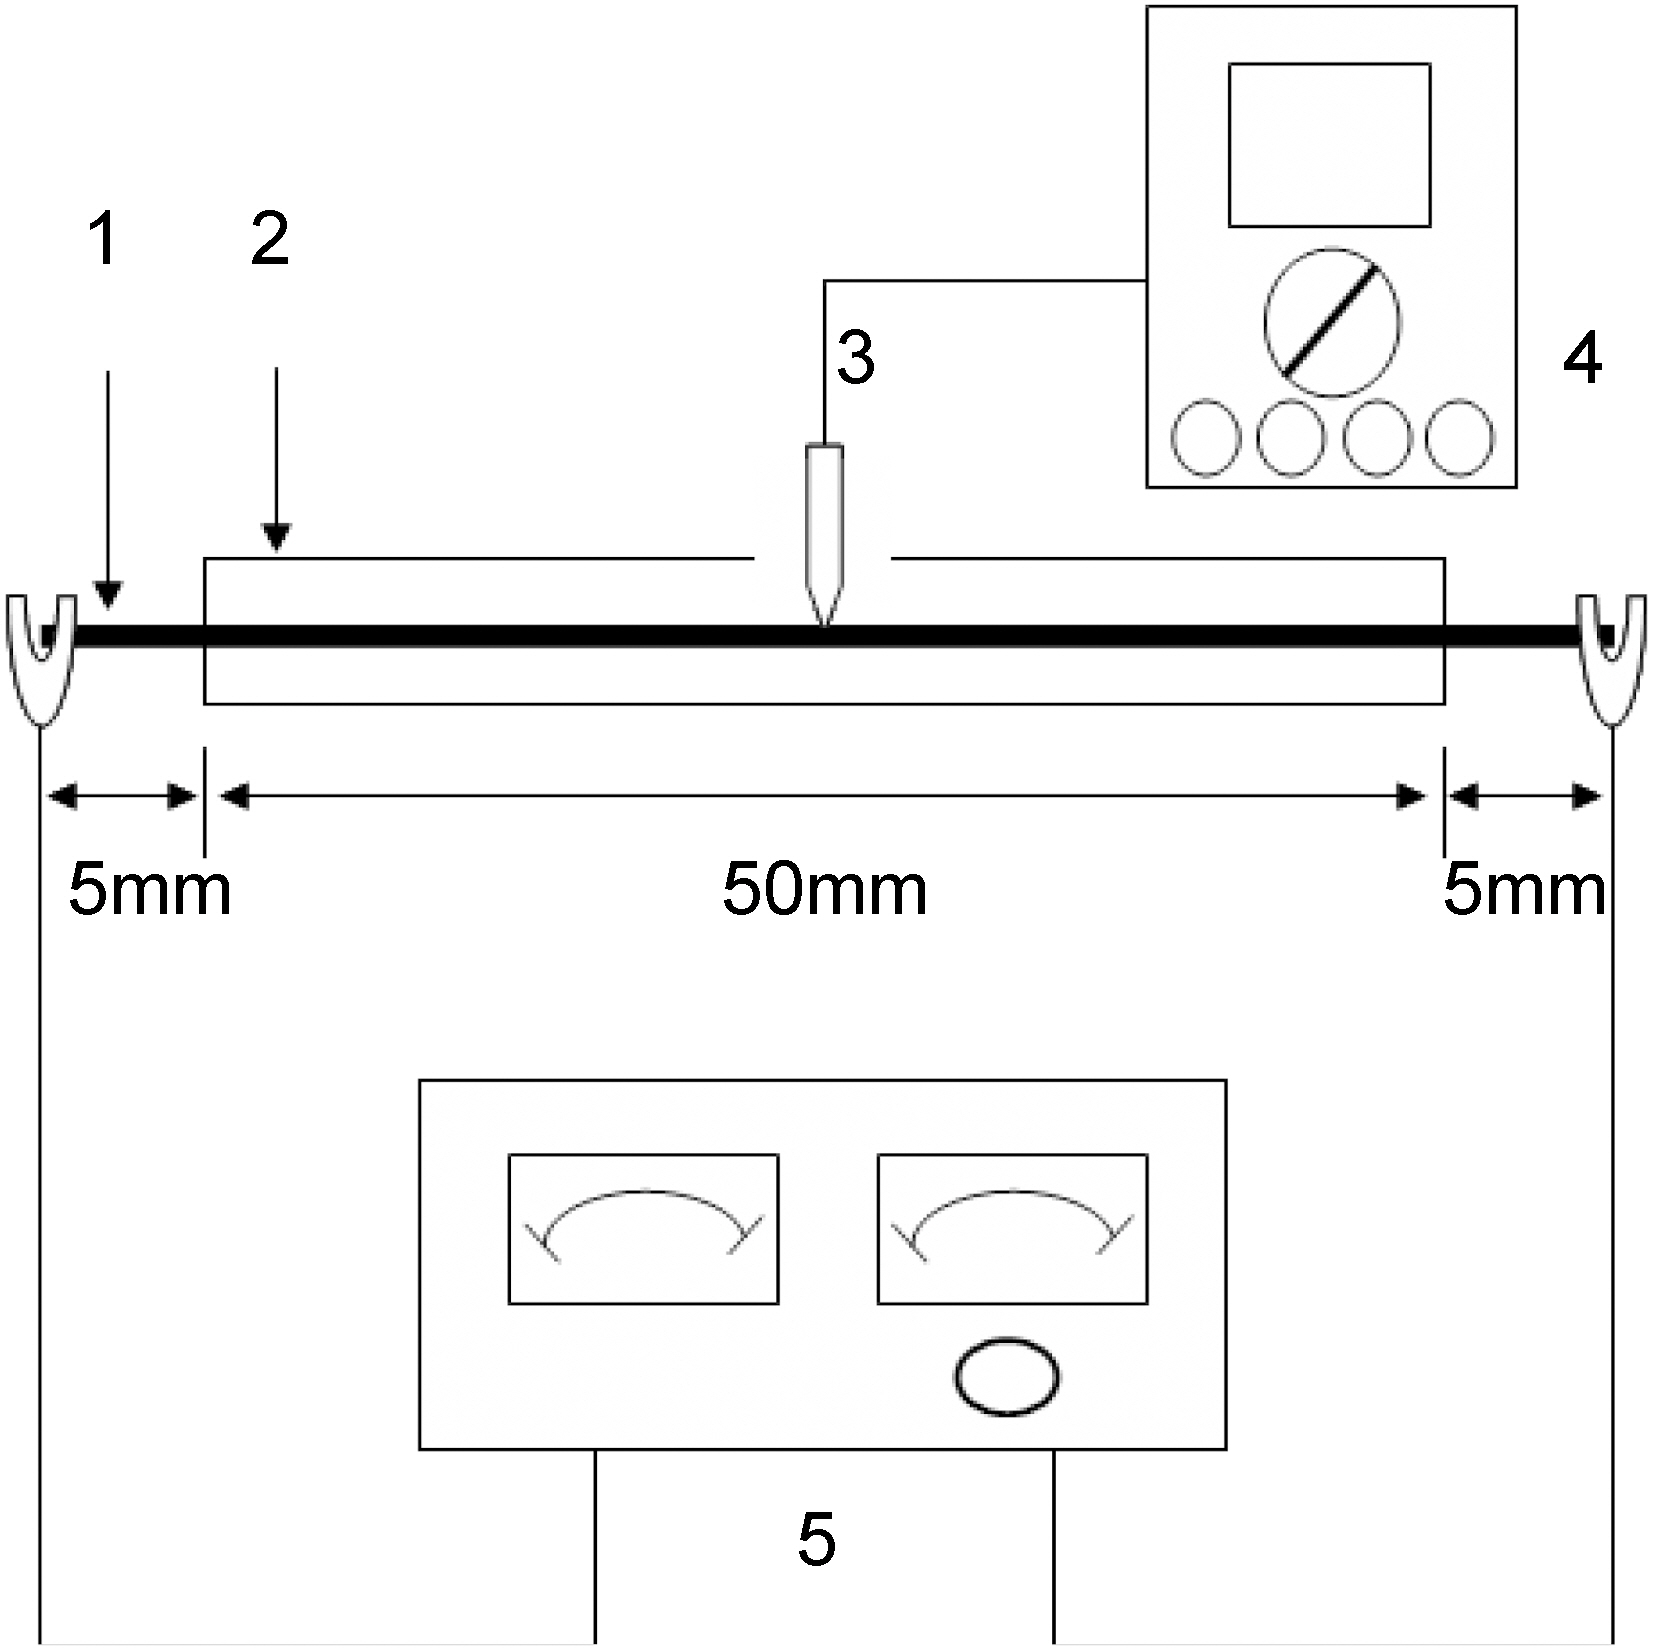
Fig. 1 shows the temperature increase measuring apparatus, which was specially designed by authors for this experiment. 6~12 k filament or some amount of carbon fiber tow (40~100 mm length) was inserted into the 4 mm diameter glass tube (30 ~80 mm tube length). Two crocodile terminals of electro voltage controller were connected to both tips of carbon fiber tow out of glass tube. The glass tube has a hole in the center. A thermocouple was connected to the fiber tow which was exposed in the center of the glass tube. The exothermic heat was transferred to temperature and measured by temperature indicator as a function of electrical voltage change (1~5 V).
Table 1 shows the weight percent change of the atomic component from as-received to reformed pitch by thermal modification. The liquid phase has changed to solid phase. The softening point of reformed pitch was around 240℃.Carbon content and aromaticity were increased by modification.
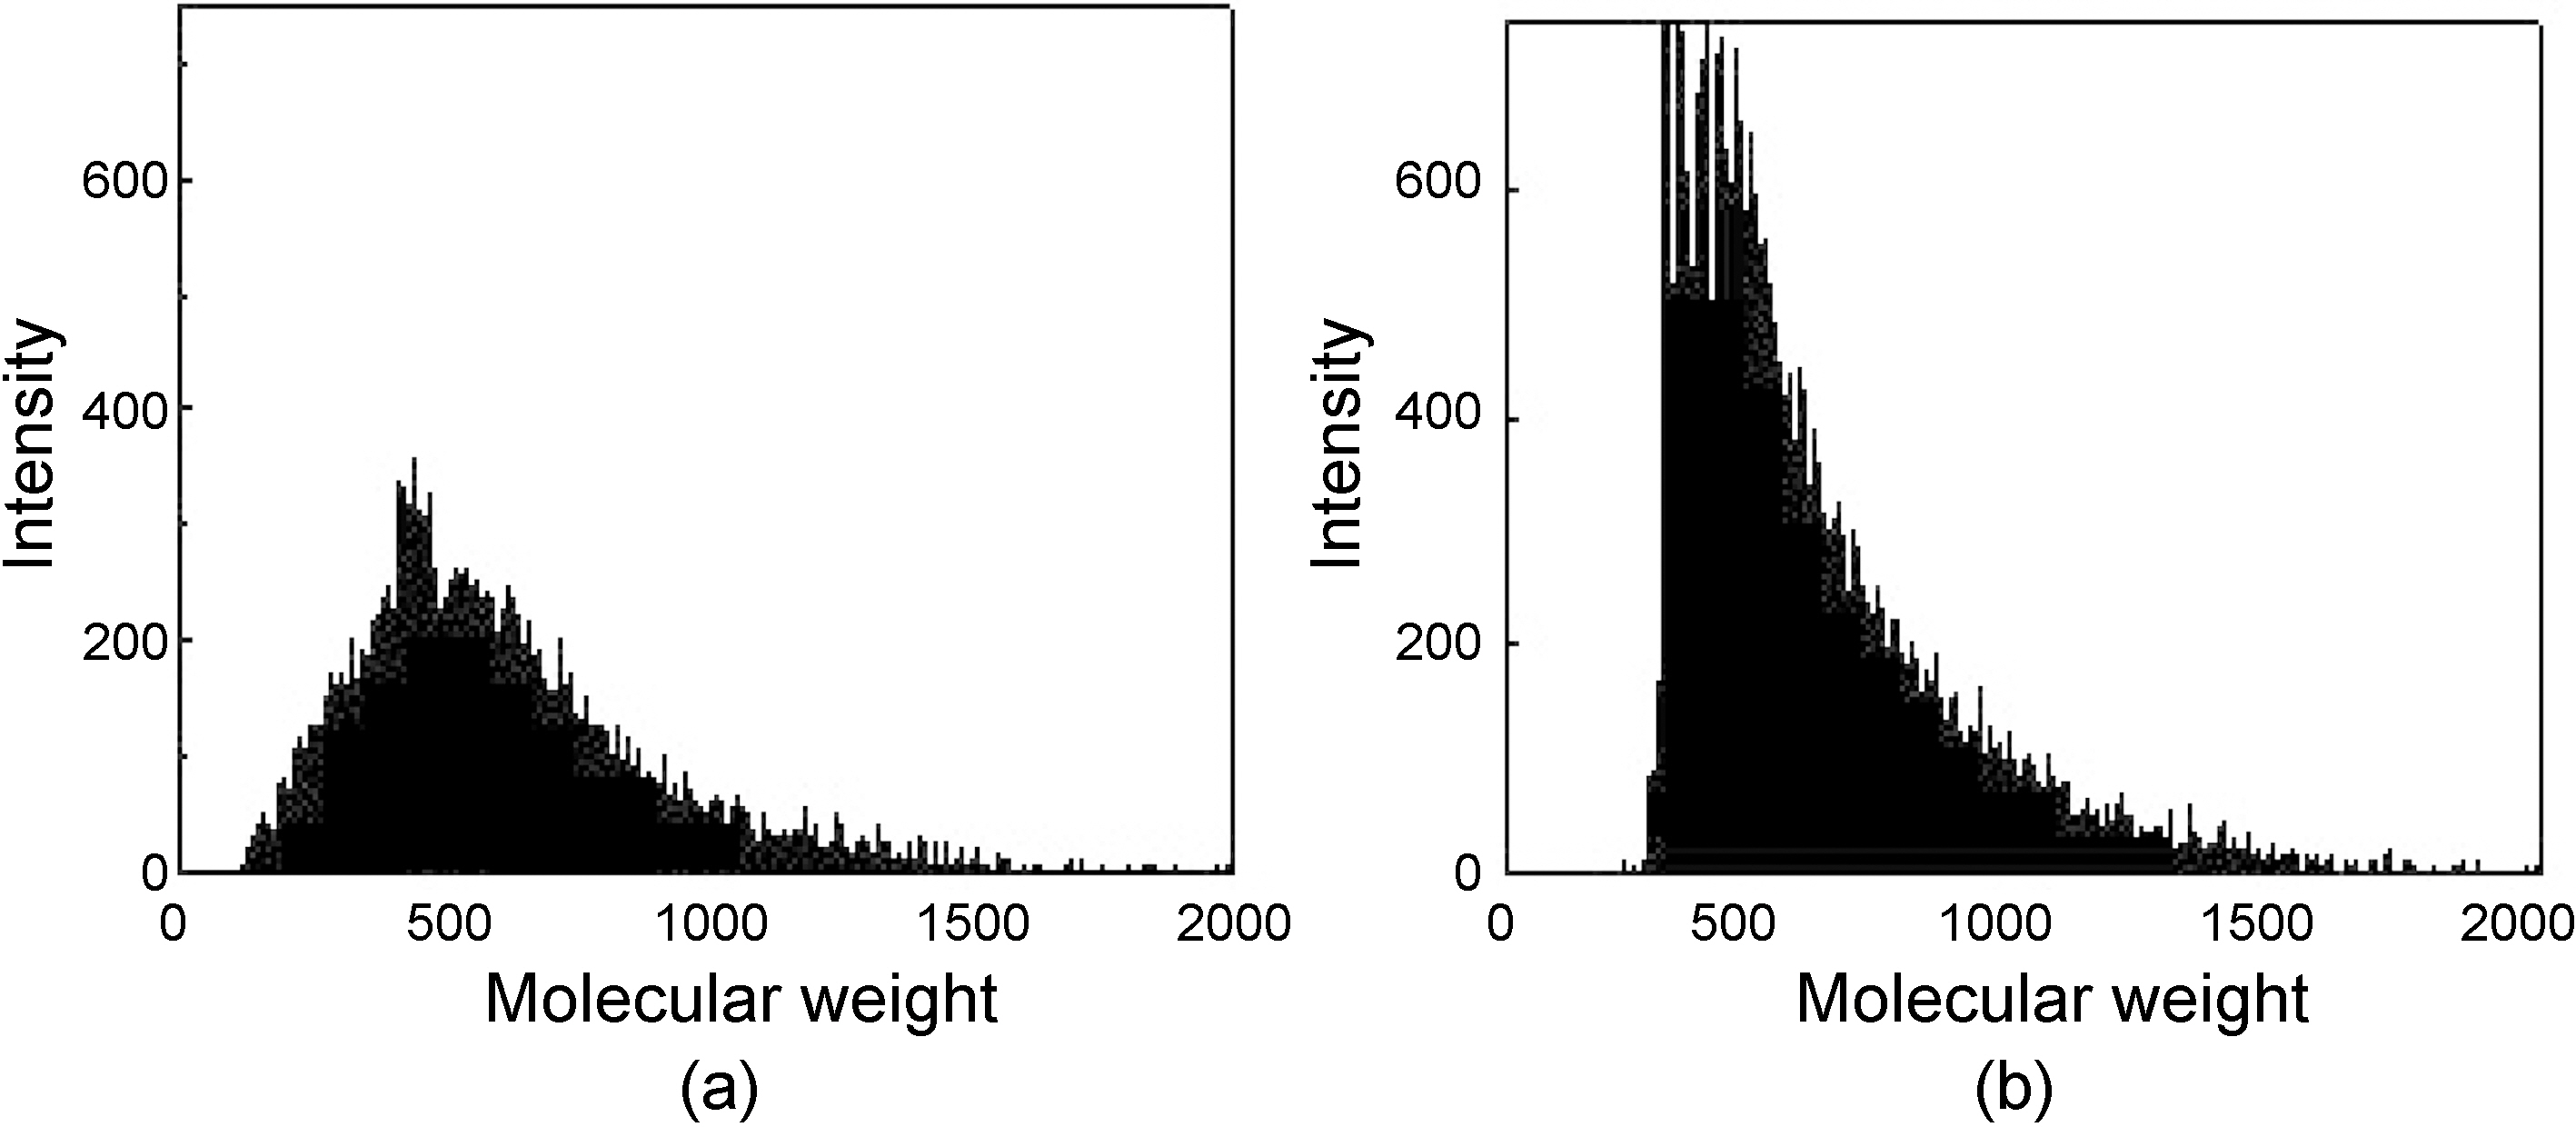
Fig. 2 shows the molecular weight distributions of the as-
[Table 2.] Standardized carbon content and crystallinity with respect to carbonization conditions
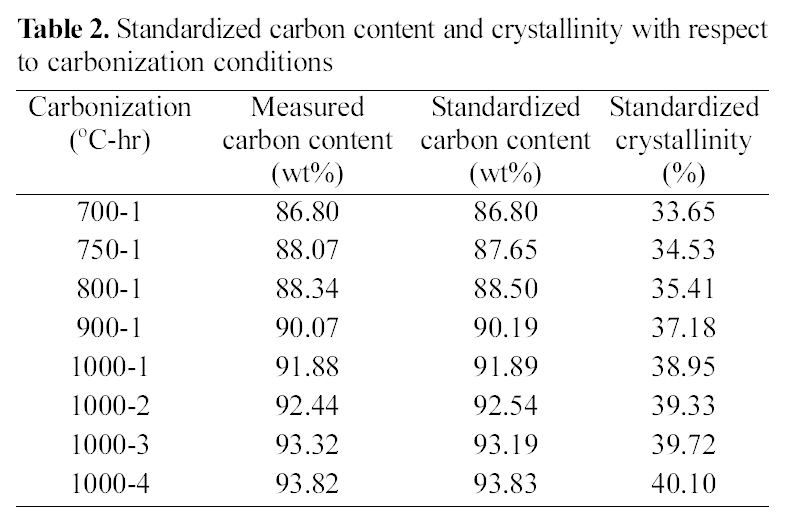
Standardized carbon content and crystallinity with respect to carbonization conditions
received NCB oil and the reformed precursor pitch. The molecular weight of the as-received NCB oil was broadly distributed including some amount of lower molecular weight components than 250, while that of reformed precursor pitch was narrowly distributed, almost free of lower molecular weight components than 250 due to the evaporation and coagulation to larger by reforming.
Table 2 shows the standardized carbon content and crystallinity with respect to carbonization conditions. The
measured carbon content of fiber linearly increased from 86.8 to 91.88 wt% as increasing the carbonization temperature from 700 to 1000℃, for 1 hr carbonization time, and it was also linearly increased from 91.88 to 93.82 wt% as increasing the carbonization time at 1000℃. Therefore, standardized carbon contents can be obtained from the linearization lines for different carbonization temperature and time. From the curves, Crystallinity of carbon fiber was calculated from XRD curves. Crystallinity was also shown the linear relationship with carbonization temperature and time. However, the crystallinity of fiber carbonized at 1000℃, 4 hr was only 40.1% in spite of 93.82% of carbon content. This means high level crystalline degree can be obtained from fairly high temperature carbonization.
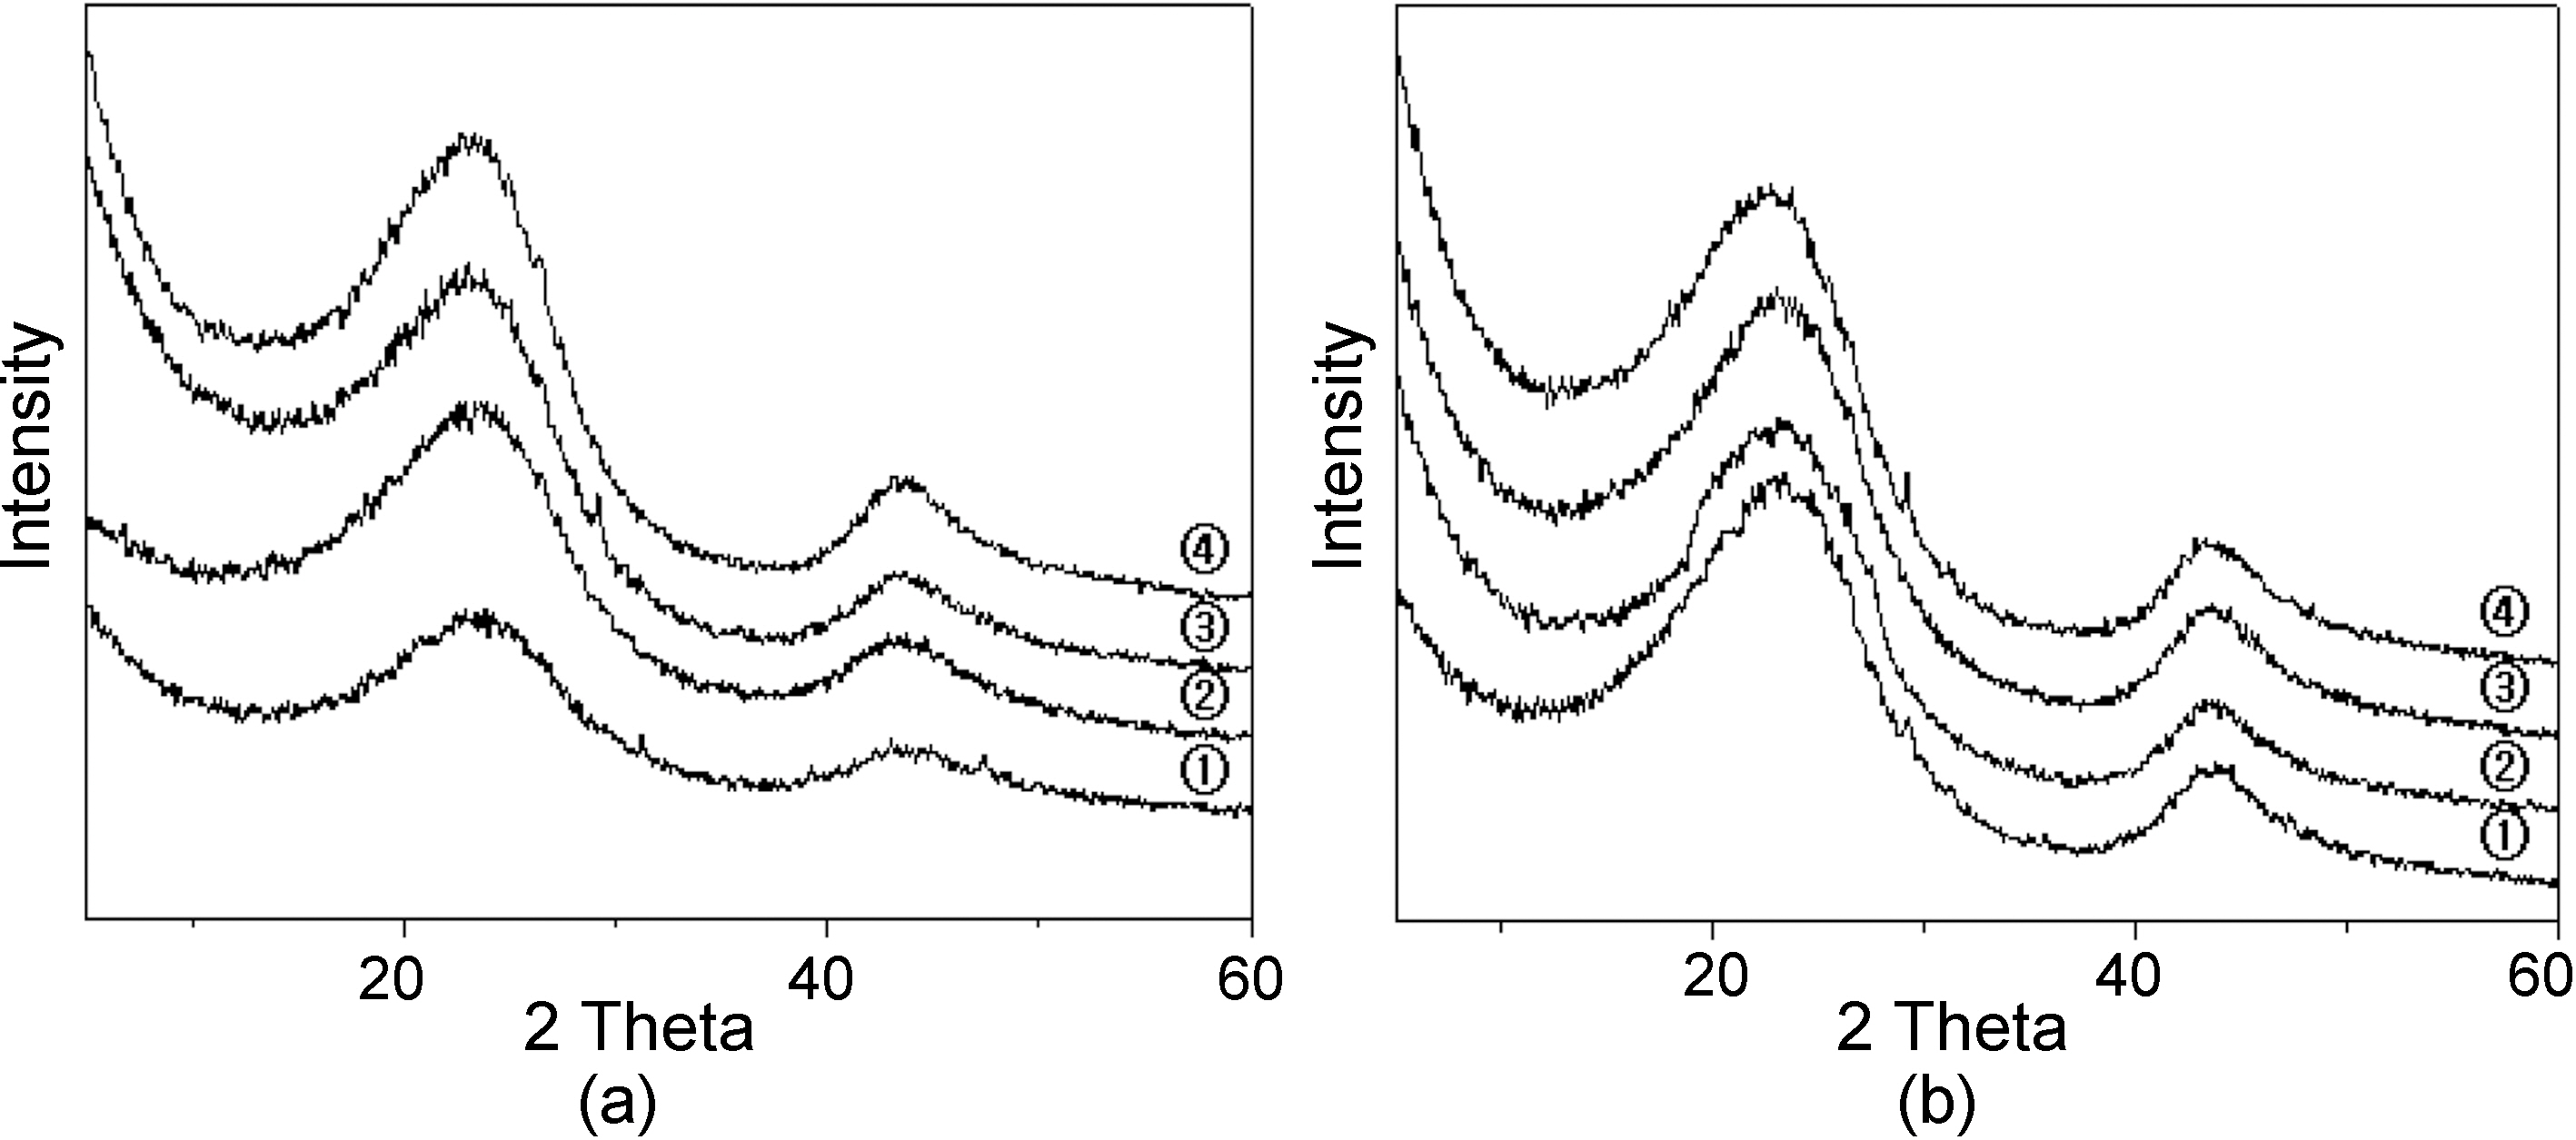
Fig. 3 shows the XRD curves of carbon fibers carbonized at (a) different temperature for 1 hr and (b) different time at 1000℃. The curves show unique peaks of carbon atom and intensities increased as increasing the carbonization temperature and time.
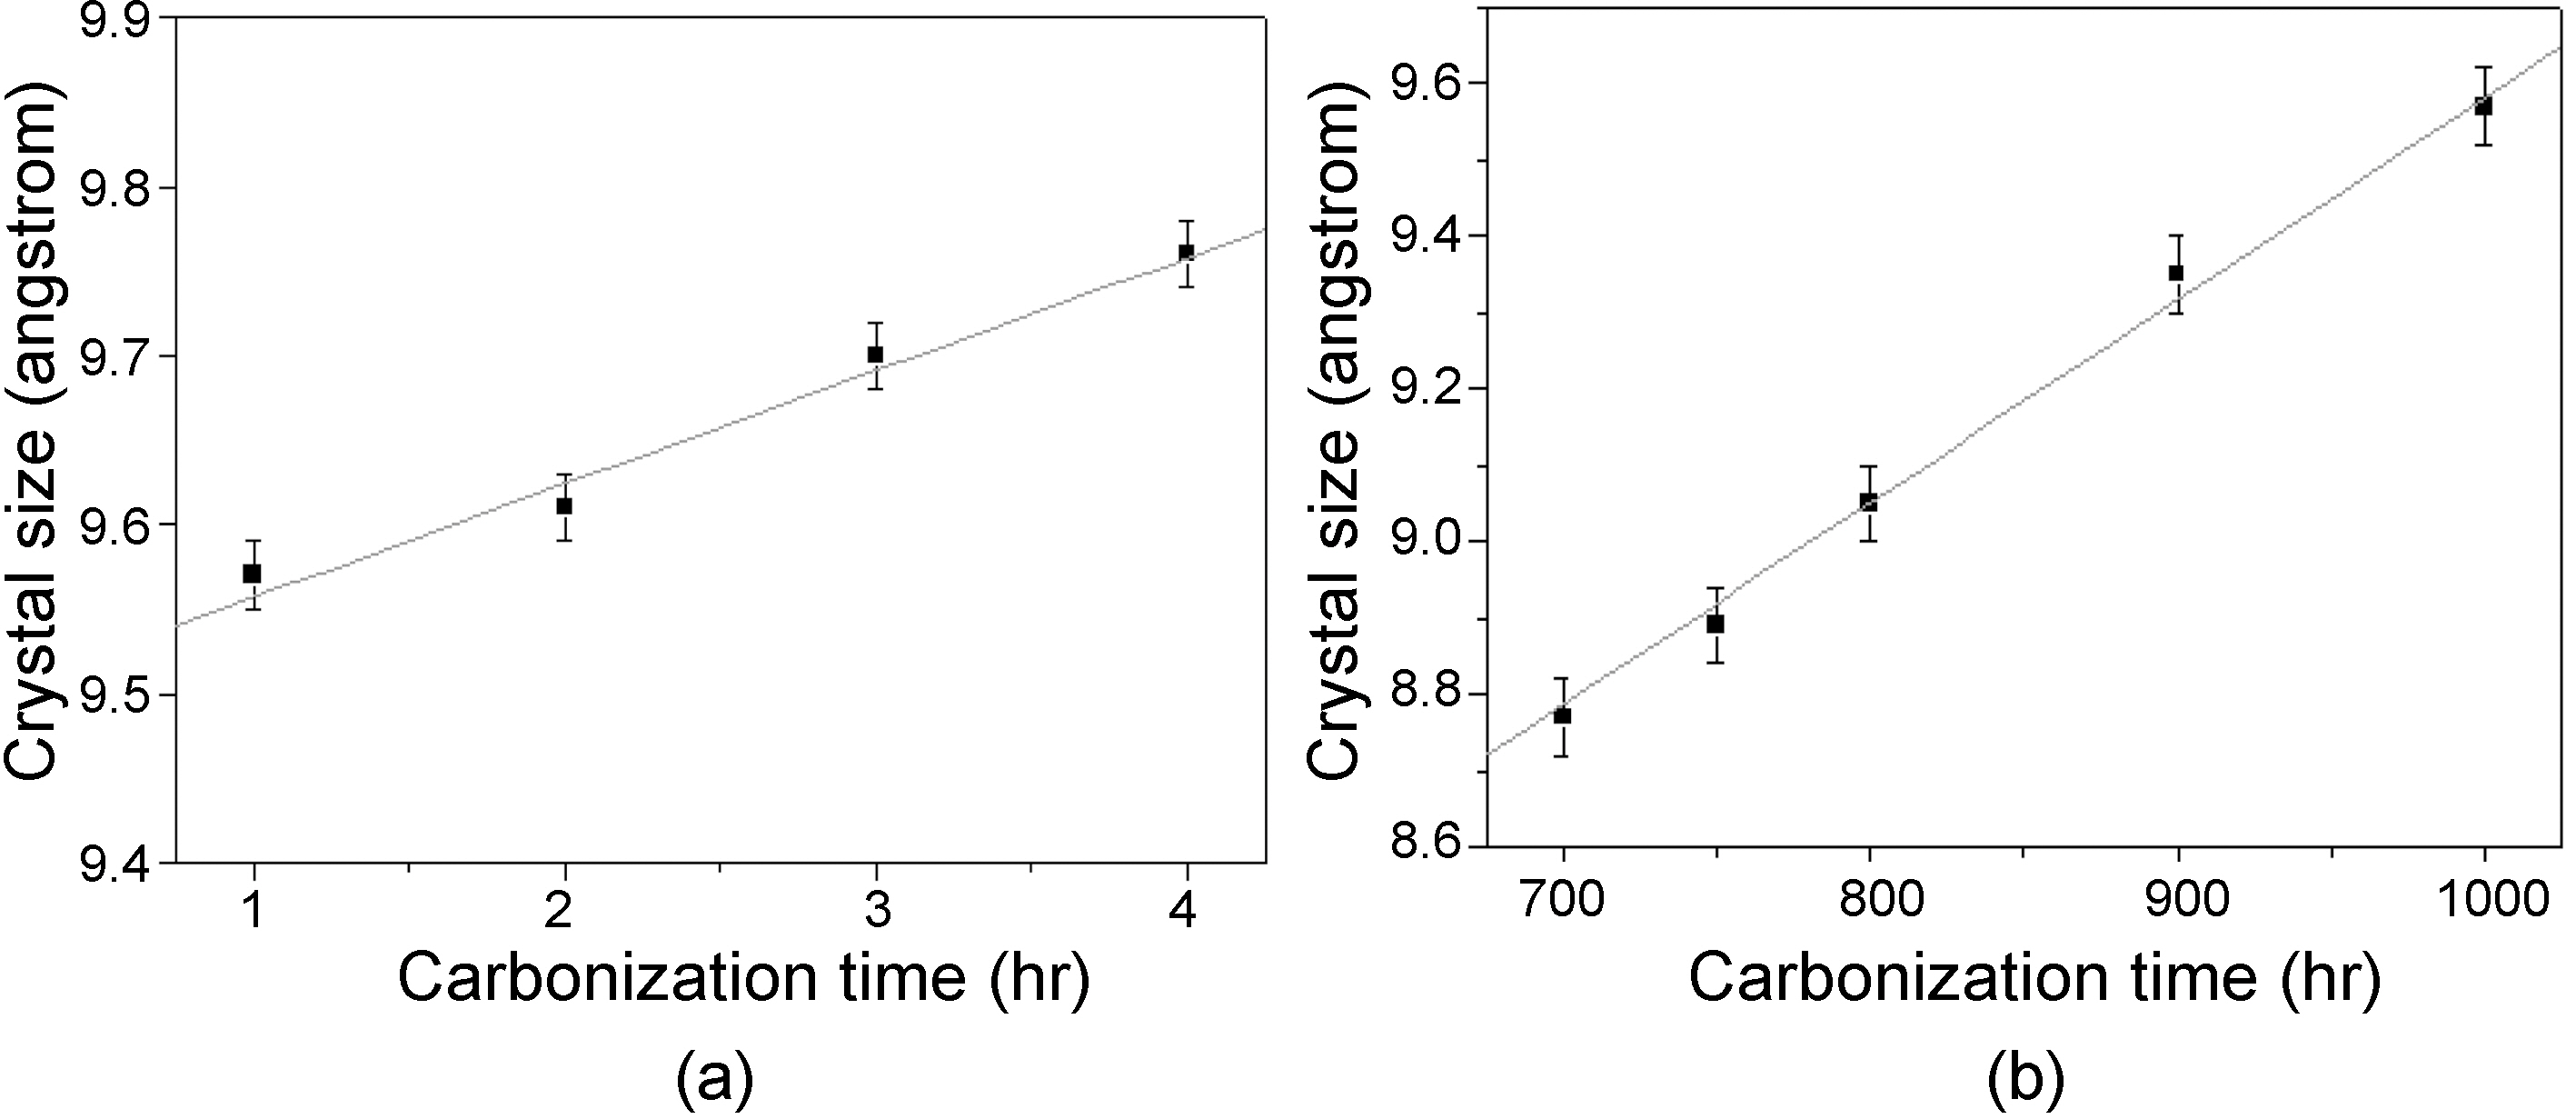
Fig. 4 shows crystalline size (stacking size: Lc) of carbon fibers carbonized at different temperature and time. The crystalline size was in the range of 8.7 to 9.54 A between 700 and 1000℃ carbonization temperature for 1 hr, and 9.54
to 9.75 A between 1 and 4 hr carbonization time. The crystalline size of general purpose PAN-based carbon fiber (T-300) was about 15~23 A [11]. Marsh and Griffiths [12] reported that ordered structure was started after 800℃ carbonization and obtained high level after 1800℃ graphitization process. Crystalline sizes of carbon materials at high temperature (1500~3500℃) were introduced from 20 to 120 A [13]. In general, they are transformed from organic matter by 1000~1500℃ heat treatment, which are the substance with imperfect graphite crystalline structure arranged along the fiber axis [14]. Franklin [15] has suggested an equation relating to the dspacing between the layers, however, there is no data on the crystalline degree of fibers prepared between 700~1000℃. This is because, 1000℃ is too low to measure the exact crystalline size of the carbon fiber. Therefore, the measured crystalline sizes in this experiment can be considered only the reference.
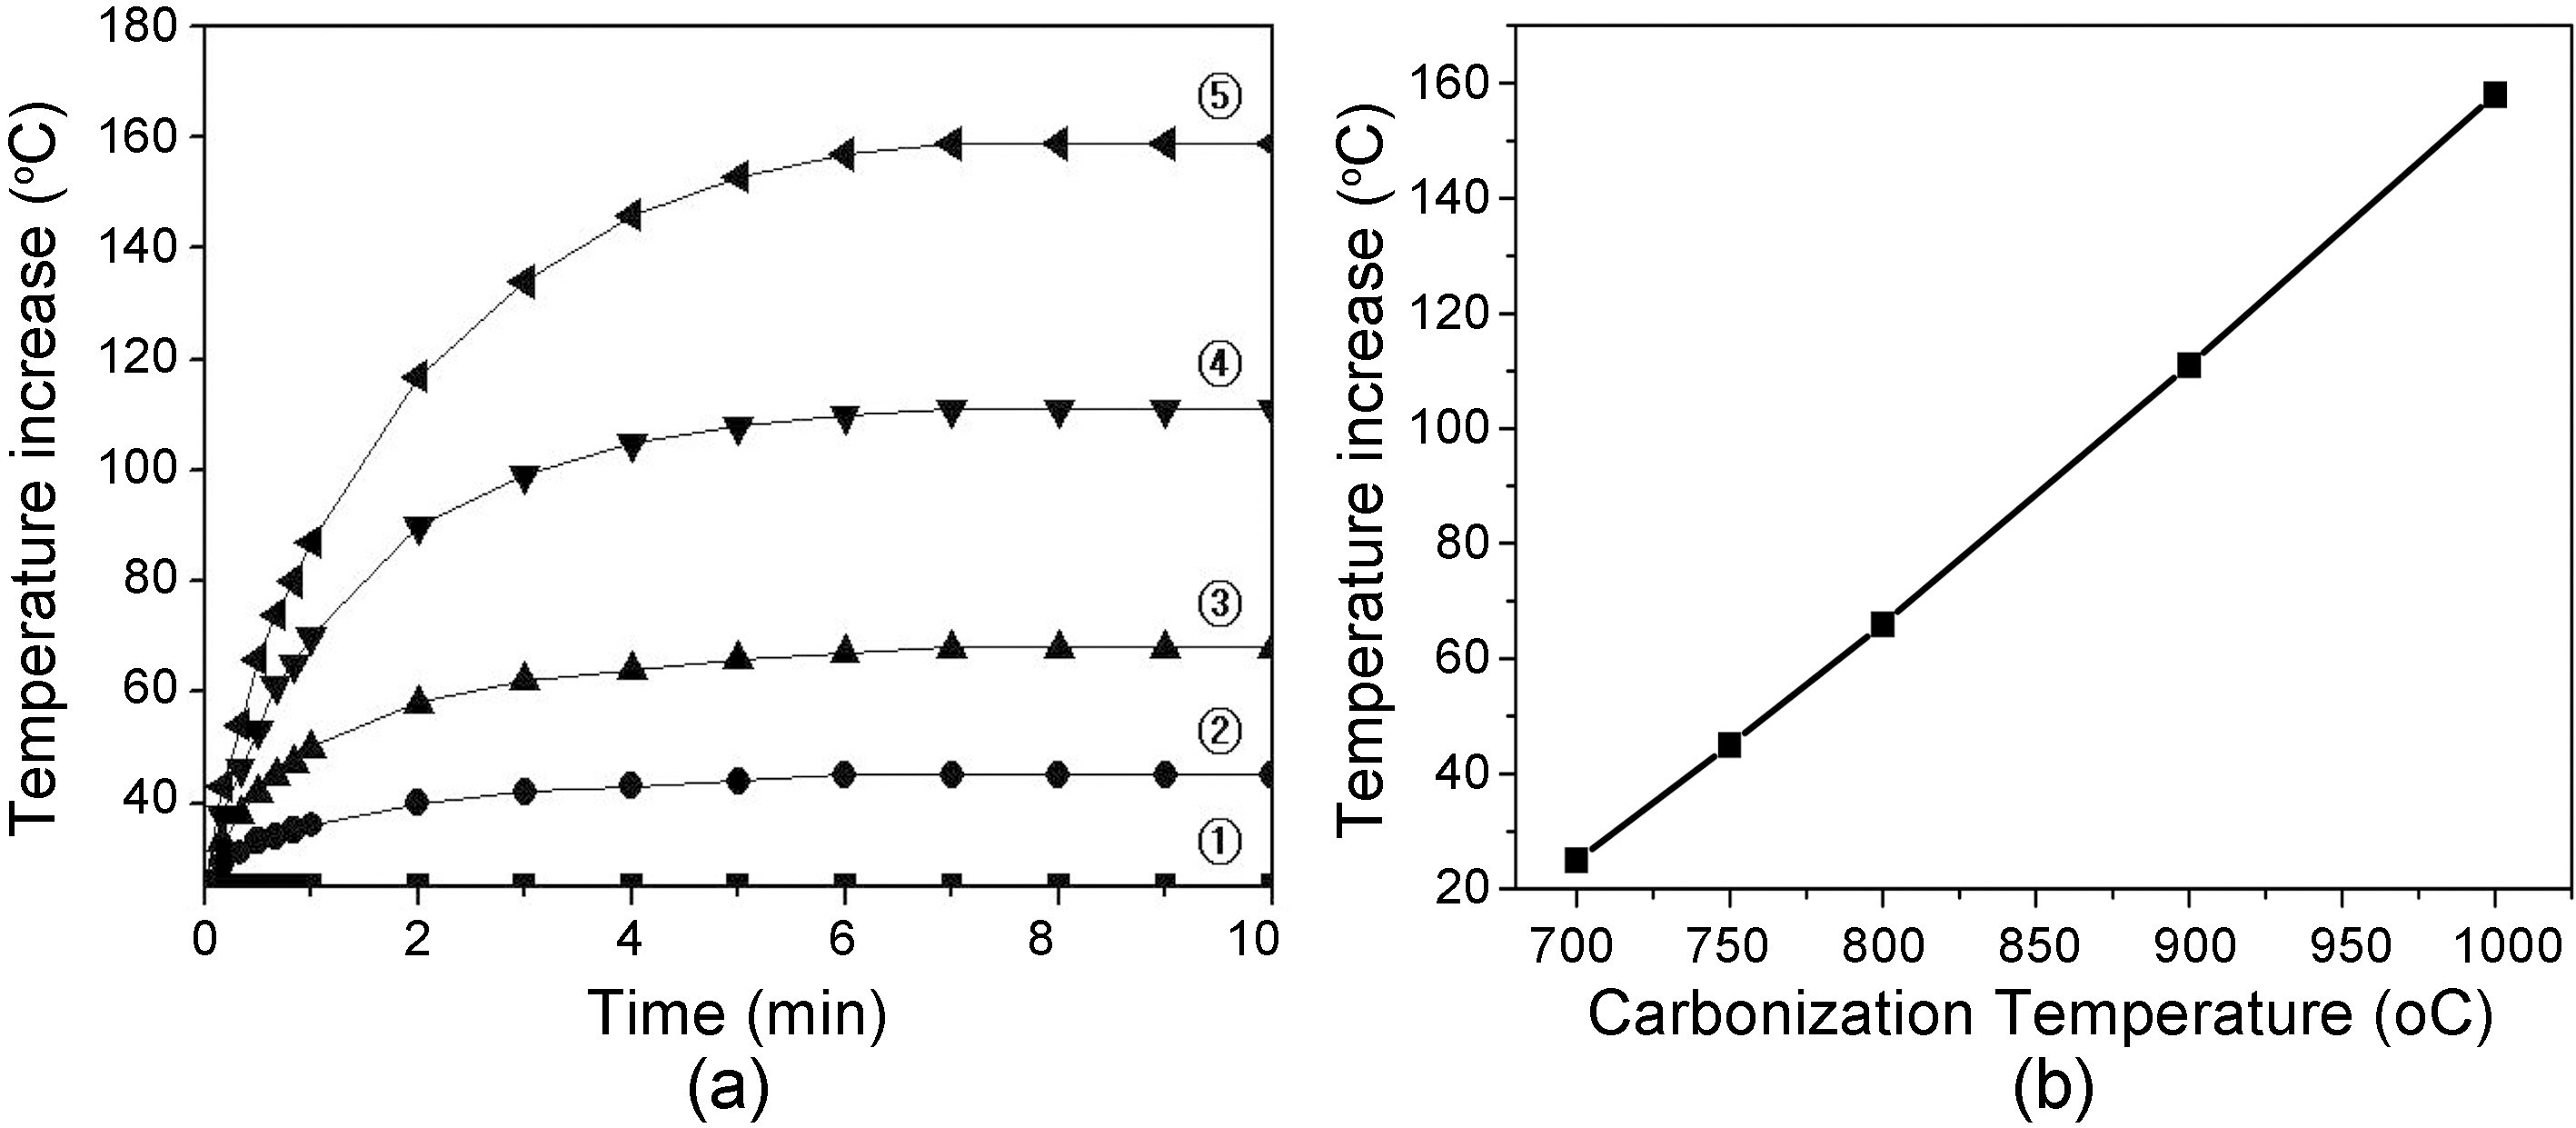
Fig. 5 shows (a) temperature increase of carbon fiber tow prepared at different carbonization temperature for 1 hr as a function of contact time, 5 V, and (b) relationship between temperature increase and carbonization temperature at 10 min. contact time of Fig. 5(a). Lavin et al. [16] reported the electrical resistivity and thermal conductivity of carbon fiber as a function of temperature. temperature increase was inversely proportional to the increase of electrical resistivity.In this study, temperature of fiber tow increased at an linear rate as increasing the contact time of thermocouple to fiber tow. Also, the temperature increased as increasing the carbonization temperature. However, the temperature become constant after 7 min. contact time for all the fiber tows.
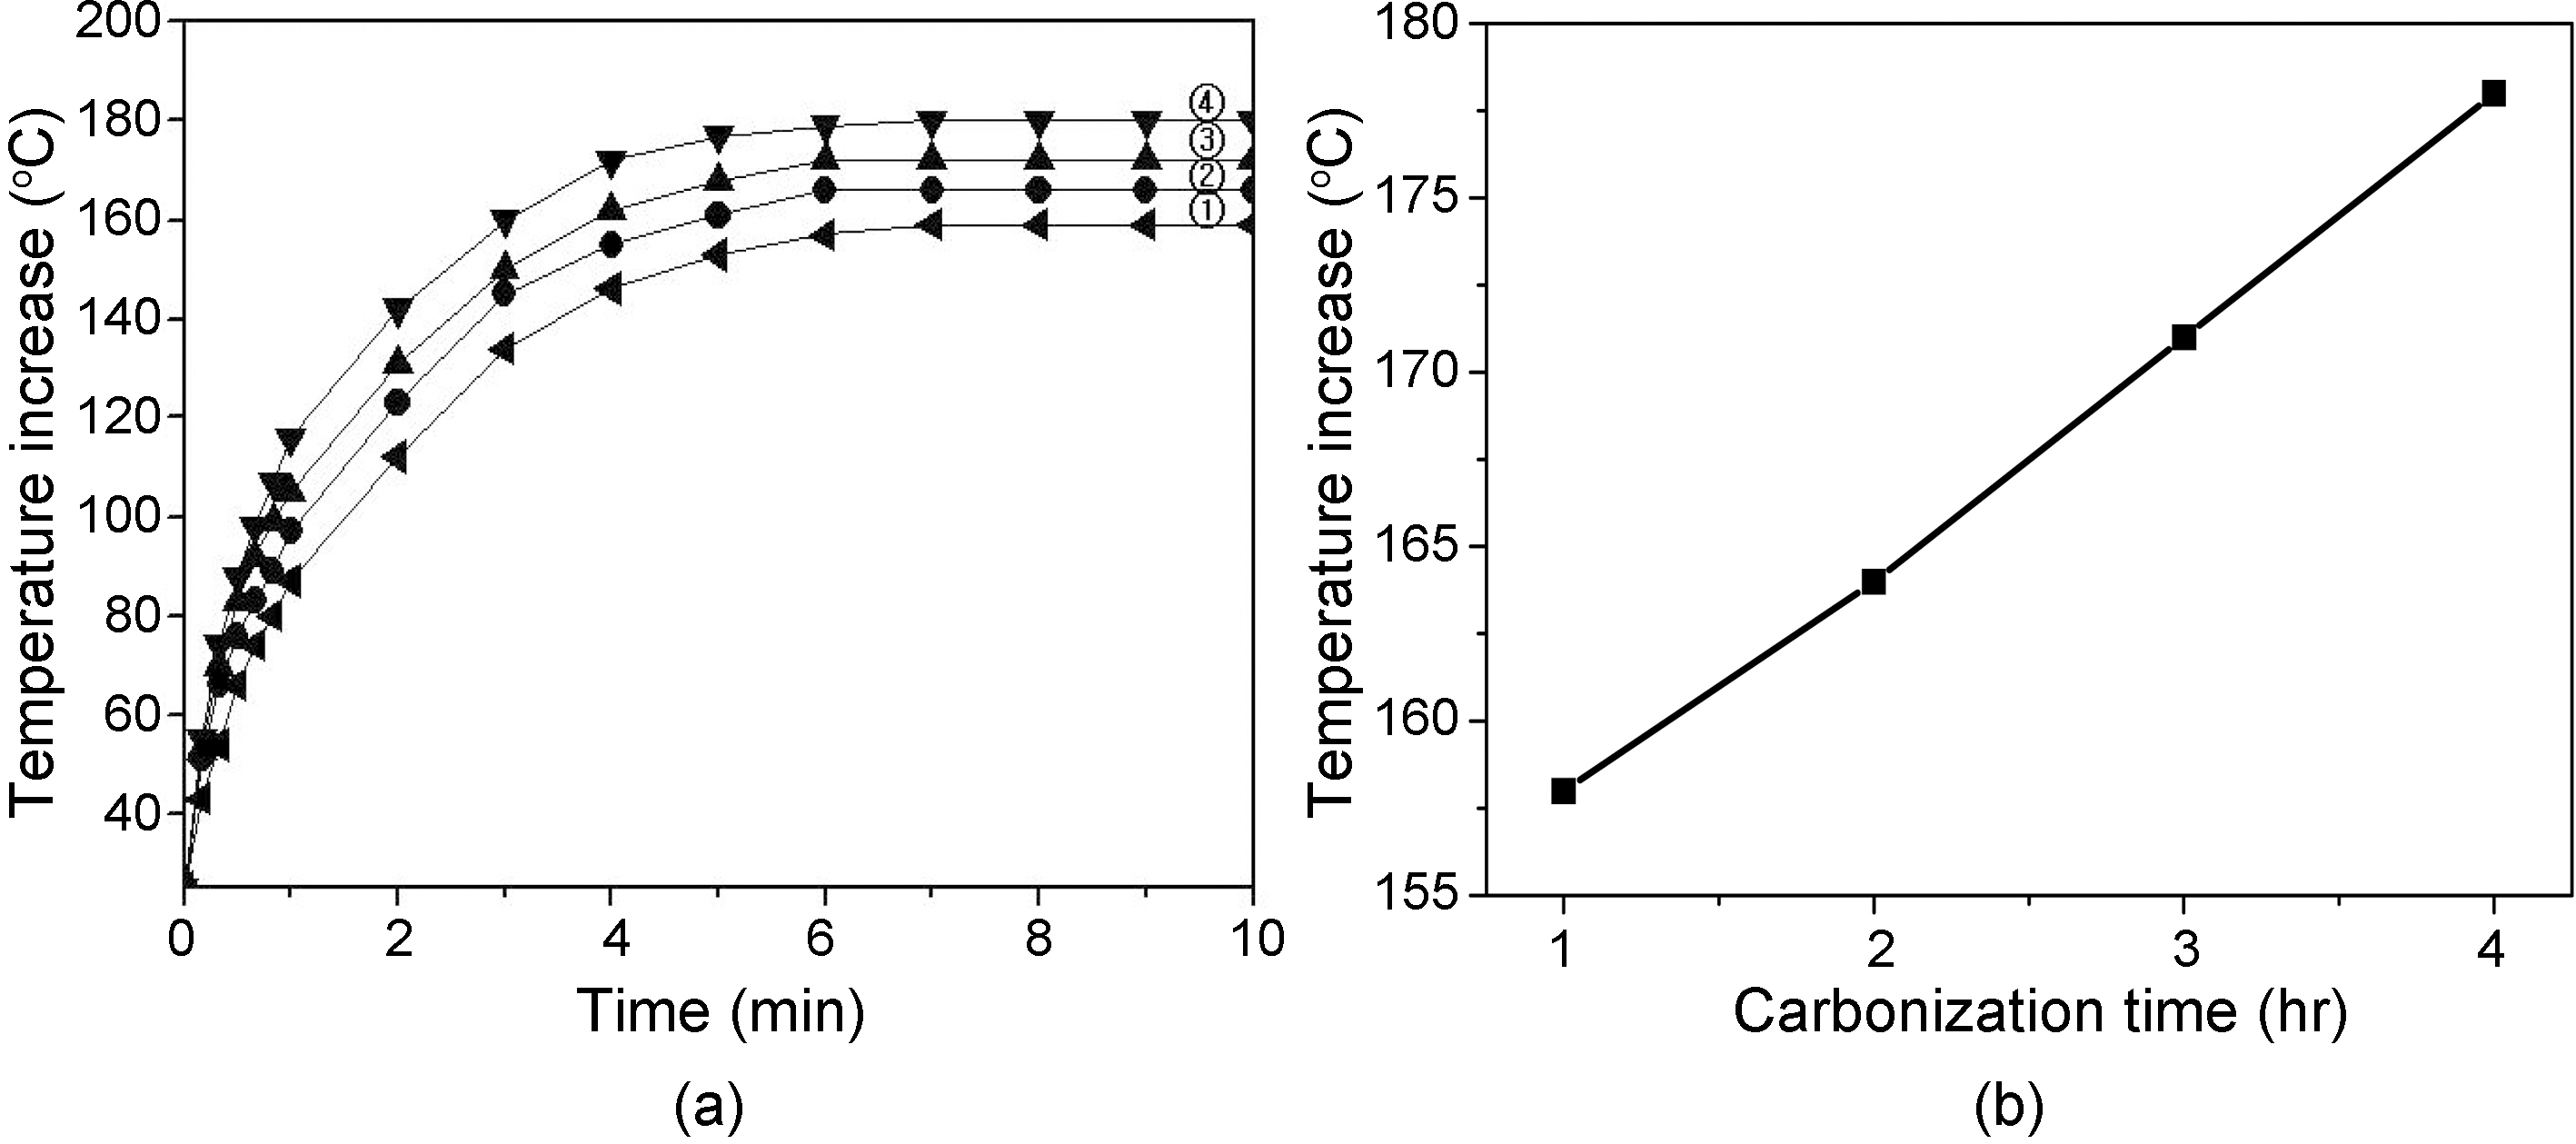
Fig. 6 shows (a) temperature increase of carbon fiber tow prepared at different carbonization time at 1000℃ as a function of contact time, 5 V, and (b) relationship between temperature increase and carbonization time at 10 min contact time of Fig. 6(a). Temperature of fiber tow linearly increased as increasing the contact time of thermocouple to fiber tow. Also, the temperature increased as increasing the carbonization time. The temperature become constant after 7 min. contact time for all the fiber tows.
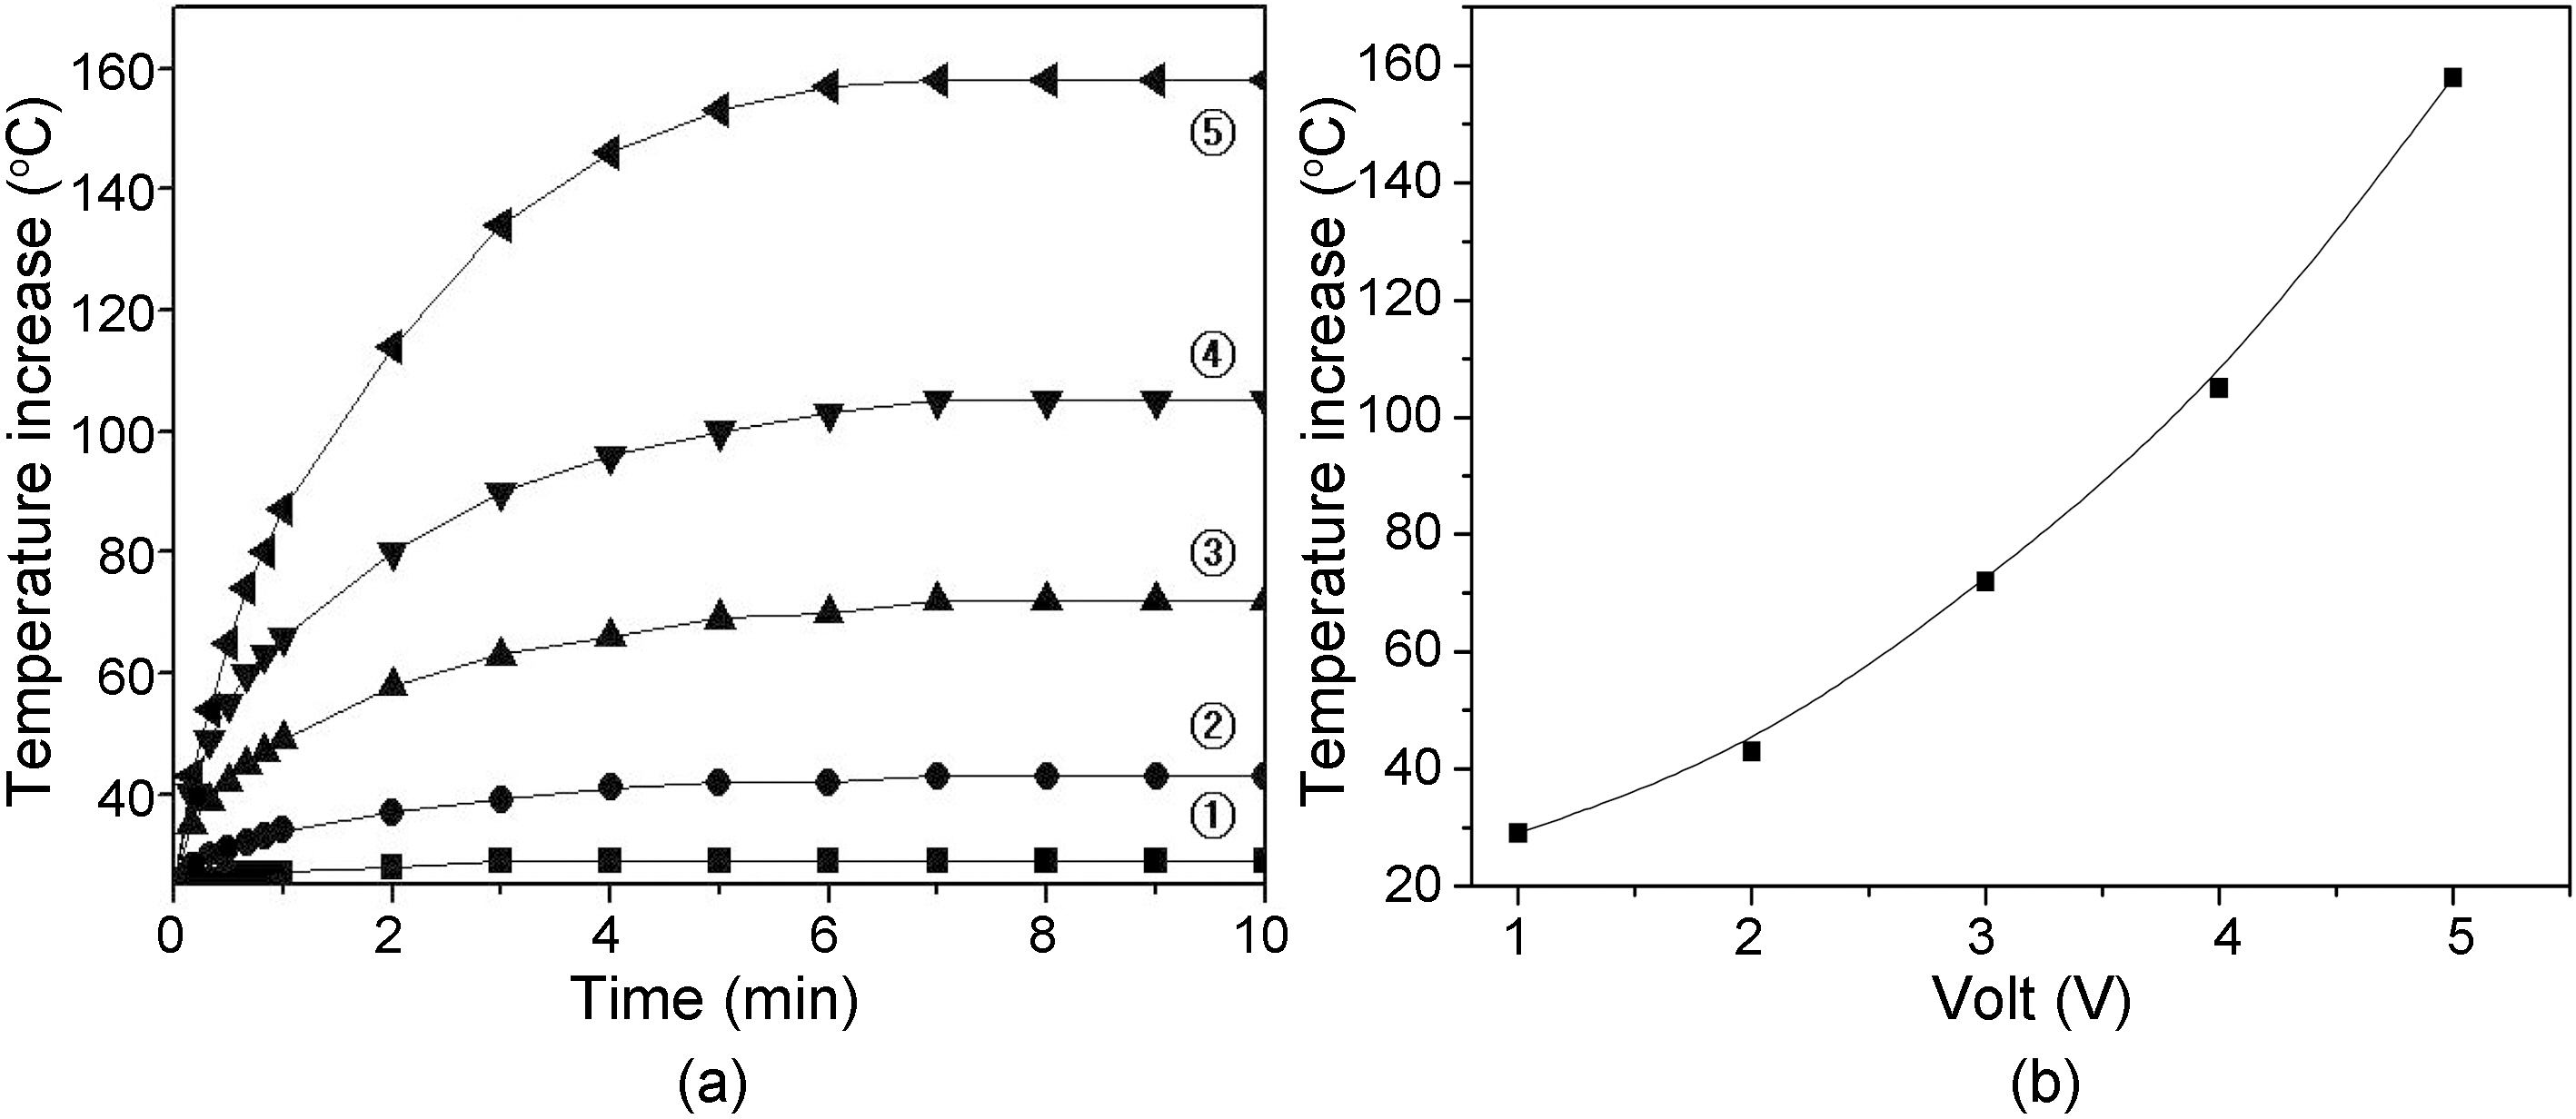
Fig. 7 shows (a) temperature increase of carbon fiber tow
prepared at 1000℃, 1 hr as a function of contact time and electrical voltage, and (b) relationship between temperature increase and voltage at 10 min contact time of Fig. 7(a). Temperature of fiber tow increased at an exponential rate as increasing the voltage. Also, the temperature become constant after 7 min contact time for all the fiber tows.
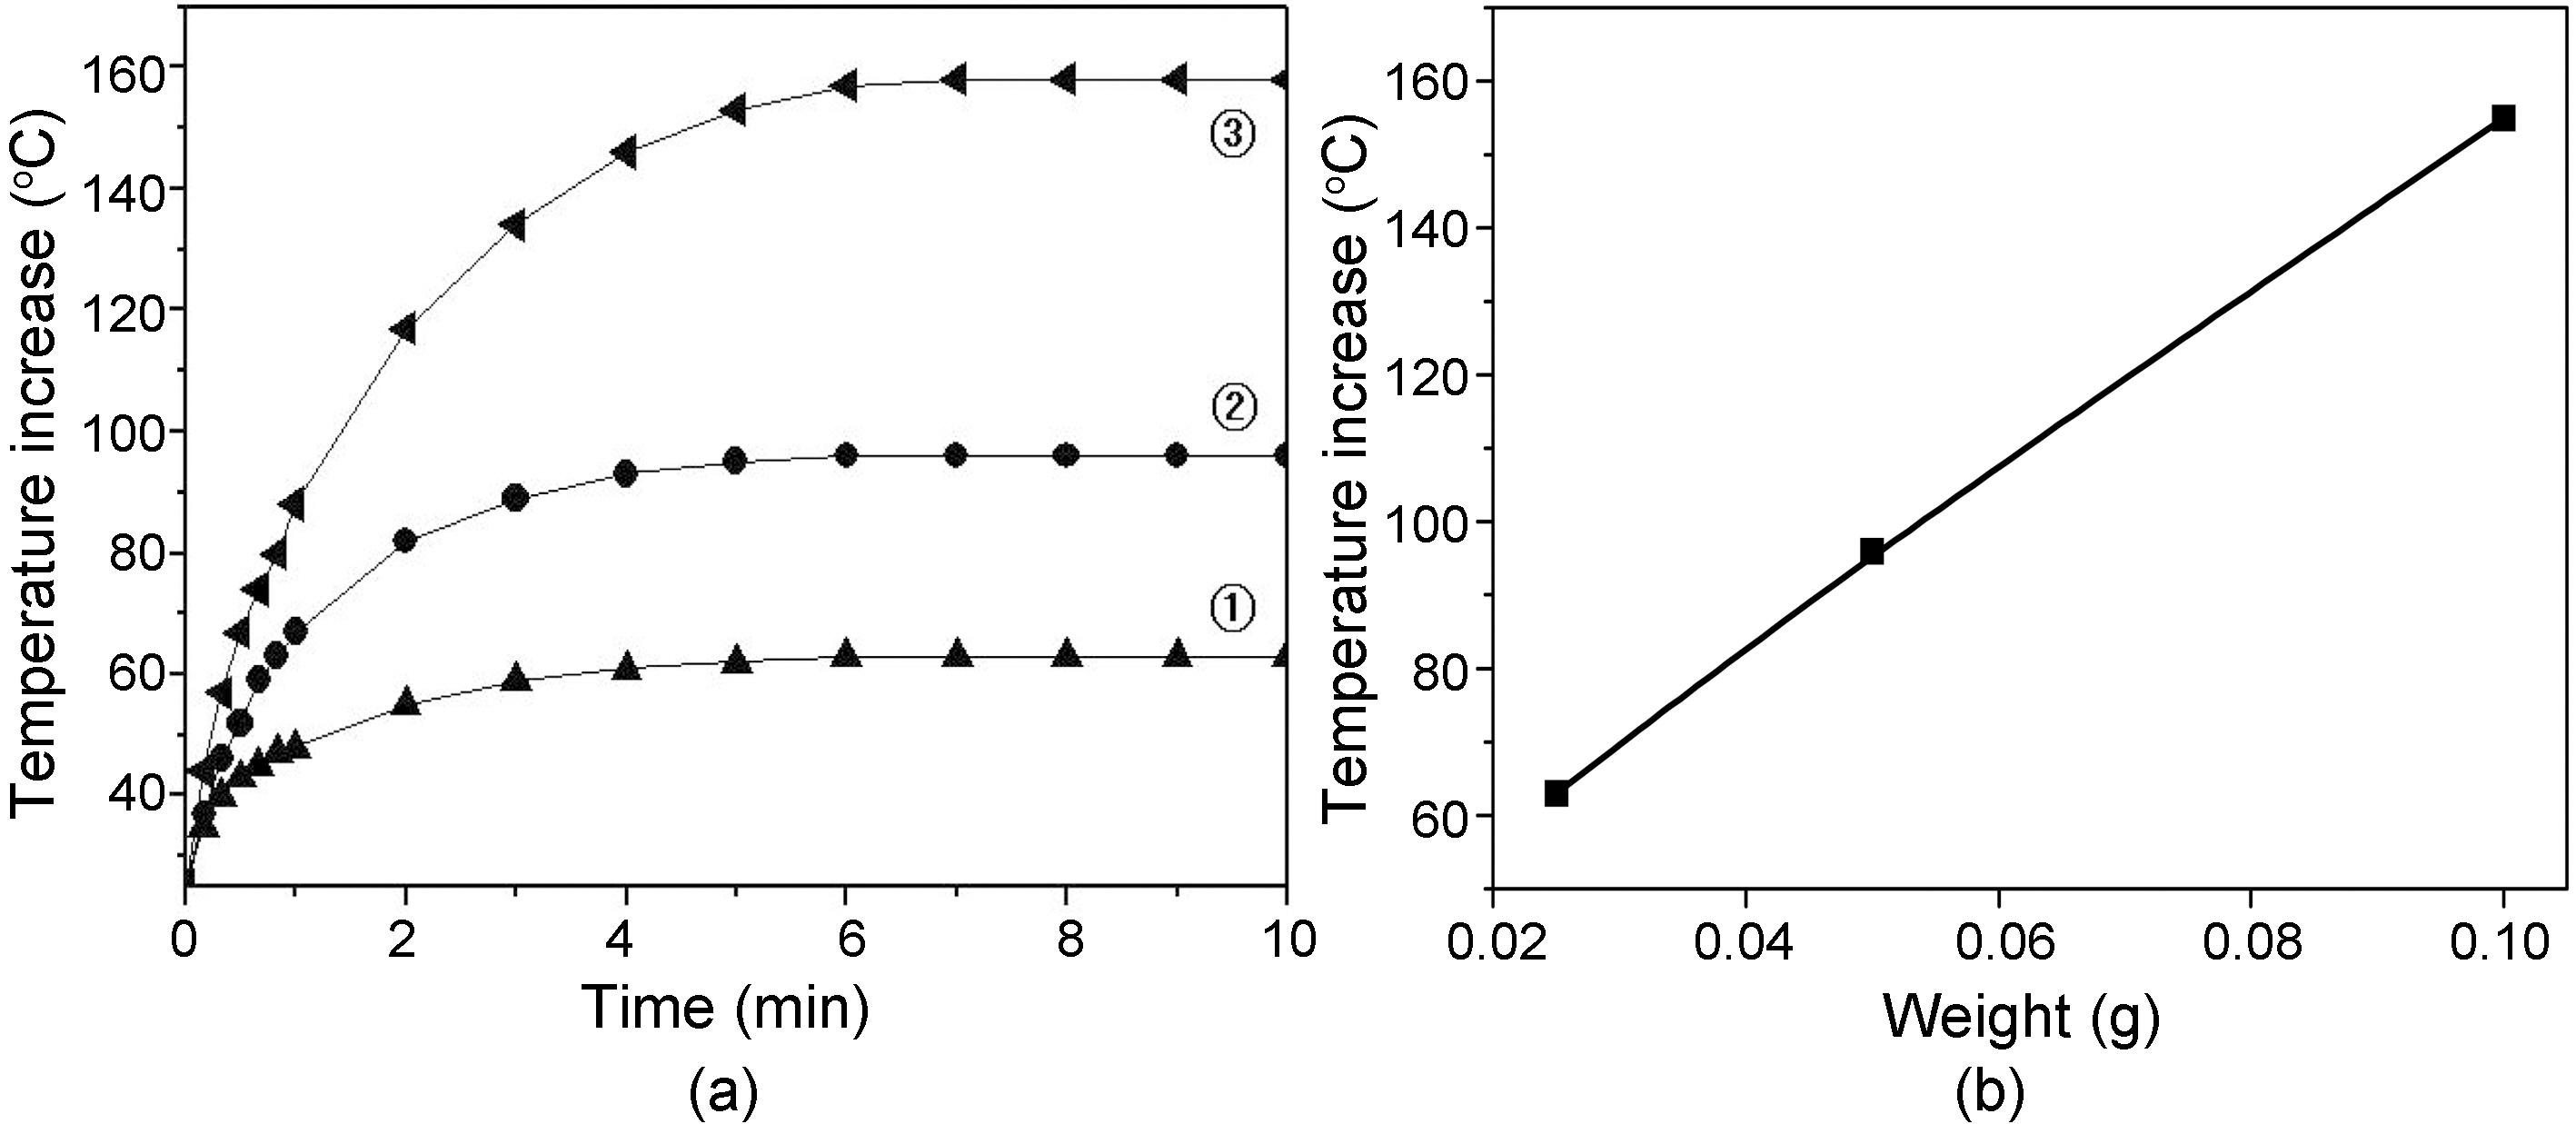
Fig. 8 shows (a) Temperature increase of carbon fiber tow prepared at 1000℃, 1 hr as a function of contact time and fiber mass, and (b) relationship between temperature and fiber mass at 10 min. contact time of Fig. 8(a). Temperature of fiber tow increased at an linear rate as increasing the fiber mass, and become constant after 7 min. contact time for all the fiber tows. Temperature increase is due to the increase of exothermic heat area by increasing the fiber mass.
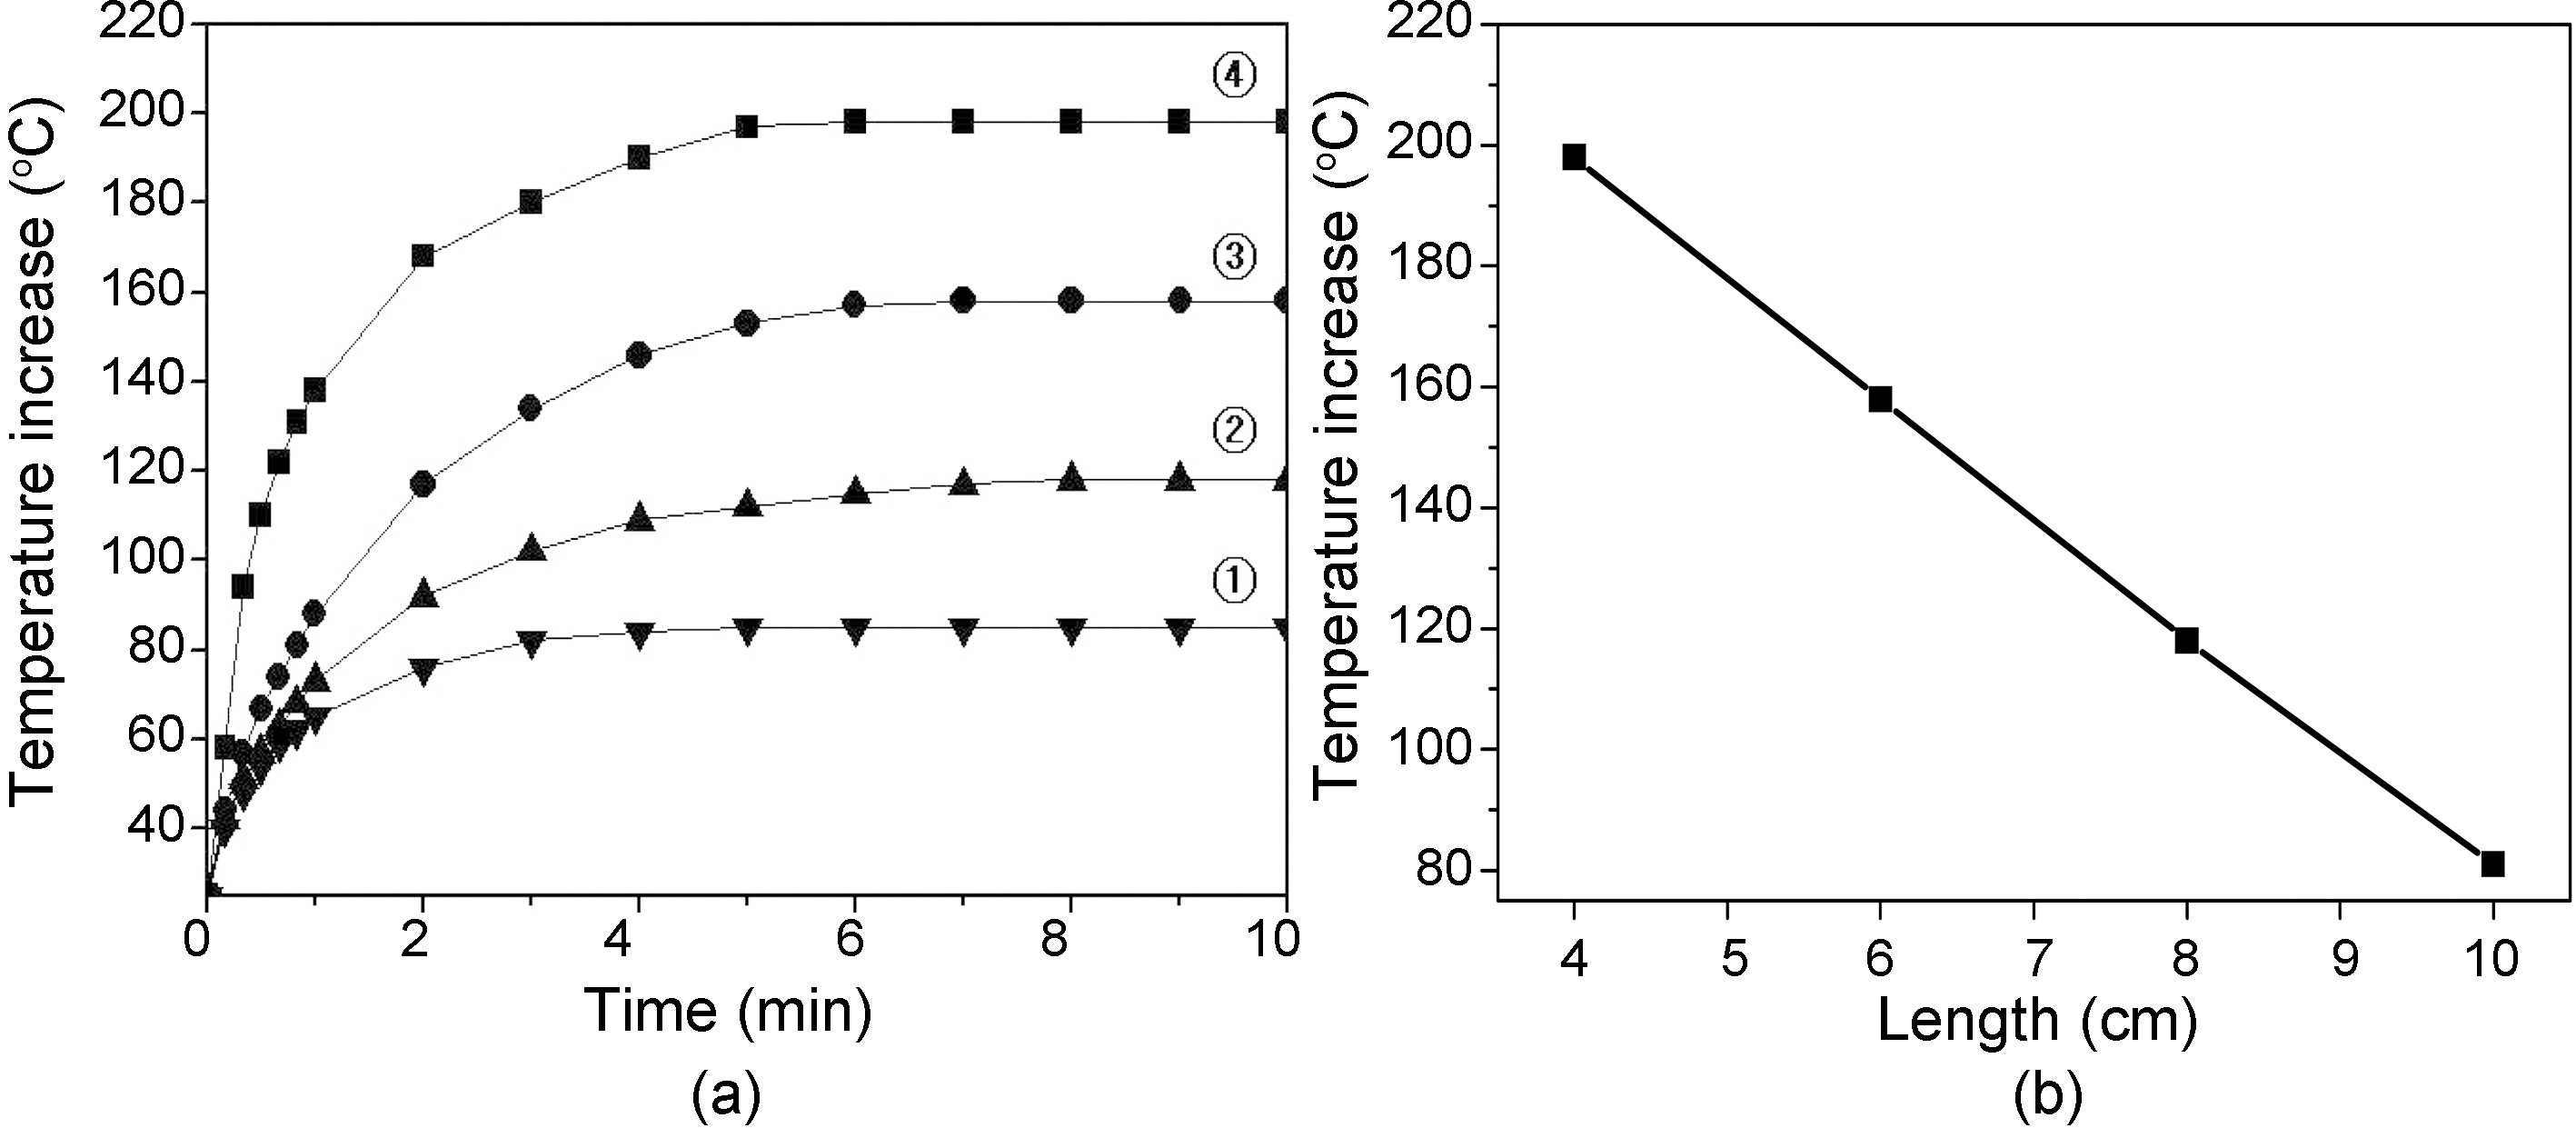
Fig. 9 shows (a) Temperature increase of carbon fiber tow prepared at 1000℃, 1 hr as a function of contact time and fiber length, and (b) relationship between temperature and fiber length at 10 min contact time of Fig. 9(a). Temperature of fiber tow decreased at an linear rate as increasing the fiber length, and become constant after 7 min. contact time for all the fiber tows. Temperature decrease is due to the increase of electrical resistivity by increasing the fiber length.
The relationship between exothermic heat and carbon contents of pitch-based carbon fiber was investigated by changing the carbonization conditions. The carbon contents and the crystallinities of isotropic pitch-based carbon fibers were 86.8~93.8 wt% and 33.7~40.1%, respectively, which were linearly proportional to the increase of carbonization temperature from 700~1000℃. The exothermic heat (temperature increase) of fiber tows were also linearly proportional to the increase of carbon contents due to the increase of crystallinity. Therefore, the carbon content of fiber can indirectly be estimated by measuring the surface temperature increase of fibers.