Unlike most organic pollutants, heavy metals (HMs) are generally refractory and cannot be degraded or readily detoxified biologically. Due to their common presence in industrial applications, HMs end up being discharged into lakes and streams or being washed into water body during a rain event. There, they bioaccumulate in the food chain,posing a threat to public health and wildlife [1]. The harmful effects of HMs, deposited and accumulated in the human body, cause disorders and damage in several organs, especially in the liver, pancreas, myocardium, kidney, basal ganglia of the brain, eyes and the skeleton [2]. In addition, other environmental impacts include the reduction of ecosystem diversity, plant and animal death, and reduced rates of reproduction in affected organisms. Consequently, the EPAs phase II (October 1999) seeks to further minimize the discharge of HMs and other pollutants, through extending current regulations to acquire the employment of best management practices (BMPs) to control discharging concentrations of the more dangerous HMs to become zero from any source, direct or indirect [3]. The most common HMs in residual water were highlighted as arsenic, cadmium, chromium, copper, lead, mercury, nickel and zinc. Cadmium and mercury are two of the most toxic metals present in the aqueous environment, hence the maximum permissible concentrations in drinking water has been set at 5 and 1 μg·l-1 (ppb), respectively [4].
Cadmium is introduced into bodies of water from smelting,metal plants, Cd-Ni batteries, phosphate fertilizers, mining, pigments, stabilizers, alloy industries and sewage sludge. Similarly, copper is discharged from same sources, and its deposition and accumulation in the human body causes damage in several organs leading to Wilson's disease (hepatolenticular degeneration) [2].
Technologies being used for the treatment of large volumes of dilute metal ion-containing solutions, including chemical precipitation, coagulation, membrane processes, and ion exchange, are often unable to meet the new and more stringent requirements or have the drawback of being very expensive. Adsorption has been shown to be an economically feasible alternative method for removing trace metals from wastewater and water supplies, and denoted as the Best Available Technique [5]. Sorption (adsorption, ion exchange, complexation) utilizing adsorbing filter media, proved an attractive option for small business, industries or municipalities, to treat wastewater or runoff. Through the physical and chemical processes of sorption it is possible to remove significant portion of the total metal concentration, thus lowering the effluent concentration to a level which will be detrimental to public health and environmental quality [5].
A variety of materials have been investigated for the removal of metals from metallurgical effluents. Conventional activated carbons (ACs) are extensively used in water treatment of color, odor and organic contaminants [6]. These carbonaceous materials also proved to possess the potential for removal of inorganic species from effluent streams. Accordingly, in the last few years, adsorption onto activated carbon attracted much attention with respect to the removal of trace metal ions from wastewater and water [7-15].
Methods for the production of ACs are conventionally divided either to thermal (steam or CO2), or chemical (ZnCl2 or H3PO4) activation. Activation with H3PO4 has been the most favorite technique during the last two decades [16-26], most of them were concerned with porosity characteristics and the uptake capacity towards various organic contaminants from the aqueous solution. However, previous studies focused on the thermal treatment of the impregnated precursor under its own atmosphere. Since the uptake of metal species are generally associated with the presence of surface O-functional groups, modification of the parent carbons was achieved for this purpose by post-oxidative treatment (air, KMnO4, H2O2, HNO3, and persulphoric acid) [16]. A modified method was developed involving concurrent phosphoric acid activation and air oxidation at temperatures between 400 and 500℃ (denoted as air activation) [27-30]. Such treatment provided appreciable quantity of surface functional groups and the highest metal uptake. Thus, there was no discrete oxidation step separate from the pyrolysis and activation steps as in the “standard” or “continuous” methods [28]. This strategy of activation was done to test the hypothesis that air atmosphere would not reduce surface area and may obviate the need for a separate air oxidation step, thus greatly reducing the time and material needed for producing high surface area activated carbons with metal adsorption capabilities.
Our object in this study is to test the batch metal uptake capacity of Cu (II) and Cd (II) by a H3PO4-activated plant by-product (activation only of peach stones) and its airactivation counterpart. Correlations to the porous and chemical properties and type of metal ion are also displayed. A matrix effect analysis was applied in a trial to correlate the metal adsorption capacity to the contact time (CT), initial concentration (Co) and carbon dose (CD) [31]. Several techniques of physico-chemical characterization were used to support the observed results.
Two carbons (AC1 and AC2) were derived from peach stone shells under chemical activation scheme by impregnation with 50% H3PO4 followed by pyrolysis for 2 h at 500℃. The former (AC1) was pyrolyzed under its own decomposition gases and the latter (AC2) under forced air [26]. Produced carbons were thoroughly washed by hot distilled water and decanted until washings were near to pH 6.5 and finally dried at 110℃. Both carbons were characterized for their ash content, slurry pH and elemental analysis (C, H, O, by a VARIO Microanalyzer System). In addition, thermogravimetry was recorded at a heating rate of 10℃/min up to 1000℃ in static air, using a Perkin-Elmer 7 Series Thermal Analysis System. FTIR spectra were recorded, as well, by the KBr disc technique in the range 4000-400 cm-1 using a Nexus 670 FTIR Spectrophotometer (Nicolet, USA).
To evaluate the porous characteristics, the adsorption isotherms of N2 at 77 K were determined using a sorptometer type Gemini 2375 V3.03 (Micromeritics). Various porosity parameters were estimated by applying the αs-method [32]; these are: the total surface area (Sαt, m2/g), non-microporous surface area (Sαn, m2/g), micropore volume (Vαo, cm3/g), total pore volume (VP, cm3/g) at P/Po=0.95, mesopore volume (Vmeso=VP-Vαo, cm3/g), and microporous surface area (Sαmic=Sαt-Sαn, m2/g).
Copper and cadmium were purchased in pure standard solutions in concentration 1000 mg/L from Merck, 64271 Damstadt, Germany. Subsequent dilution was carried out to required concentrations using double distilled water (DDW). Batch adsorption studies were determined at ambient temperature using the two solutes and the two sorbents in single ion experiments. Three amounts of each activated carbon (100, 200, and 250 mg) were individually weighed and transferred into glass bottles and 100 ml of each metal (10, 20, and 50 mg·l-1) in aqueous solution, were separately added. After a contact time of 24, 48, and 72 h under agitation, the slurry was centrifuged for 10 min at 1500 rpm, filtered using whatmann filter paper no.44 to remove the sorbents.
The removal efficiency (% R) of either metal was calculated according to the following equation:
where
3.1. Characteristics of the activated carbons under consideration
The two major properties of activated carbons are their
[Table 1.] Some Physicochemical Properties AC1 and AC2
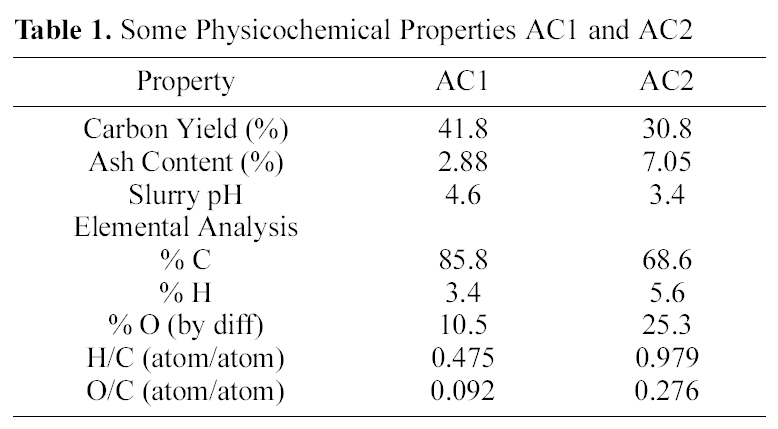
Some Physicochemical Properties AC1 and AC2
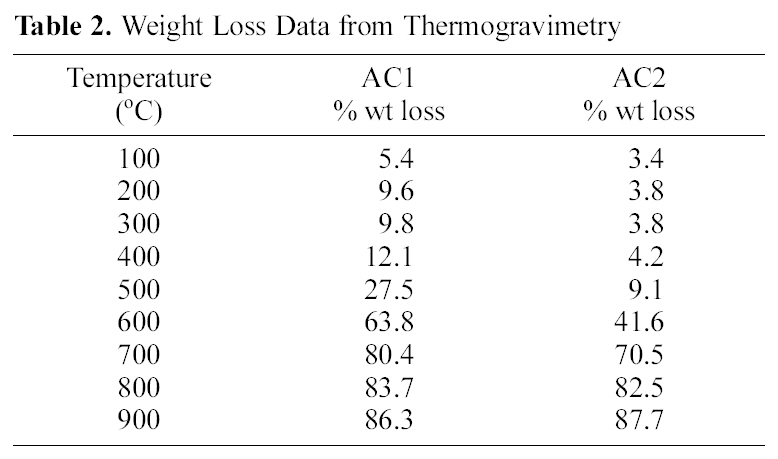
[Table 2.] Weight Loss Data from Thermogravimetry

Weight Loss Data from Thermogravimetry
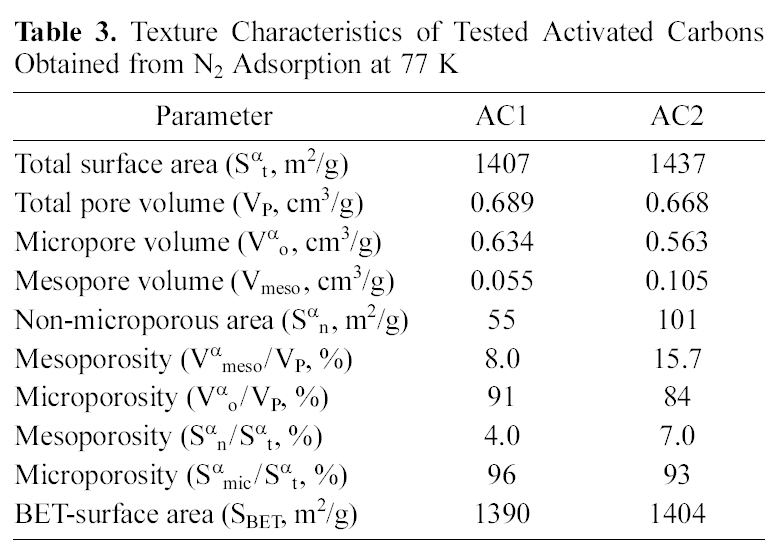
surface area and internal porosity, as well as the surface chemical structure. Both determine and control the adsorption capacity in aqueous media of organic and inorganic species. The tested carbons, AC1 and AC2, are excellent adsorbents (Table 3) with high surface areas (Sαt), total internal porosity (VP) and extensive microporosity (Vαo/VP and Smic/Sαt, 0.85-0.95).
Flowing air, during pyrolysis at 500℃, leads to carbon gasification which reduces the carbon yield (%Y), raises the ash content (Table 1) and decreases the content of micropores(Table 3) from 0.96 to 0.93 (Smic/Sαt) or from 0.91 to 0.84 (Vαo/VP). The apparent small differences between AC2 and AC1 seem to be a higher ash content (Table 1) and
[Table 3.] Texture Characteristics of Tested Activated Carbons Obtained from N2 Adsorption at 77 K

Texture Characteristics of Tested Activated Carbons Obtained from N2 Adsorption at 77 K
mesoporosity properties (Vmeso and Sαn, in Table 3), although no other strong changes appear in the porosity characteristics.
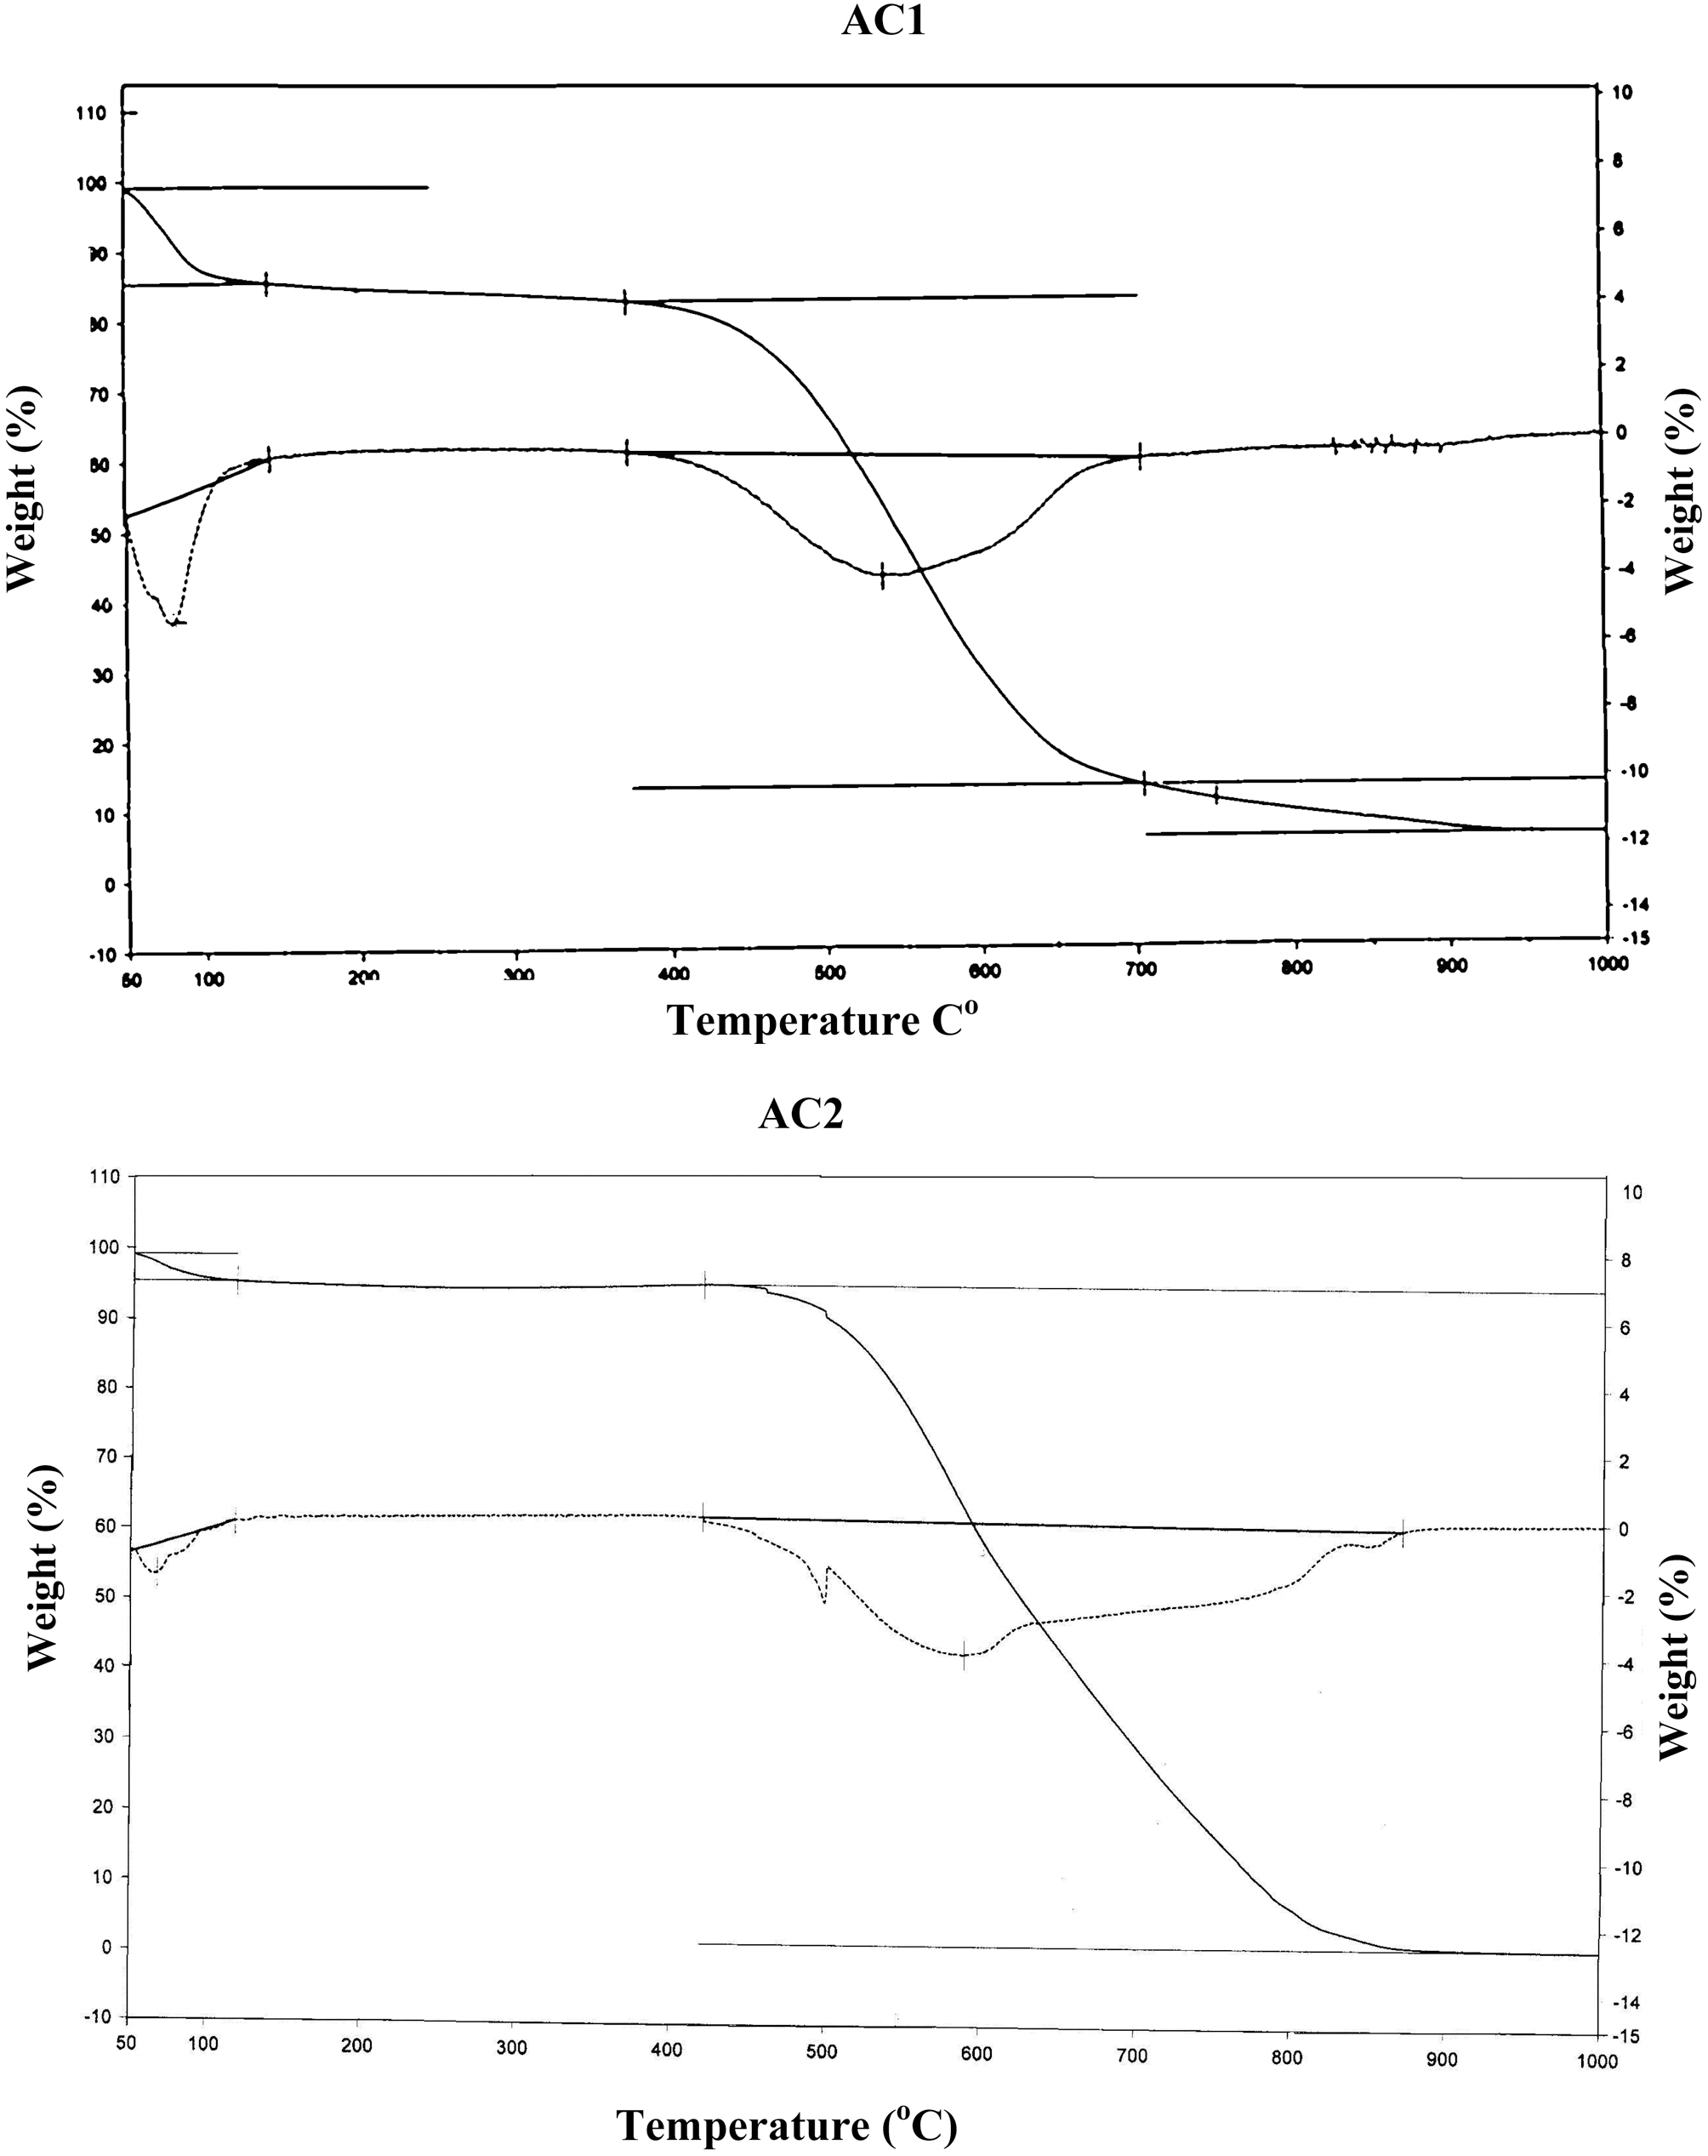
On the other hand, the impact of air flow, during pyrolysis, on the surface chemical properties, was ascertained by the determined slurry pH, TG/DTG, FTIR and elemental analysis. The effect of air atmosphere leads to enhanced gasification of carbon associated with decreased yield (Table 1) and generation of O-functionalities imparting surface acidity. This is achieved by reduction of carbon (elemental from 86 to 69%), reduction of yield (Y=42 to 31%) and enhanced acidity (pH from 4.6 to 3.4). Such effect is meanwhile, reflected on the production of a more stable solid carbon (fixed carbon) as noticed by the lower loss in weight exhibited on the TG curve (Fig. 1), which shifts to higher temperatures (
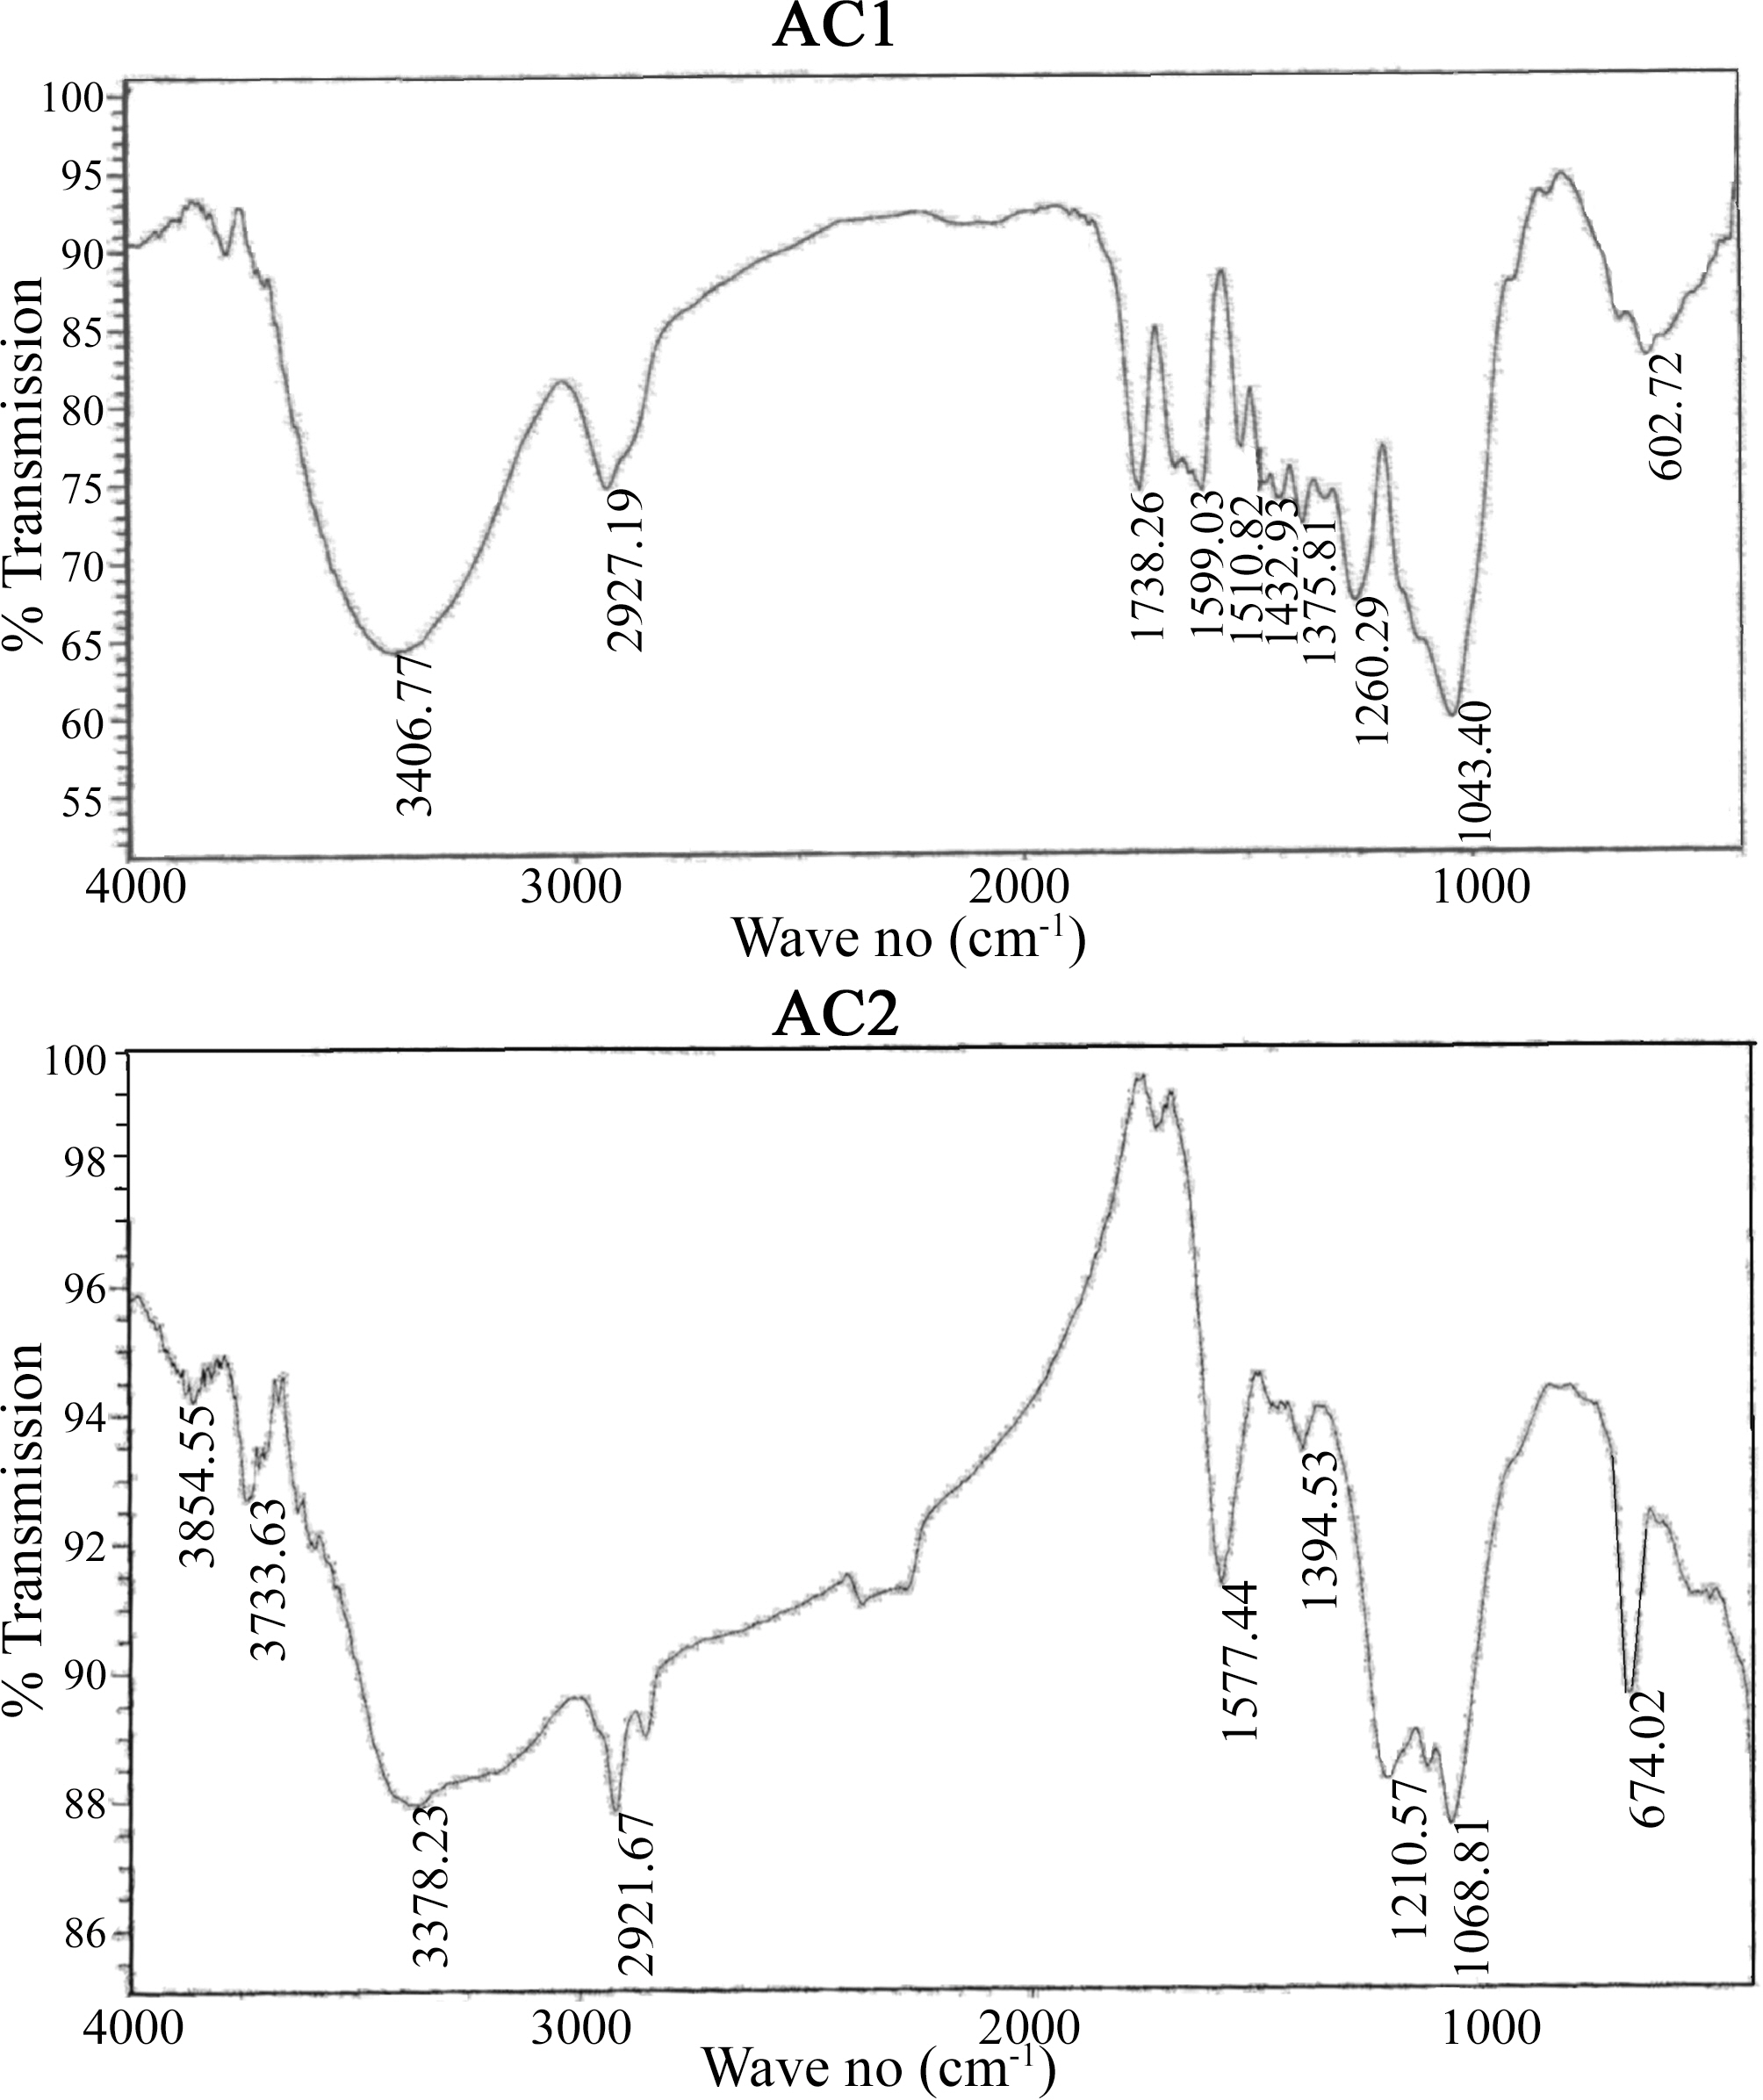
Comparison of the two FTIR spectra (Fig. 2) indicates considerable variation in the form and intensity of bands within the range of 1750-1000 cm-1, for AC1 and AC2. Most of the bands in this region is well established and assigned to several O-functionalities (C=O, CO-O, C-OH, C-O-C) [33-40], which confirm their clear abundance. A small sharp peak at 1370 cm-1 is usually ascribed to C=O stretching vibrations of ketones, aldehydes and carboxyls. A strong band at 1600-1580 cm-1 is associated with aromatic ring vibration (C=C) enhanced by polar functional groups. Small sharp bands at 1300-1000 cm-1 have been assigned to C-O stretching in acids, alcohols, phenols, ethers and esters [38]. In addition, absorption in this region has been attributed to phosphorous and phoso-carbonaceous compounds. These show peaks at 1220, 1180, 1080, 1000-900 cm-1, ascribed to P=O, P-O-C, P=OOH, P-O-P, P-O, P-OH, and several phosphate complexes [33-40]. Such groups exhibit strong acidic behaviour and very stable, chemically and thermally. Acidic sites on H3PO4-activated and oxidized carbon surfaces are composed acid groups (phosphorous containing, carboxylic and phenolic) [38-40]. Among them phosphorous-containing groups are the most important for the adsorption of heavy metal ions from aqueous solution.
The above results are supported by the higher oxygen content of AC2 than AC1 (cf. 25.3 and 10.5% or O/C of
0.092 and 0.276, respectively). Thus, AC2 is highly enriched by oxygen incorporated in the carbon matrix, and expected to affect the metal ions uptake.
3.2. Impact of various variables on removal of Cu (II) and Cd (II) ions
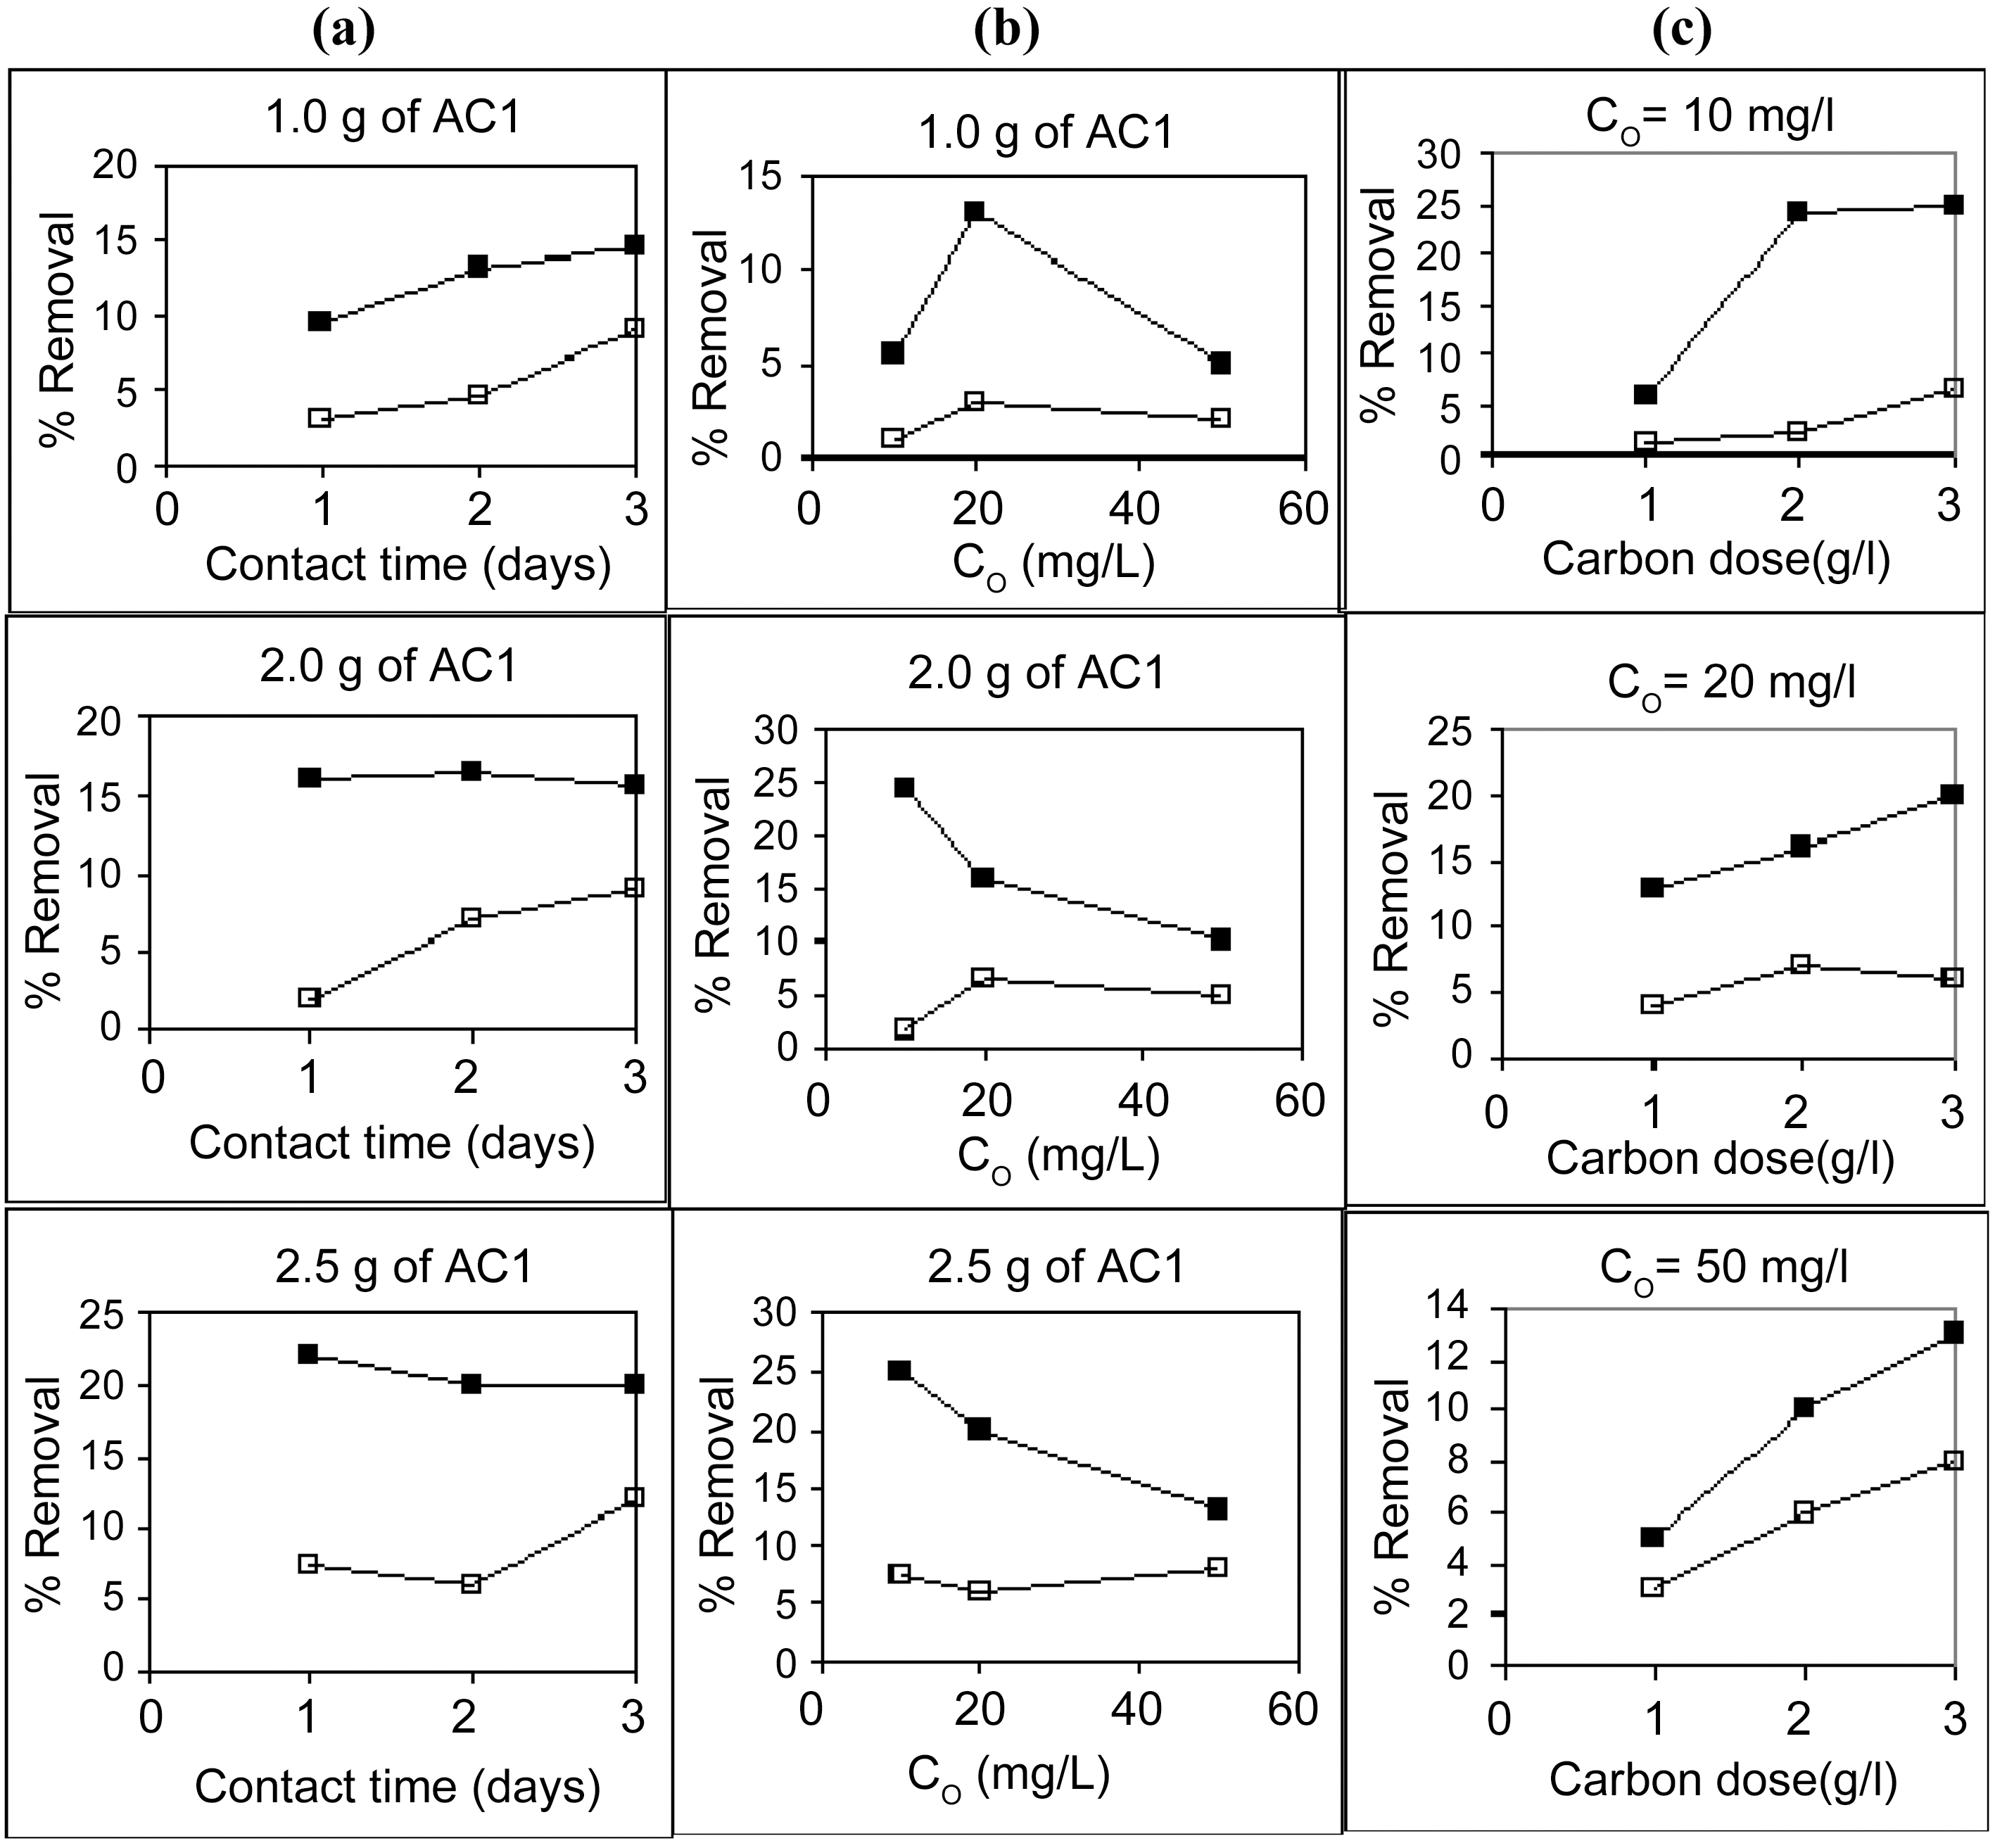
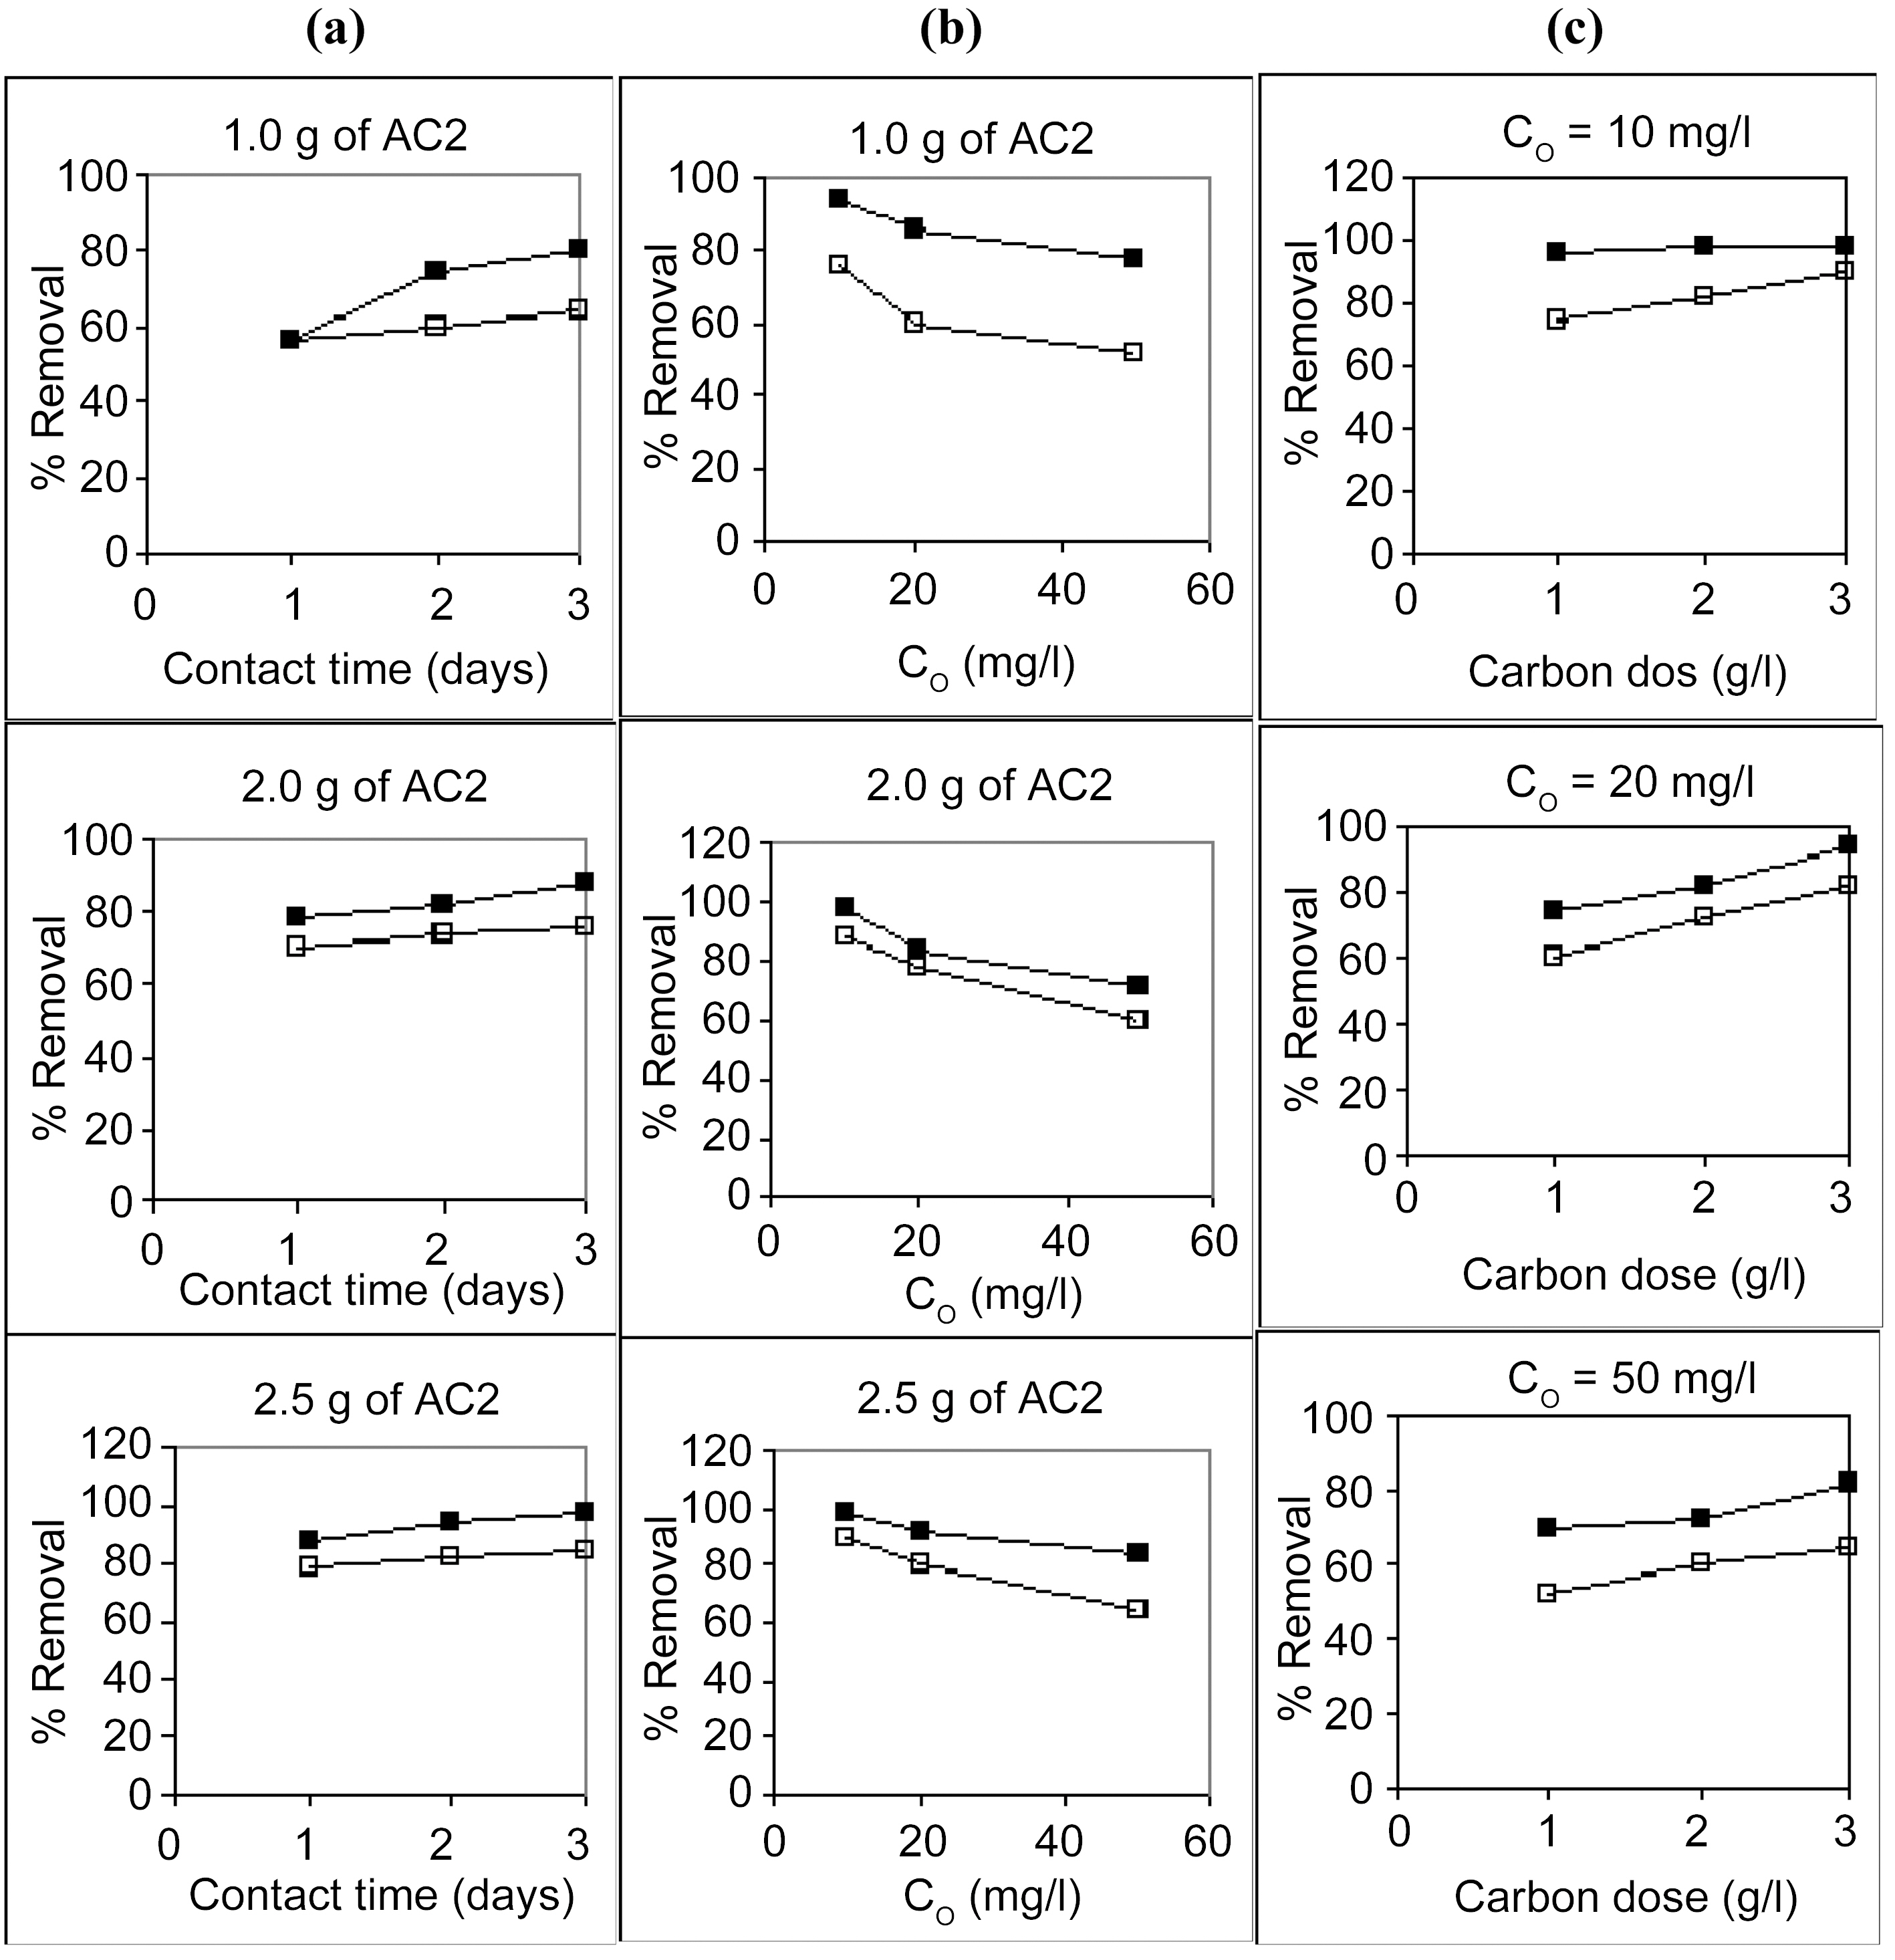
Starting with 100 ml solutions containing 10 up to 50 mg/L, from either cations, and contacted with 100~250 mg AC, the removal capacity was determined. Fig. 3 and 4 illustrate representative uptake values (% removal) as function of contact time (CT), initial concentration (Co), and carbon dose (CD).
Carbon AC1 is a poor adsorbent for both metal ions, where it removes only around 5~30% of copper and 1~12% of cadmium in the aqueous solution. Carbon AC2 shows considerably higher capacity for sequestration of either metal ion where copper is removed within 60~100% and cadmium from 50 up to 91%. Prolonged contact with the adsorbent improves the metal ions uptake at all initial concentrations (Fig. 3a, b & c). Although metal ions removal is generally experienced to be a fast process, where equilibrium is attain-
ed within few hours, yet in the system under consideration it appears to be much slower, needing up to 72 h. This might be ascribed to the predominant micro porosity (Table 3) characterizing both carbons (84~91%) which causes porediffusion to be the rate determining step for metal ions adsorption. Micro porosity < 2.0 nm naturally would control the diffusion of the hydrated Cu(II) & Cd(II) ions surrounded by 6 water molecules. This delays the final stage of metal adsorption into the internal micro pores to such long periods of equilibrium.
Increasing the initial metals concentration from 10 to 50 mg/L is normally expected to show a decline in percent removal, as observed in Fig. 4 (a , b &c) for AC2. However, in case of AC1 (Fig. 3a, b & c) the apparent trend is somewhat reversed, where removal percentage is abnormally increased with an increase in ions concentration in solution. In the former case (AC2), a limited high number of adsorption sites are assumed to be available for the adsorption process where surplus ions are left in solution with increased initial concentration. Whereas a very low amount of sites are involved in ions uptake (Cu (II) and Cd (II)), however, an increase in their abundance increased their diffusion during
the different stages of adsorption.
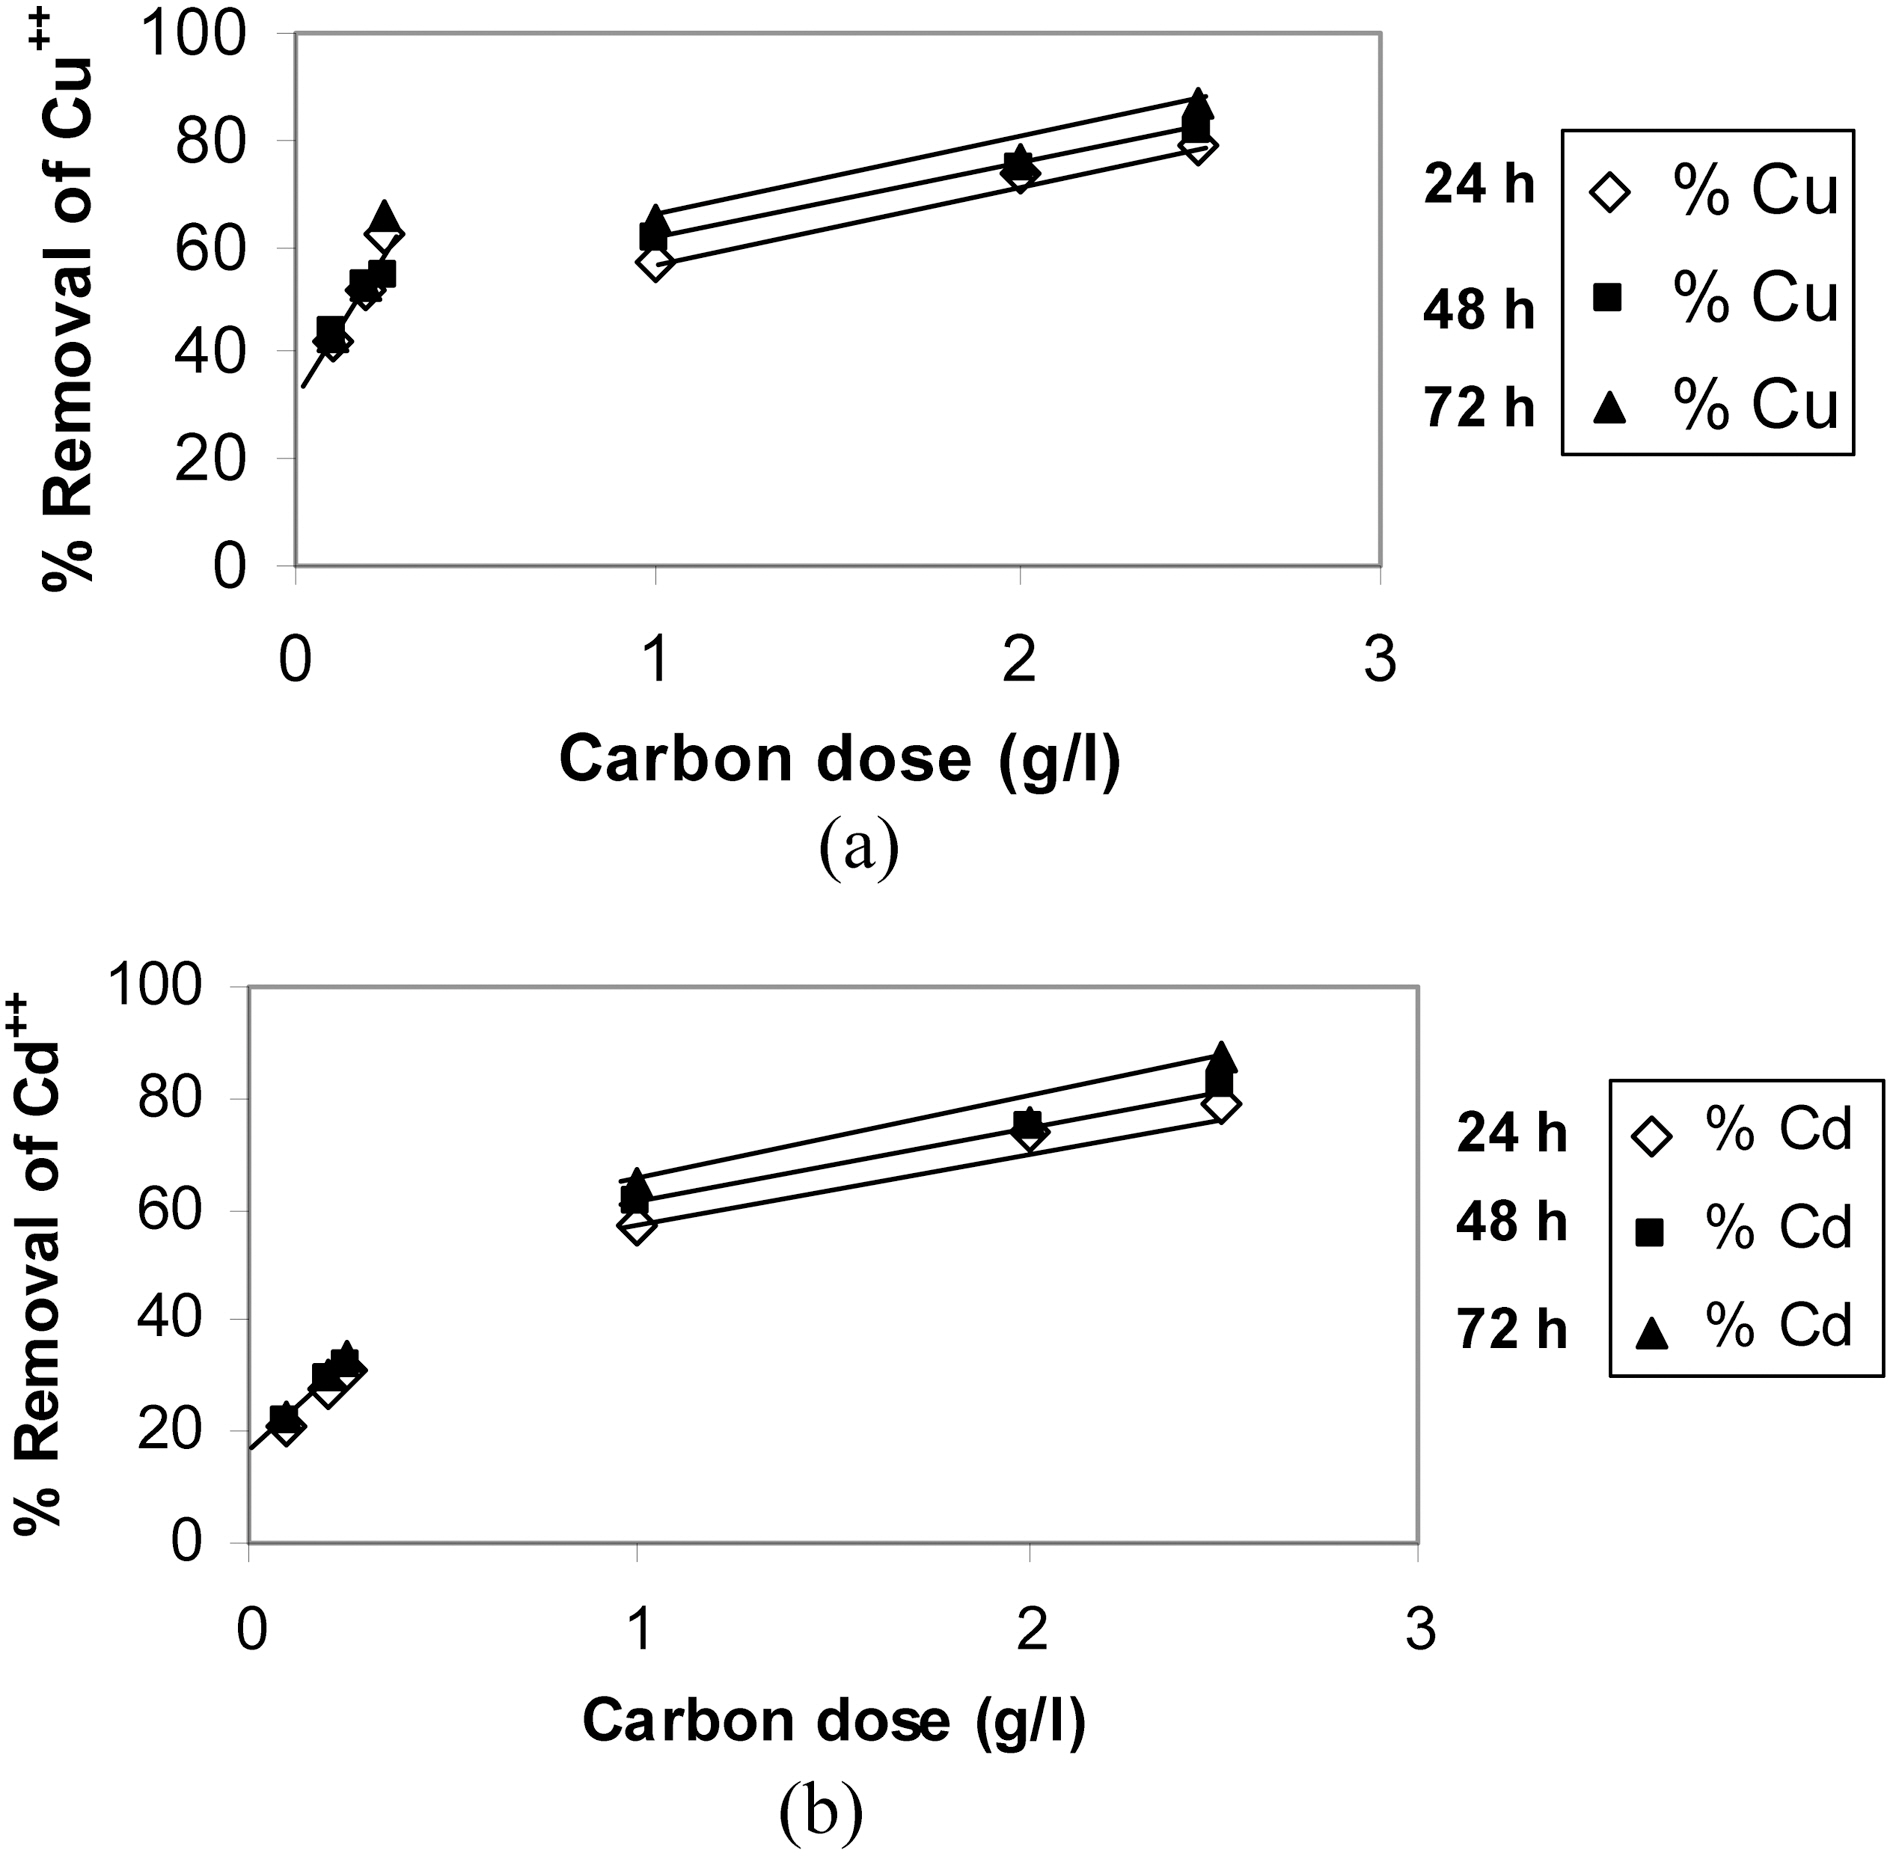
Raising the carbon dose (from 1.0 to 2.5 g/L) is generally associated with an increase in percent removal (Fig. 5a & b). This should be due to the increase in the adsorption sites on the carbon surface but not proportional to the added mass of adsorbent.
A series of experiments was carried out at lower carbon doses (1/10 of above experiments). A selected contaminant
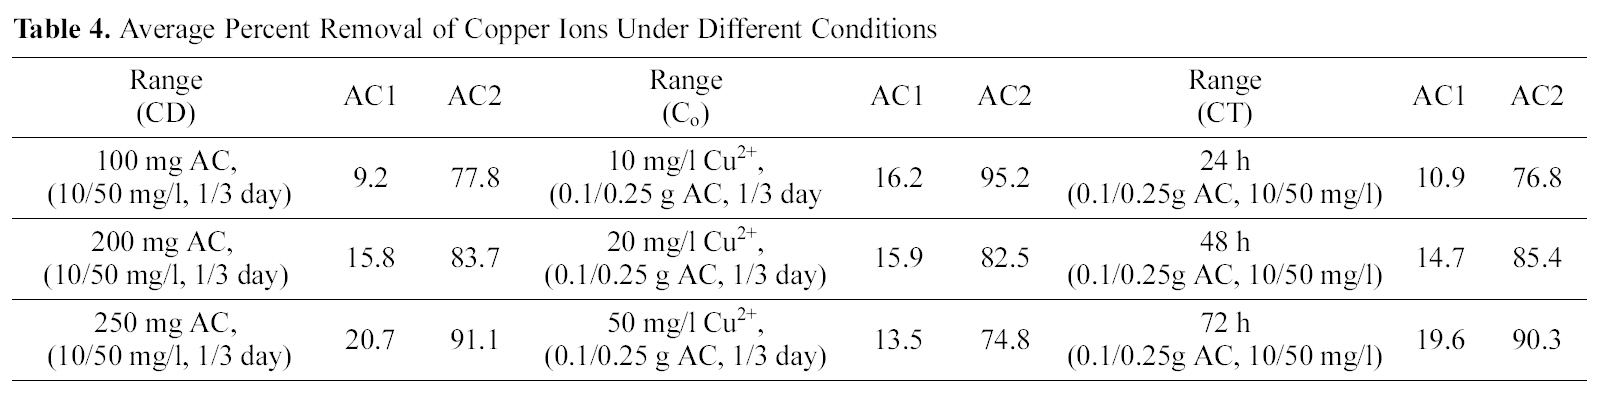
[Table 4.] Average Percent Removal of Copper Ions Under Different Conditions

Average Percent Removal of Copper Ions Under Different Conditions
[Table 5.] Average Percent Removal of Cadmium Ions Under Different Conditions
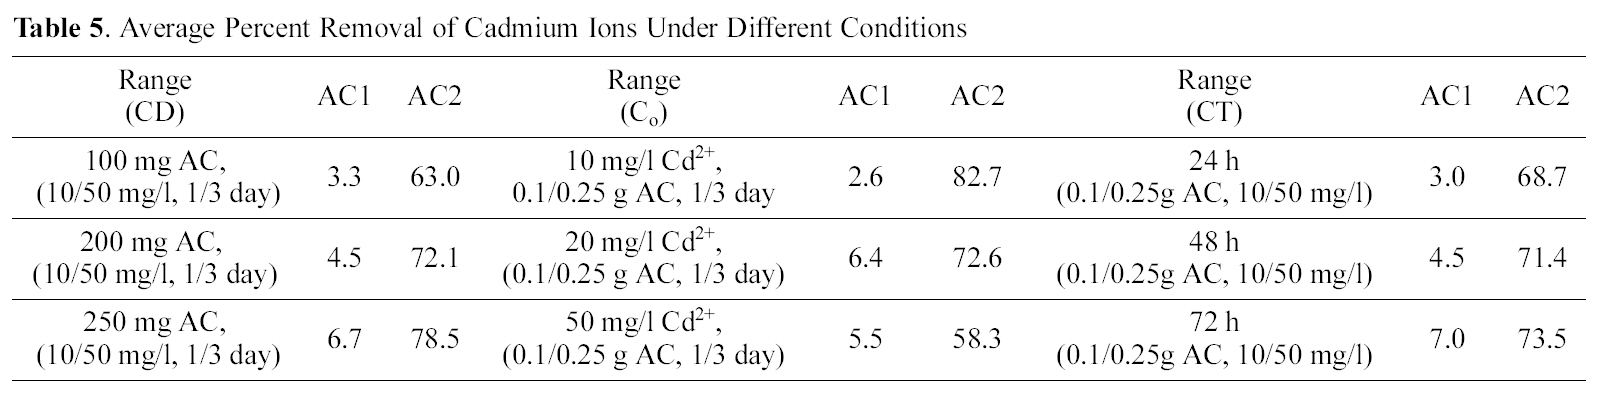
Average Percent Removal of Cadmium Ions Under Different Conditions
concentration of 20 mg/L (100 ml) was contacted with different weights of powdered samples of AC2, corresponding to 0.1 up to 0.25 g/L, under same variation of contact time.In Fig. 5 (a & b), the comparison of metal removal capacity is plotted under the two different CD conditions. Adsorption sites are practically a function of surface area (m2/g) which is a direct function of adsorbent weight that supply more area (and consequently available sites). However raising the adsorbent mass is accompanied by a regular (or linear) rise in (% removal) as a limiting up take seems to attain as appear in Fig. 5. A state of competition between the available sites might reduce the total % up take, and probably also due to the high micro porosity which inhibits the free diffusion to the deeply-located adsorption sites. Copper is still uptaken in a higher degree than cadmium as before, although the % R is not a direct function of CD. As would be anticipated metal ions removal should be 10-fold reduced as mass of adsorbent is reduced, however, for copper it is reduced only by about 50% and for cadmium it is diminished by about 70%. It is interesting to note that the % R of cadmium at low CD values (100 to 250 mg/L) as illustrated in Fig. 5(b), forms a continuation to the high CD values (1.0 to 2.5 g/L) with a very small effect of contact time. As to the removal of copper as function of CD, it is apparent that the uptake at 250 mg/L is good such that it surpasses that achieved by a higher CD of 1.0 g/L.
3.3. Collective data of metal removal by the two carbons
A trial was made to correlate the metal removal capacity to the three considered variables: contact time (CT), metal initial concentration (Co) and carbon dose (CD) (matrix effect)
[39]. Average values for the experimental data are shown in Table. 4-6, for copper, and cadmium, so as to assess the relative impact of the various factors on the process of adsorption. The previous observed trends are confirmed here, i.e. (a) the superiority of AC2 compared to AC1 and (b) the higher affinity of copper, to both adsorbents, than cadmium. Thus, the mean removals of copper by AC2 as function of CT are increased from 76.8 to 90.3%, and with increased carbon dose from 77.8 up to 91.1% which signifies that both variables pose the same effect. The mean percent removal of Cu (II) decreases with increased metal loading in solution (10, 20, 50 mg/L) from 95.2 to 82.5 and 74.8% respectively. Generally, the early copper uptake at lower parameter values (CT, CD and Co) is not changed in correspondence with their increase. AC1 removes considerably lower copper ion percentages: 10.9~19.6% as function of CT, 9.2~20.7% as function of CD and 16.2~13.5% as function of Co.
Average removals of cadmium by AC2 as function of CT slightly increases (68.7 to 73.5%) also in relation to CD (63.0~78.5%) and decreases by an increase in Co(82.7~58.3%). Activated carbon 1 exhibits much lower mean removals for cadmium ranging between 2.6 to 7.0%, under increased variable conditions. Finally, Table 6 collects a comparison between removal of Cu (II) and Cd (II) by AC2 from two solutions of fixed initial concentration of 20 mg/L, as function of two CD ranges (1.0~2.5 and 0.1~0.25 g/L). An increased contact time (from 1 to 3 days) achieves the following uptakes of copper in the two ranges (76.8, 49.6, 85.4, 50.7 and 90.3, 55.5%) respectively. Cadmium removal exhibits same trend: 68.7, 21.1, 71.4, 26.8, and 73.5, 28.6%, in same order. However, the difference in mean removal capacity with in three days is much greater between the two cations: in case of cadmium (viz. 71.2 to 25.5% and for copper 84.1 to 51.9% respectively). Cadmium removal is thus more seriously affected by reduced amount of carbon in solution; however, it is not 10-times reduction.
The same trend of reduction in metal removal is exhibited in case of the variation of carbon dose; although to different extents (see Table 6). However, it was possible here to estimate the amounts uptaken as mg/g in case of the three CD values (10, 20 and 25 mg/100 ml, corresponding to 0.1, 1.0; 0.2, 2.0 and 0.25, 2.5 g/L, respectively). Although the %R seems to be much diminished between the two cases yet the amounts uptaken of copper per gram adsorbent are increased: 15.4 to 85.6; 8.3 to 52.5 and 7.2 to 49.1 mg/g, respectively. In case of Cd (II) removal, the same observation appears where the amounts adsorbed per gram carbon increased as: 12.6 to 44.2; 7.2 to 25.9 and 6.3 to 22.8 mg/g respectively for the experiments with 100, 200 and 250 mg. This suggests that the removals performed on the high CD solution do not present the actual capacity of the activated carbon in remediation of metal ions from aqueous solution. The high capacity of AC2 indicates it to possess more adsorption sites than its counterpart derived in absence of the
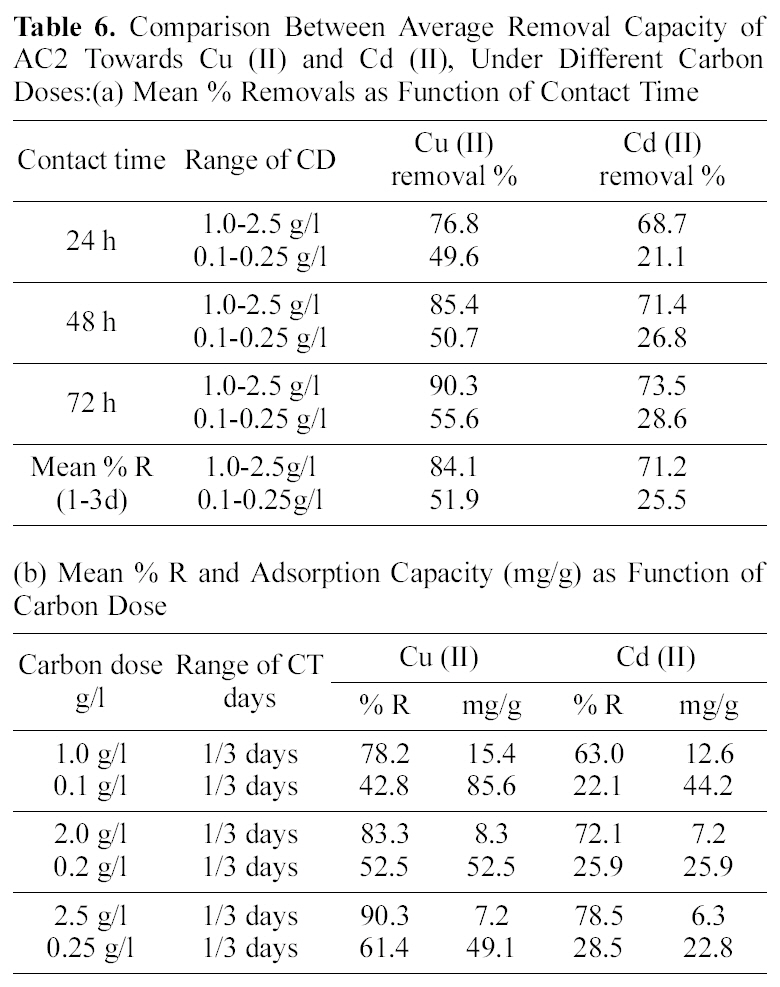
Comparison Between Average Removal Capacity of AC2 Towards Cu (II) and Cd (II) Under Different Carbon
flow of air during pyrolysis.
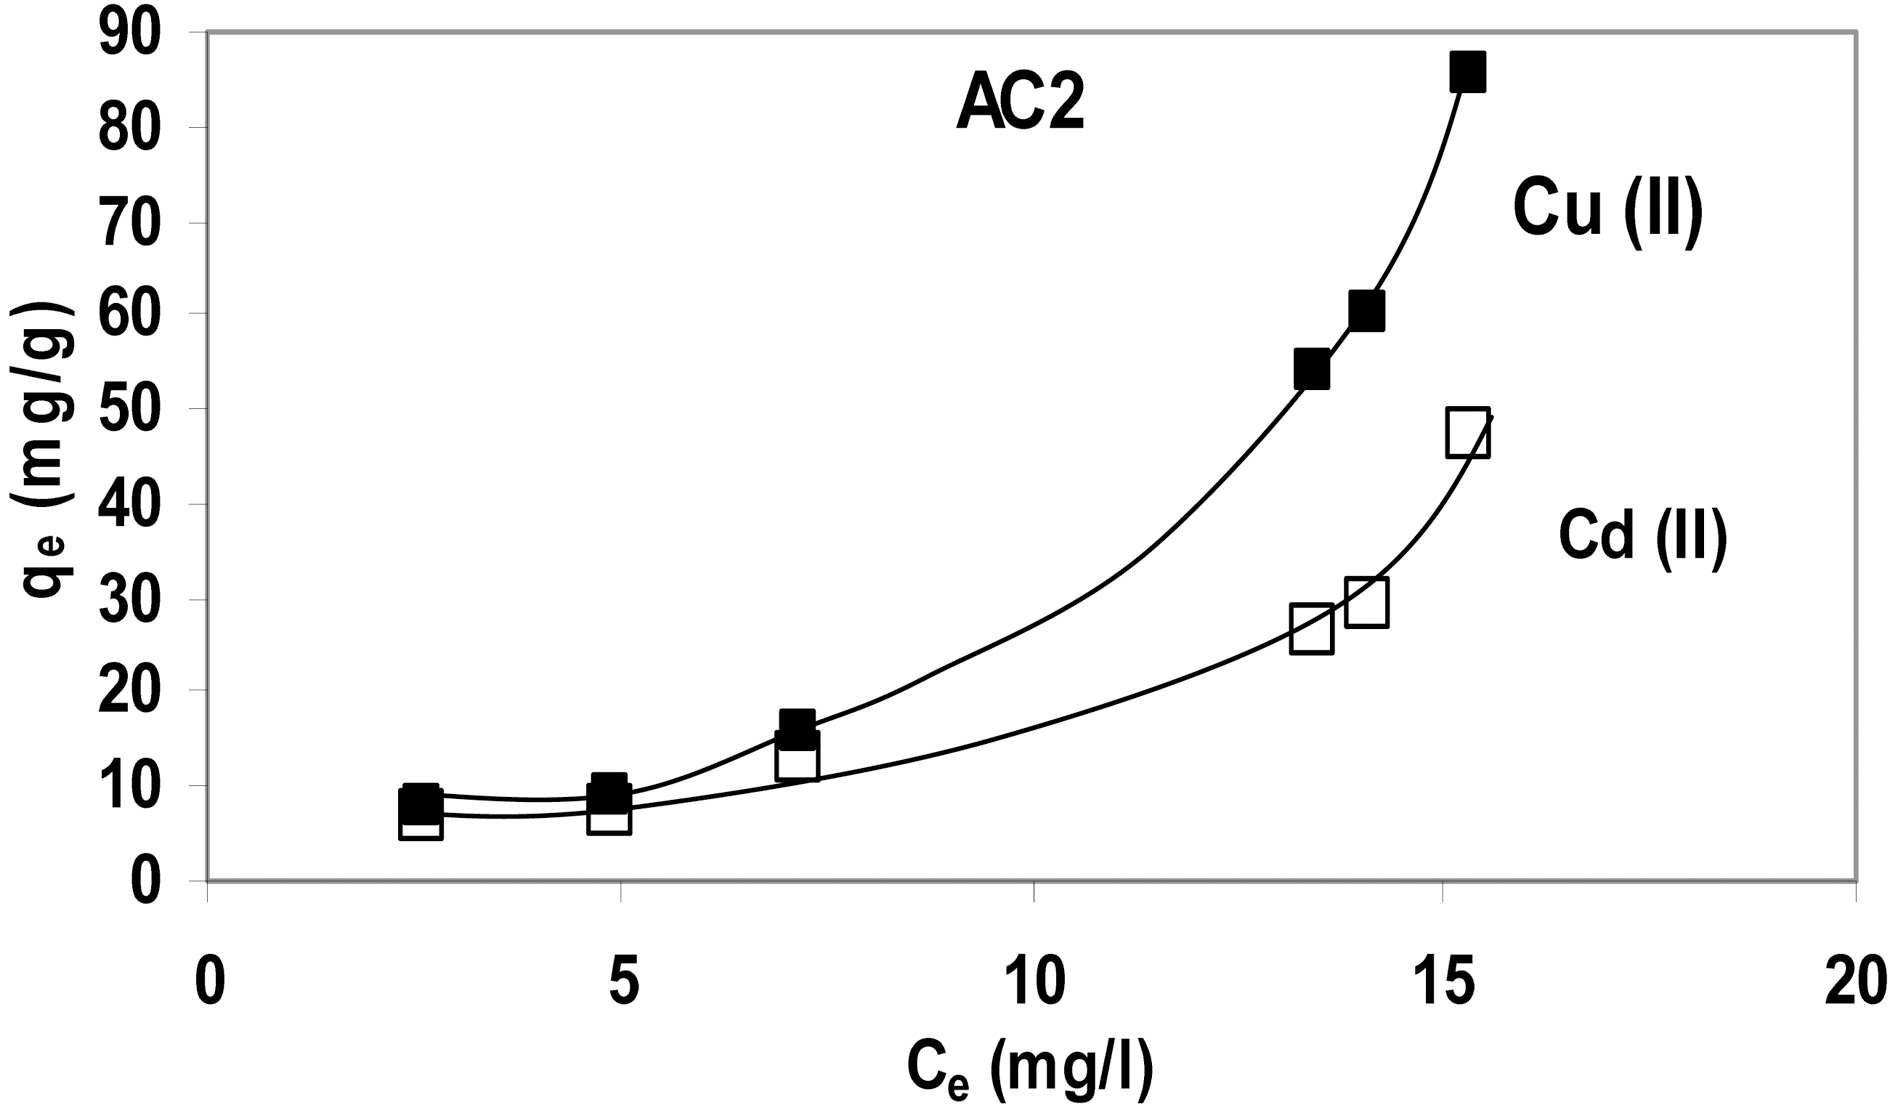
A trial was made to represent the abovementioned data as function of equilibrium concentration, Ce (Fig. 6) (adsorption isotherm) which indicates that adsorption conforms to an S-Type isotherm. Probably it might revert to the familiar L-Type if initial metal concentration was extended to higher values.
3.4. Specific impact of adsorbent and/or contaminant ion properties on the process of adsorption
Activated carbon is widely used as an adsorbent due to its high adsorption capacity, which is related to both of the pore structure and chemical nature of the carbon surface depending on the preparation conditions. Since the ACs used are microporous adsorbents, heavy metals penetrate easily into these pores when their ionic diameter become small. With respect to porosity, the two carbons under investigation show very small differences in their texture characteristics (Table 3) which cannot account for the considerably distinguished adsorption capacity towards the two metals (AC2 capacity is between 4 and 20-fold higher than AC1).
For adsorption of metals onto AC, surface chemistry is expected to play a key role as well, since adsorption is favored by the presence of oxygen-containing functional groups and electro-static attraction of the metal ions for these groups [30]. Such groups can be increased by several liquid-phase oxidation techniques, and/or through subsequent air oxidation of a GAC or during its preparation (
In addition, the target metal ion properties plays a decisive role in their removal by adsorption onto AC. The order of uptake is determined by many factors, the most significant are: ionic potential, electronegativity character, chemical properties, ionic radius, hydrolysis, and solution pH [25], copper has ionic potential 3.3 and Cd 1.9[43]. The hydration number is 6.0 for the metals studied, their ionic radii will be for Cu(II)=0.419 and Cd (II)=0.426 nm. Together with their hydration shell, copper have a relatively smaller radius that can penetrate into narrow pores and thus showed a larger access to the adsorbent surface F (Smetal/Stotal=12.9 and 2.3% for Cu (II) and Cd (II), respectively)[18]. In addition Cu (II) possesses a higher ionic potential than Cd (II), as a result of which the interaction of Cd (II) ions with the AC surface is weaker than that of Cu (II). The pH over hydroxides of Cu and Cd are 5.3 and 8.0, characterize their tendency for hydrolysis. The ions of Cd (II) are hydrolyzed to lower extent under the experimental conditions (solution pH ~5.0, or lower, due to the carbon surface). This might probably explain the higher adsorption of Cu (II) on the acidic surface of the carbon [44]. Because Cu (OH)2 was found to precipitate only at pH~6.0, it was postulated that Cu (II) removal at pH < 6.0 occurred mainly
Sequestration in mmol/g was reported to follow the sequence Cu > Pb > Ni > Co > Zn > Cr > Cd [6]. The most important parameters controlling heavy metals adsorption and their distribution between sorbent and solution, are postulated to be: the solid type, metal speciation, metal concentration, solid pH, solid-solution mass ratio, and contact time [47]. The uptake of metal ions is assumed to be a function of polar or acidic surface groups on the carbon. Data difference of several metals probably arise from difference between the hydrolysis constants and the ionic diameters of heavy metals; copper (II) being the smallest between Cu (II), Ni(II), Fe (II) and Mn (II) [9].
The present results showed the significant influence of the nature of the activating agent and the atmosphere on the final properties of the carbon materials. Unlike carbons obtained at high temperatures (