Single wall carbon nanotubes (SWCNTs) is a new class of functional nanomaterial that has attracted much interest in the scientific and engineering community because of their extraordinary properties [1, 2]. SWCNTs have been produced by a variety of techniques including arc discharge, laser ablation, catalytic chemical vapor deposition and carbon monoxide disproportionation under high pressure. As-produced material is known to be so inhomogeneous and contains various byproducts including carbon-coated metal catalysts,amorphous carbon, inorganic supports, and other carbon constituents including fullerenes and graphitic particles. The type and amount of these byproducts varies depending on the production methods used. Therefore, there has been a strong demand by researchers for quality verification and consistency of SWCNT samples from many commercial sources [3].
Each technique produces also SWCNTs with a range of diameter of 0.8~5 nm, chirality as well as various byproducts as mentioned before. Numerous works have reported the quality of SWCNTs via electron microscopy and spectroscopy,but there is no single method which accurately quantifies the types, purity, and morphology of SWCNTs [4, 5]. In general, the purity would be the most important factor in terms of SWCNT characterization. The development of a simple protocol to evaluate the purity of SWCNTs has been investigated by many research groups [6-9]. The NASA-JSC characterization protocol of SWCNTs reports numerical measures for sample homogeneity, dispersability, metal content and thermal stability [4]. However, the purity evaluation for SWCNT has not been established yet so far even though many discussions have done in the ISO/TC 229 meeting since 2004.
The analytical techniques such as transmission electron microscopy (TEM), scanning electron microscopy (SEM),thermogravimetric analysis (TGA), UV-vis-NIR spectroscopy,and Raman spectroscopy has been tried commonly to characterize purity of SWCNTs. Researchers have used TGA to characterize SWCNTs due to widespread acceptance and simplicity of this method. TGA can also use more representative sample (more than 3 mg) than other methods, which observes the changes simply in weight loss under oxidizing gas as a function of temperature.
Evaluation of the SWCNT residue is the most common measurement obtained from TGA. However, TGA residue is not equal to non-carbon content which is defined as the impurities or byproducts except all the carbon materials existed in raw soot sample. TGA measures only a residue value, which means that the appropriate correction of weight change due to the oxidation of metal catalysts in a raw SWCNT soot sample should be done for samples analyzed.
In this letter, thermogravimetric analysis (TGA) are tried to evaluate the non-carbon content in the raw soot sample by considering the weight change due to the oxidation of metal catalysts. It was also checked by inductively coupled plasma atomic emission spectrophotometer (ICP-AES), X-ray Photoelectron Spectroscopy (XPS), and X-ray diffraction (XRD).The non-carbon content by this work will be very helpful for the purity standardization of SWCNTs with UV-vis-NIR spectroscopy.
The SWCNT materials made by arc discharge method were used in this study. This sample is known as a high crystalline material, but contains various impurities. The sample was purchased from Hanwha Nanotech (ASA-100F)where FeS, Ni and Co were used in equal mass ratio as metal catalysts during synthesis.
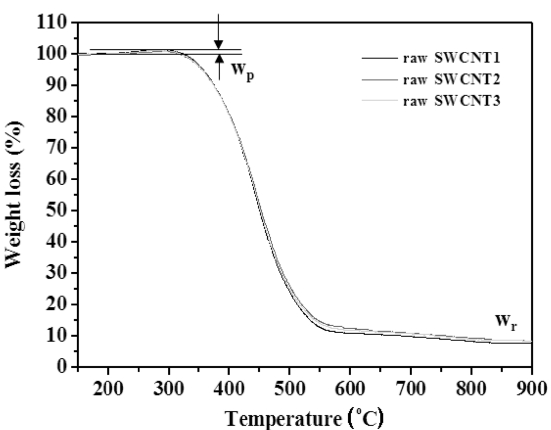
Air gas of high-purity (>99.999%) was used as an oxidation gas in TGA (Q500, TA Instruments) experiment. The total gas flow rate was 100sccm. At first, the sample was maintained at 200oC under N2 (>99.999%) atmosphere to remove all the moisture in raw soot sample prior to experiment.The resulting mass of sample was then designated as wi . We used a mass of sample more than 3 mg at each TGA run with a heating rate of 5oC/min in air from 200oC to 950oC. The maximum weight percent by oxidation of metal catalysts near at 200~350oC and the TGA residue at 900oC were designated as wp and wr, respectively. We obtained more than three TGA curves for one sample to take an average value. Three TGA test sample was also taken in a raw soot sample to check out the homogeneity of the sample analyzed. A quantitative measure of non-carbon content in
raw soot sample is provided by measuring the TGA residue(wr) and the percentage of increased weight at the maximum peak of the TGA curve (Δwp) under the assumption that upon heating up to 350oC in air metal catalyst to be oxidized are converted into corresponding metal oxides. ICP-AES(138 Ultraace, Jobin Yvon), XPS (ESCALAB 250 XPS Spectrometer, VG Scientifics), and XRD (Philips XPERT MPD, Philips Analytical X-ray BV) were also used to confirm the TGA results in this work and reveal the factors causing the weight increase in TGA curve.
3. Results and Discussion
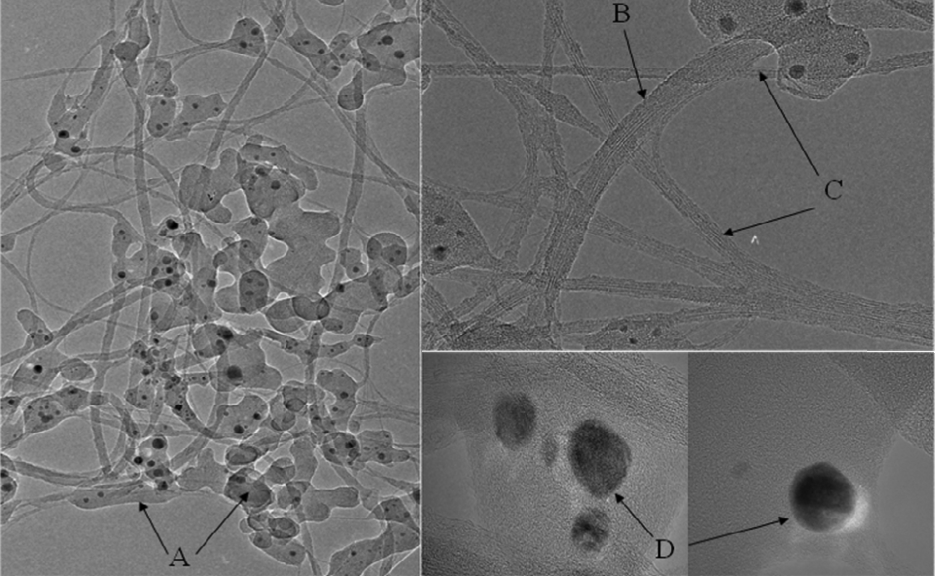
Fig. 1 shows that TEM images of SWCNT raw soot. We can observe various kinds of byproducts as well as SWCNTs.We can know that most of metal catalysts are well encapsulated with graphitic carbon shell.
From Fig. 2,we could observe the weight increase in the temperature range of 250~350oC, which is caused by the oxidation of metals in the raw soot by flowing air gas during TGA run. The weight increase is commonly proportional to the initial mass of transition metal in the sample. For our SWCNTs raw soot, increased weight by oxidation was about 2 wt.%. The weight increase of more than 10% is often observed for other samples. Therefore, if we do not consider the oxidation of metal components during TGA run, it causes to make fairly large error in the determination of non-carbon content in case of samples that contains much amount of metals.
Fe, Ni, Co, and S, which are used as catalysts during synthesis,is mainly contained in the non-oxidized form inside SWCNT raw soot and other metals such as Cu, Zn and Zr are also existed in a very small quantity as impurities. These
metals may be changed into their corresponding oxidized states after TGA run. It means that the TGA residue (wr) is not equivalent to non-carbon content in raw soot sample due to the structural change coming from metal oxidation as shown in Fig. .3 Other metallic oxide such as SiO2 may be also present in a sample, but it is thermally stable over the temperature range in our TGA experiment and was confirmed to be contained as a negligible amount, which is checked by Energy Dispersive Spectrometer (EDS). We note here that samples often contain traces of other elements (for example,Zn, Cl), which may introduce very small error in the calculated non-carbon content.
TGA has been used to ascribe absolute decomposition temperatures or regions of combustion under flowing air for CNT soots. The common interpretation of TGA data is the presence of two major weight losses attributed to amorphous carbon and SWNTs, respectively, from low (350~400°C) to high temperature (typically >400~600°C). However, in case of the determination of non-carbon contents, we do not have to consider detailed information regarding the carbonaceous constituents and their thermal stability which is less straightforward from TGA data until now.
We need to analyze what metals are involved to cause
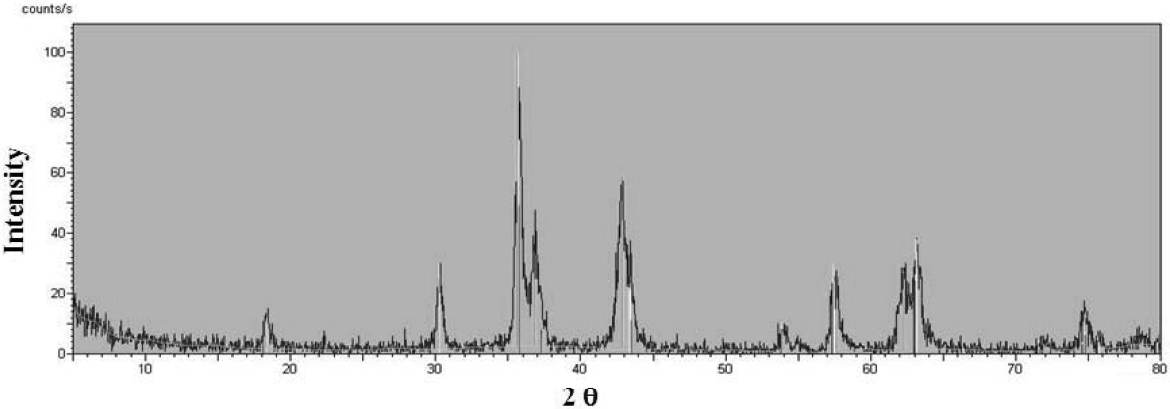
weight increase in TGA graph. So, XRD analysis was carried out to indentify the structure of oxidized metal forms for the sample of the residue which is prepared at 950oC for 30 min in air. Fig. 3 shows XRD peaks of the residue. Analysis program of X'Pert Graphics & Identify was used to assign the structure corresponding to XRD peaks.
From the XRD result, Fe3O4 is exactly matched with the peaks in Fig. 3,while any oxidized forms of Ni, Co, and other metal were not found at all in the residue. Therefore, we could know that the weight increase of TGA graph in the
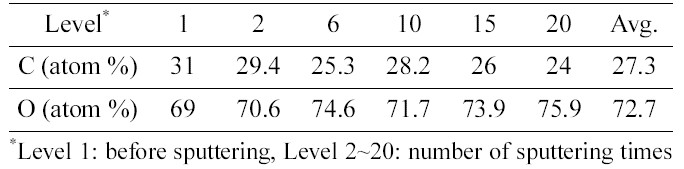
[Table 1.] Concentration of C and O atom by depth profile of XPS analysis

Concentration of C and O atom by depth profile of XPS analysis
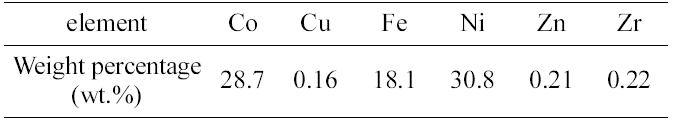
[Table 2.] Results of ICP-AES elemental analysis for the residue

Results of ICP-AES elemental analysis for the residue
range of 250~350oC is completely caused by oxidation of Fe metal.
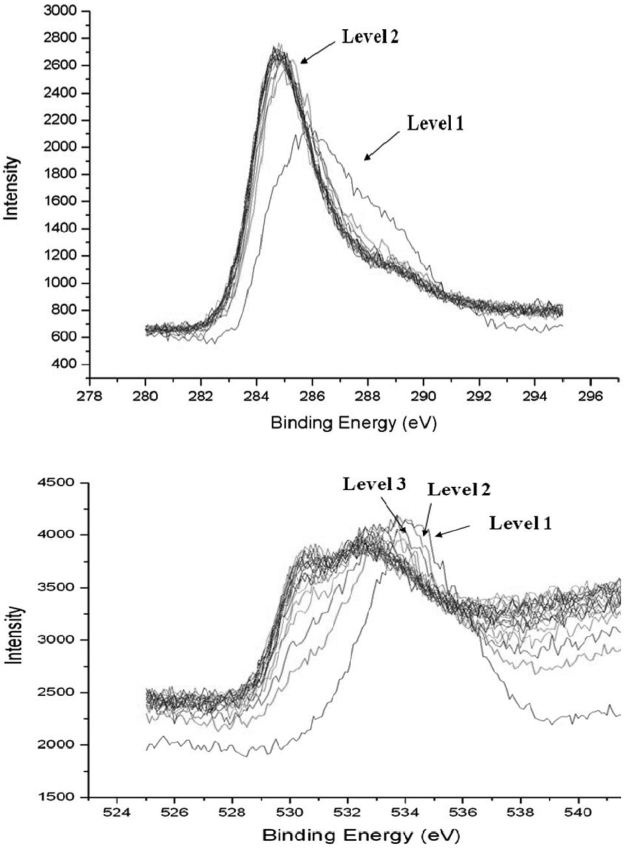
XPS analysis was carried out for the quantitative analysis of carbon and oxygen atoms that contained in the residue.For the sample preparation of XPS analysis, the residue was pelletized into a cylindrical shape and then sputtered by Ar plasma. The sputtering was done 20 times and followed by XPS analysis at each sputtering time. Average penetration depth per a sputtering was about 4 nm. Fig. 4 shows the results of XPS analysis for both C and O atom.
Table 1 shows the concentration of C and O atom by depth profile of XPS analysis. The weight ratio of carbon and oxygen was calculated as 1:7.3 by considering atomic mass of each atom.
ICP-AES analysis was carried out for the elemental analysis of metal components in the residue. The detection limit was in the range of several ppb. Three times were done for this analysis and averaged. Table 2 shows the quantitative results of ICP-AES elemental analysis.
With the TGA residue, weight ratio of carbon and oxygen by XPS, and total weight percentage of metals except carbon and oxygen which were determined by ICP-AES, it makes us to evaluate the percentage corresponding to weight increase due to oxidation of Fe metal contained raw soot sample. It was about 2 wt.%, which is almost equal to the weight increased percentage of TGA graph in Fig. .2 We also checked out other TGA graphs and confirmed that the oxidation of metal in the raw soot is well represented by TGA graph.Therefore, we can determine the non-carbon content by using only TGA analysis. However, we strongly suggest checking out the validity of TGA with other methods such as ICPAES,and XPS as in this work in the determination of noncarbon content of test samples which are not reported in material specification sheet.
The weight percentage of non-carbon content could be determined by following formula.
wNC = (wr ? Δwp)/wi × 100
where, wNC: weight percentage of non-carbon content
wi: weight percentage of initial mass after removal of moisture
wr: minimum weight percentage left during the TGA
Δwp: weight increased percentage at the maximum peak of the TGA curve
For the reliability of our result, TGA run of more than at least three times should be done and then reported as an averaged value. It also should always describe the measurement conditions such as sample pretreatment, ramp rate, type and flow rate of used gases when non-carbon contents is reported.
In conclusion, we can determine the non-carbon content by using TGA only, which is verified by ICP-AES and XPS.We think this method will be very helpful for the precise purity evaluation of SWCNTs with UN-vis-NIR spectroscopy[10].