Since the discovery of carbon nanotubes (CNTs) in 1991[1], CNTs have been developed for numerous applications including gas sensor [2], nano-composite [3], field-effect transistor [4], transparent conducting film [5], and cooler [6], due to their higher mechanical properties, thermal conductivity, tensile strength, electrical conductivity, and etc [7]. CNTs have been synthesized by several methods such as arc discharge [1], catalytic chemical vapor deposition (CVD) [8], high pressure carbon monoxide process (HIPCO) [9], CoMoCat process [10], and laser ablation [11] using various catalysts of Fe, Co, Mo, Ni, their mixtures, and so on. These CNTs exist in bundled form in a few micrometers long due to van der Waals interaction energy of about 1000 eV [12]. The dispersion of the raw SWCNTs into individual nanotubes or smaller bundle-size nanotubes are frequently required to maximize or to retain their superb properties in the numerous applications.
The dispersion of CNTs can be classified into macrodispersion and nanodispersion, which is defined as a macro state dispersed in solvent with small-size bundles and that with individual SWCNT, respectively [13,14]. In order to compare the dispersibility of CNTs, several methods have been used, for example, UV-VIS-NIR spectroscopy [15], fluorescence spectroscopy [16], atomic force microscopy (AFM) [17], and transmission electron microscopy (TEM) [18]. However, AFM and TEM do not offer the reliable data because the sample should be prepared on the substrate in a small quantity. UV-VIS-NIR spectroscopy not only measures dispersed CNTs solution directly, but also provides the quantitative data.
In spite of much effort, the standardized evaluation method for the degree of dispersion of CNTs has not been established yet as a standard protocol. This makes researcher or engineer to be confused which has been one of the ambiguities and therefore delays industry applications of CNTs. For these reasons, the evaluation method of the degree of the dispersion of CNTs should be addressed in terms of standardization [19].
In this paper, we suggested the evaluation method of the degree of macrodispersion of CNTs for standardization. Numerous dispersion methods have been reported elsewhere. For example, the surfactants such as sodium dodecyl sulfate (SDS) and sodium dodecylbenzene sulfonate (NaDDBS) can be used for the dispersion of CNTs in solution phase [16]. Organic solvents such as 1,2-dichloroethane (DCE), N,N-dimethylformamide (DMF) and N-methyl-2-pyrrolidone (NMP) have been utilized for the dispersion [17,20]. Kim et al. showed the designed dispersants based on the monomer thiophene to disperse CNTs with long-term stability in organic solvent [18]. We have estimated the degree of the macrodisepersion of CNTs using UV-VIS-NIR spectroscopy. For the standardization, we need to fix several variables in advance such as the amount of dispersant, solvent and CNTs, the shape of the flask, the solution temperature, the homogenizer power and time, the centrifugation speed and time. From the Beer’s law (Absorbance = ε ι c, where ε is the extinction coefficient, ι is the path length, c is the concentration of CNTs), the absorbance only depends on the concentration of CNT, if the path length and extinction coefficient were a constant. In the previous work, Jeong et al. showed that the extinction coefficient of single-walled carbon nanotubes (SWCNTs) with a mean diameter of 1.4 nm is about 30 mL·mg-1·cm-1 with a constant extinction coefficient [21]. Accordingly, we assumed that the absorbance is only related to the CNT concentration directly. The absorbance of the CNT solution before and after centrifugation become defined as Ab(λ) and Aa(λ), respectively. The degree of the macrodiseprsion of CNTs has a relationship as follow;
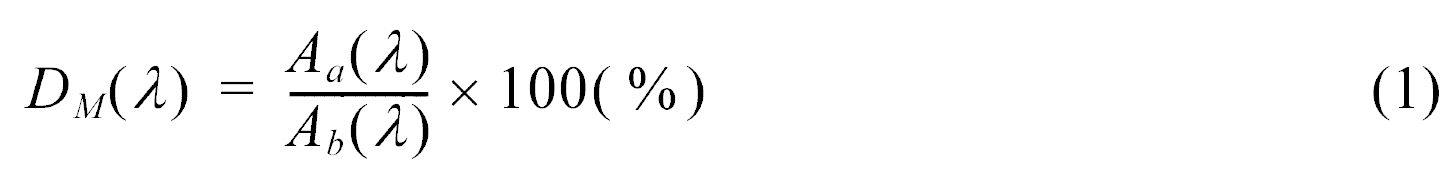
where λ is the wavelength, Ab(λ) and Aa(λ) are the absorbance before and after the centrifugation. At this moment, if any sedimentation of CNTs occurs on the bottom of the flask after homogenizing, this solution cannot be further used for standardization. We have examined the several samples including multi-walled carbon nanotubes (MWCNTs) and SWCNTs. The obtained standard deviation (SD) value of Dm is lower than 5. In this paper, we have suggested a reliable evaluation method of the macrodispersion of CNTs for the standardization protocol using UV-VIS-NIR spectroscopy. This method is expected to represent the degree of CNT dispersion, which can be used as a protocol of measuring the degree of macrodispersion of CNTs.
2.1. Preparation of carbon nanotube and dispersion solution
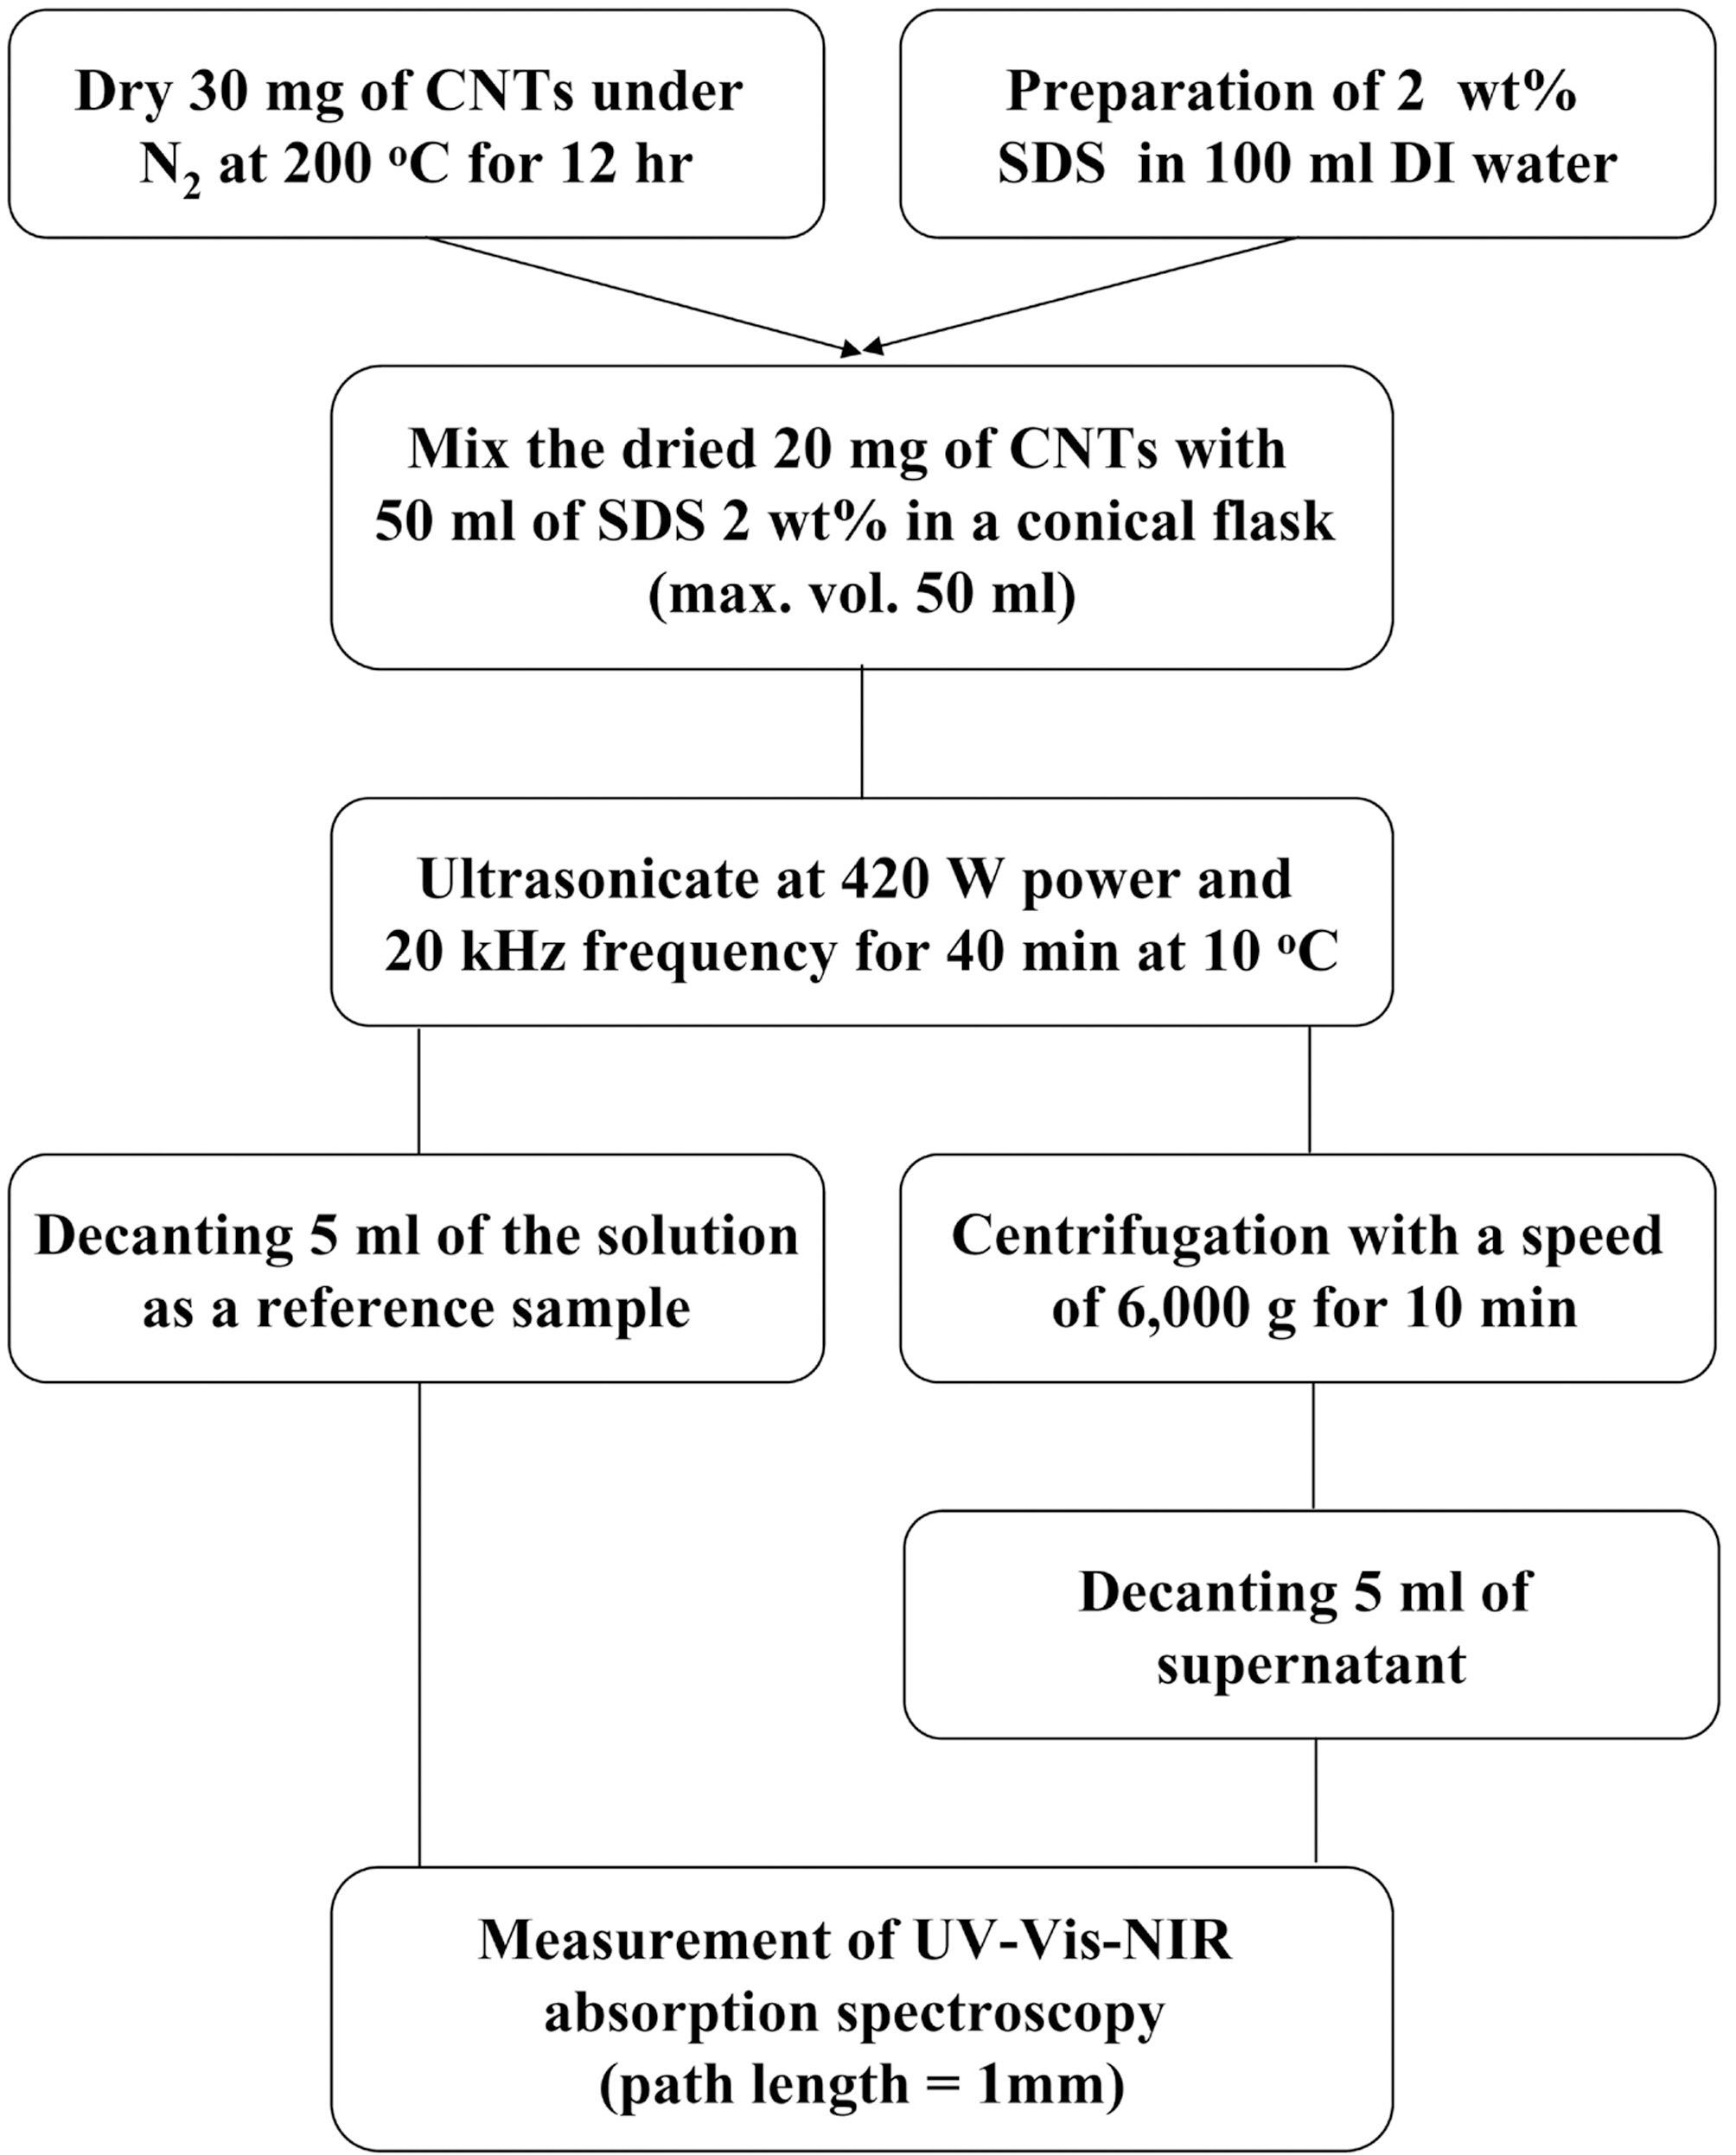
Fig. 1 shows the schematic diagram of the sample preparation. Three types of MWCNTs (CM95, CB03, and CB04) used in this study were provided from Hanwha Nanotech. They have a mean diameter of 15 nm. In the case
of SWCNTs, the purified HIPCO® single-wall carbon nanotubes (MD=1 nm), simply as a HIPCO, SWeNT® SG 65 single-walled carbon nanotubes (MD=0.8 nm), ASP-100F sing-walled carbon nanotubes (MD=1.4 nm) were purchased from Unidym, SouthWest Nanotechnologies, and Hanwha Nanotech, respectively. To exclude moisture or other effects, 30 mg of all the samples were dried under nitrogen ambient at 200℃ for 12 hr in oven prior to dispersion.
We chose the dispersion method in aqueous solution with SDS as a surfactant, which is environment-friendly, cheep,and convenience. So, all CNT dispersion solutions were prepared using 2 wt % SDS in 100 mL DI water.
2.2. Dispersion procedure and centrifugation
The 20 mg of dried CNTs and 50 mL of SDS 2 wt% solution were placed in a 50 mL volumetric conical flask, which was used to spread out the ultrasound energy homogenously during the dispersion process. The dispersion was carried out by the homogenizer (ULH 700S, Taewon Science Company) at 420 W and 20 kHz frequency at 10℃ for 40 min. The tip of homogenizer with a diameter of 7 mm was immersed 1 cm deep from the top of the solution surface in a conical flask. To maintain the temperature of the solution at 10℃, the refrigerating bath circulator system
(VTRC-620, JEIO Tech) was equipped in the outside of a conical flask.
After dispersion, 5 mL of the prepared CNT solution was decanted as a reference sample and followed by centrifugation (Mega 17R, Hanil Science Industrial Co. Ltd.) of 40 mL with a rotation speed of 6,000 g for 10 min to remove the severely entangled CNTs. The 5 mL of supernatant was also decanted from resulting solution.
UV-VIS-NIR absorption spectroscopy (Cary 5000, Varian) was used to measure the absorbance of the reference samples and the centrifuged samples above. The path length of the spectroscopic quartz cell was 1 mm. Identical experiments were taken three times per sample to obtain the average and standard deviation.
3.1. Degree of macrodisperion of MWCNTs
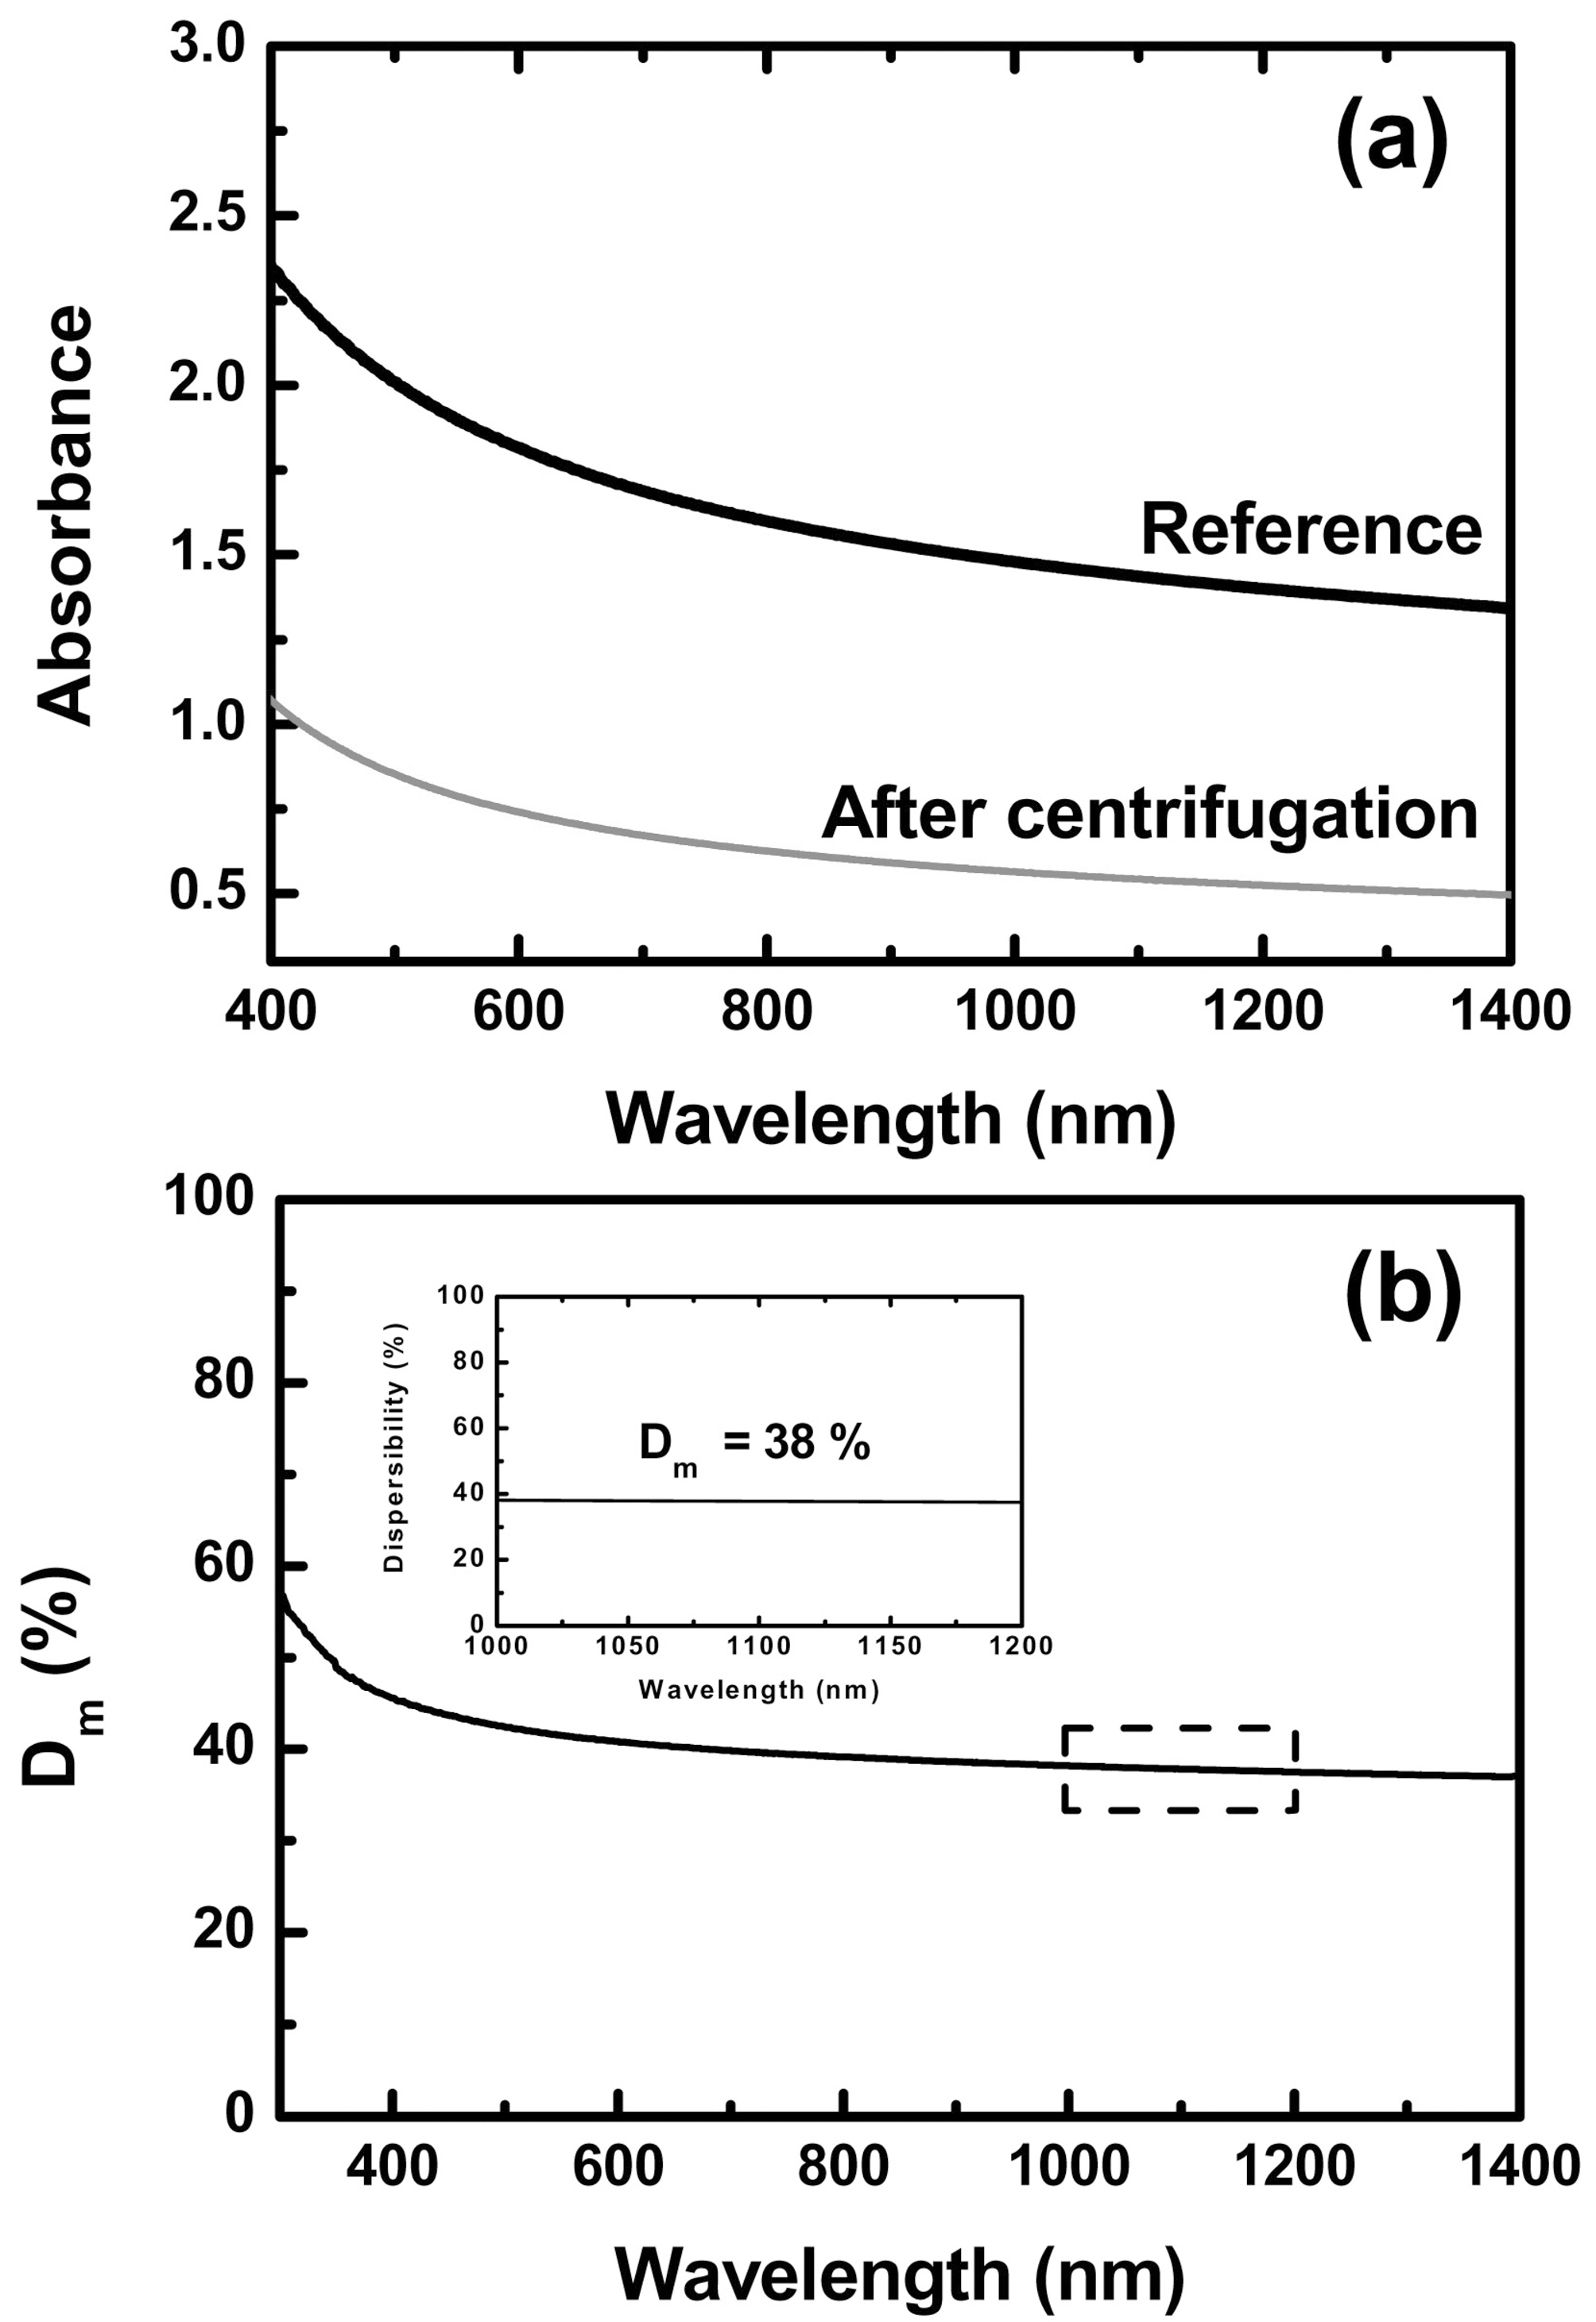
Fig. 2a shows the absorbance of the MWCNT (CM95) solution before and after the centrifugation. In general, the absorbance spectra of MWCNTs is only related to the π-plasmon peak around 4.0-4.25 eV. Accordingly, the absorbance of MWCNTs was increased toward the lower wavelength and was decreased due to the removal severely entangled CNTs after centrifugation. In the previous work, Geng et al. showed only the rope or individual MWCNTs after centrifugation using the scanning electron microscopy (SEM) [22]. The degree of macrodispersion of CNTs denoted as Dm(λ) was dependent on the wavelength as shown in Fig.2b. However, the inset in Fig. 2b shows the uniform Dm(λ) in the range between 1000 and 2000 nm. Consequently, we selected this range to determine the Dm as the following relationship to
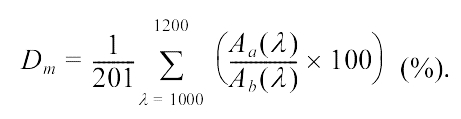
As a result, we took 38% of Dm of MWCNTs (CM95).
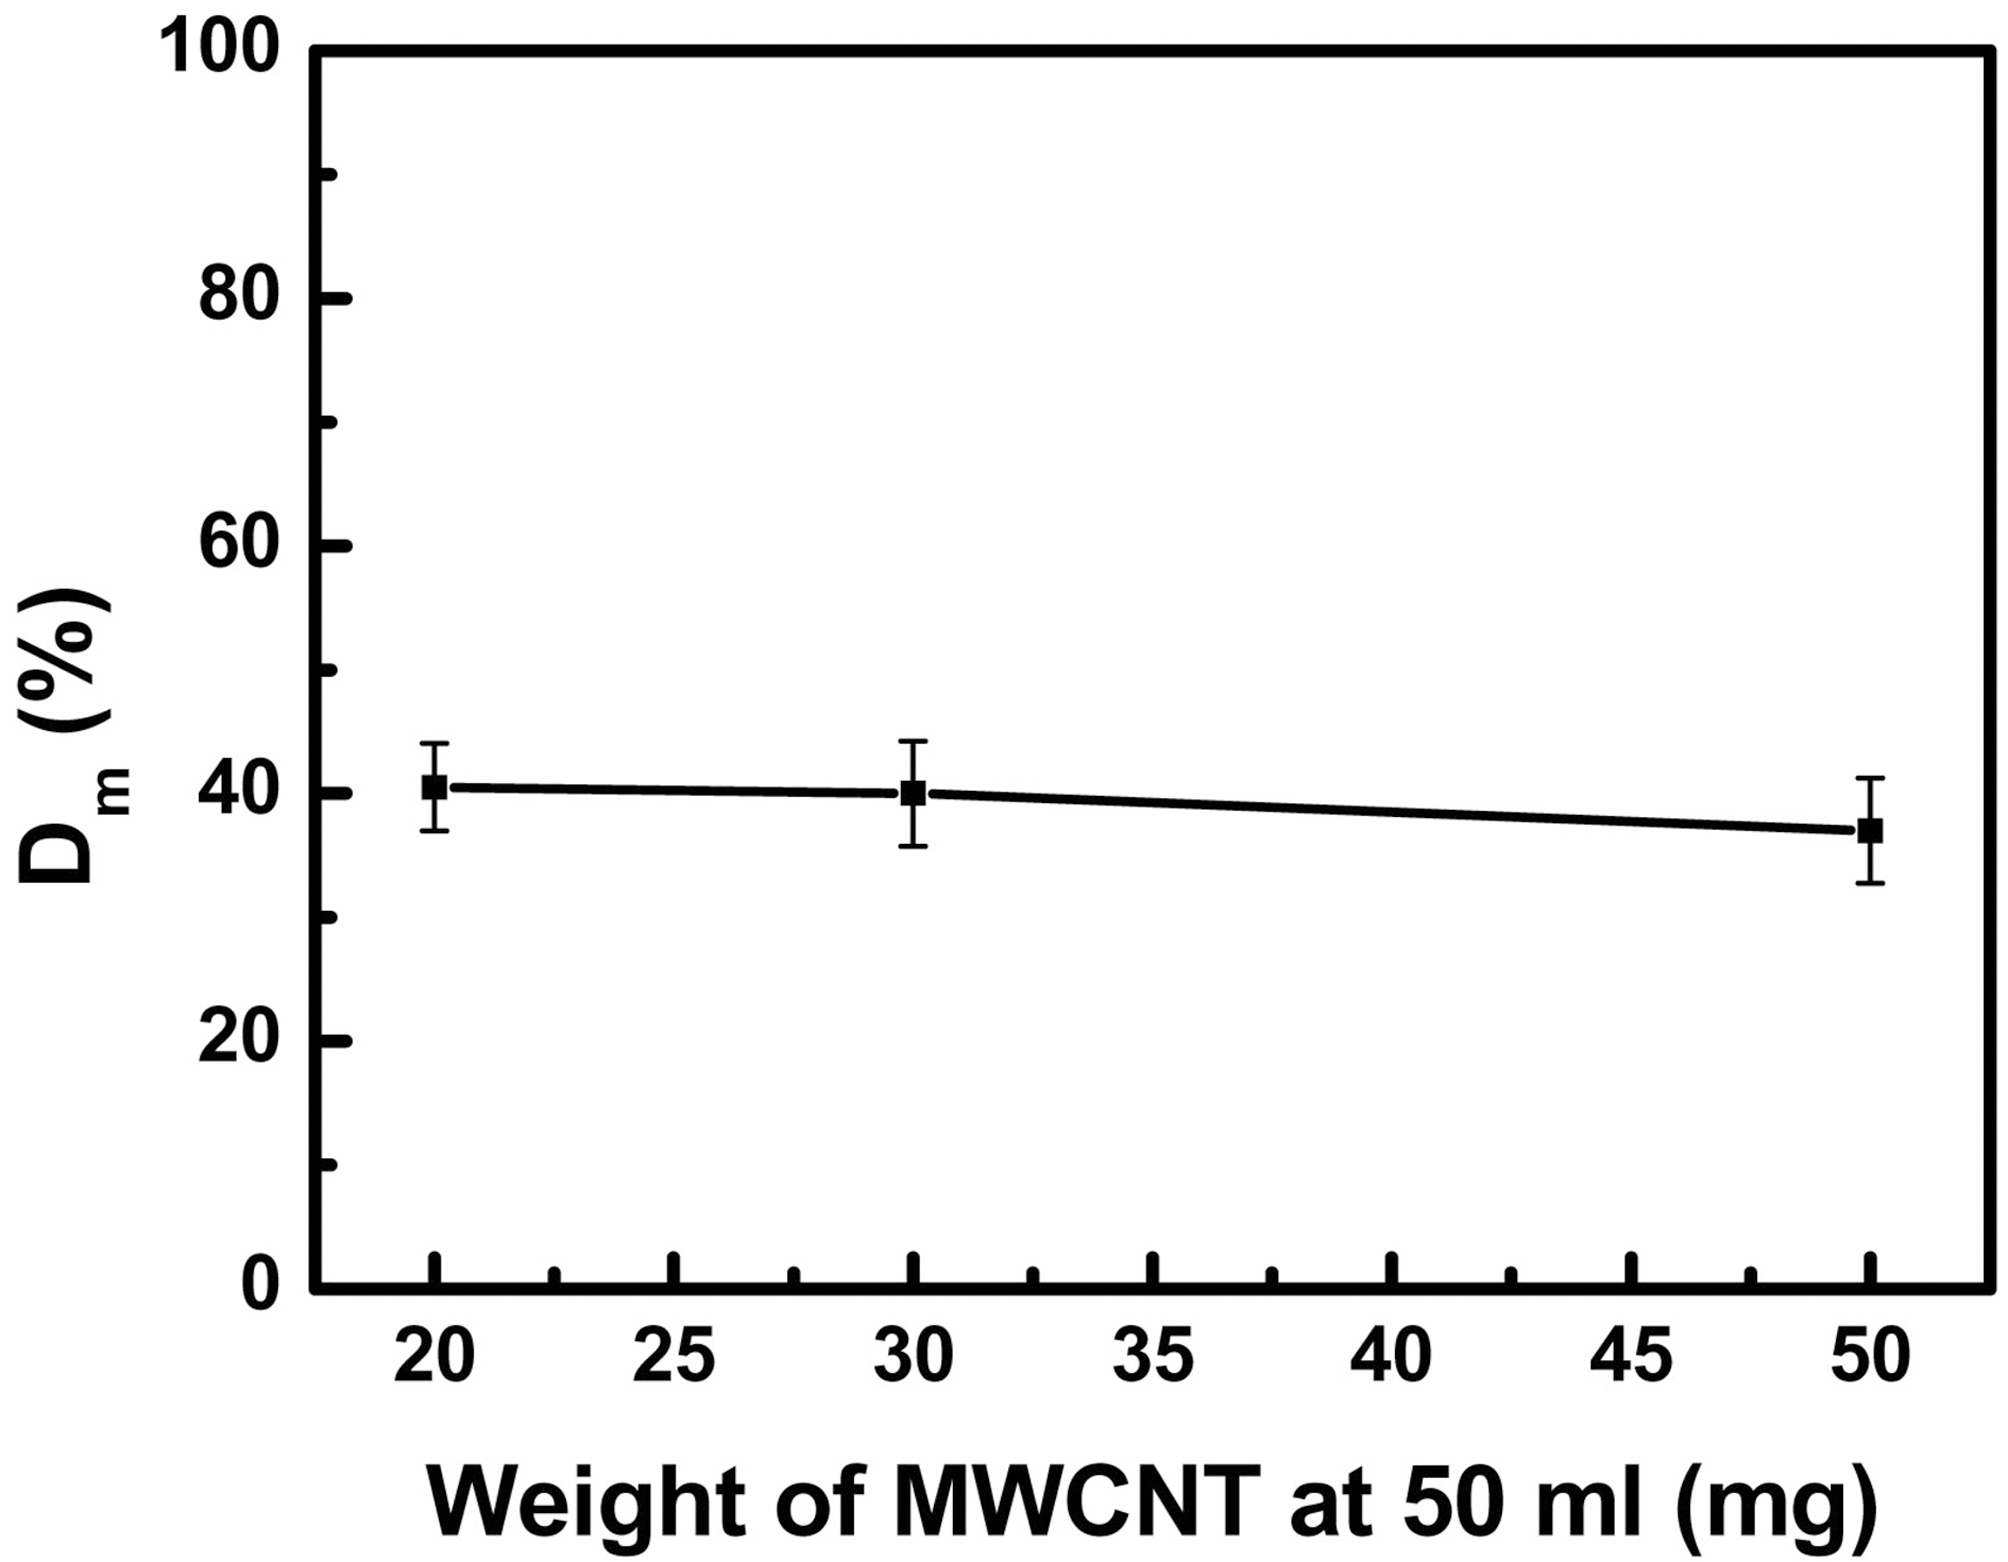
To investigate the dependence of Dm on the concentration of MWCNTs, the weight was varied from 20 mg to 50 mg with the same amount of solvent. And we carried out the same experiment three times for each solution. In Fig. 3, for 20 mg MWCNTs, the Dm and their SD were 40% and 4, respectively. The others were almost similar to the case of 20 mg MWCNTs, but the Dm of 50 mg MWCNTs which was decreased by 3% compared to that of 20 mg MWCNTs. This may be attributed from the limitation of the dispersibility of SDS. Therefore, we determined that the weight of CNTs was 20 mg in 50 mL water for standardization.
3.2. Degree of macrodisperion of SWCNTs
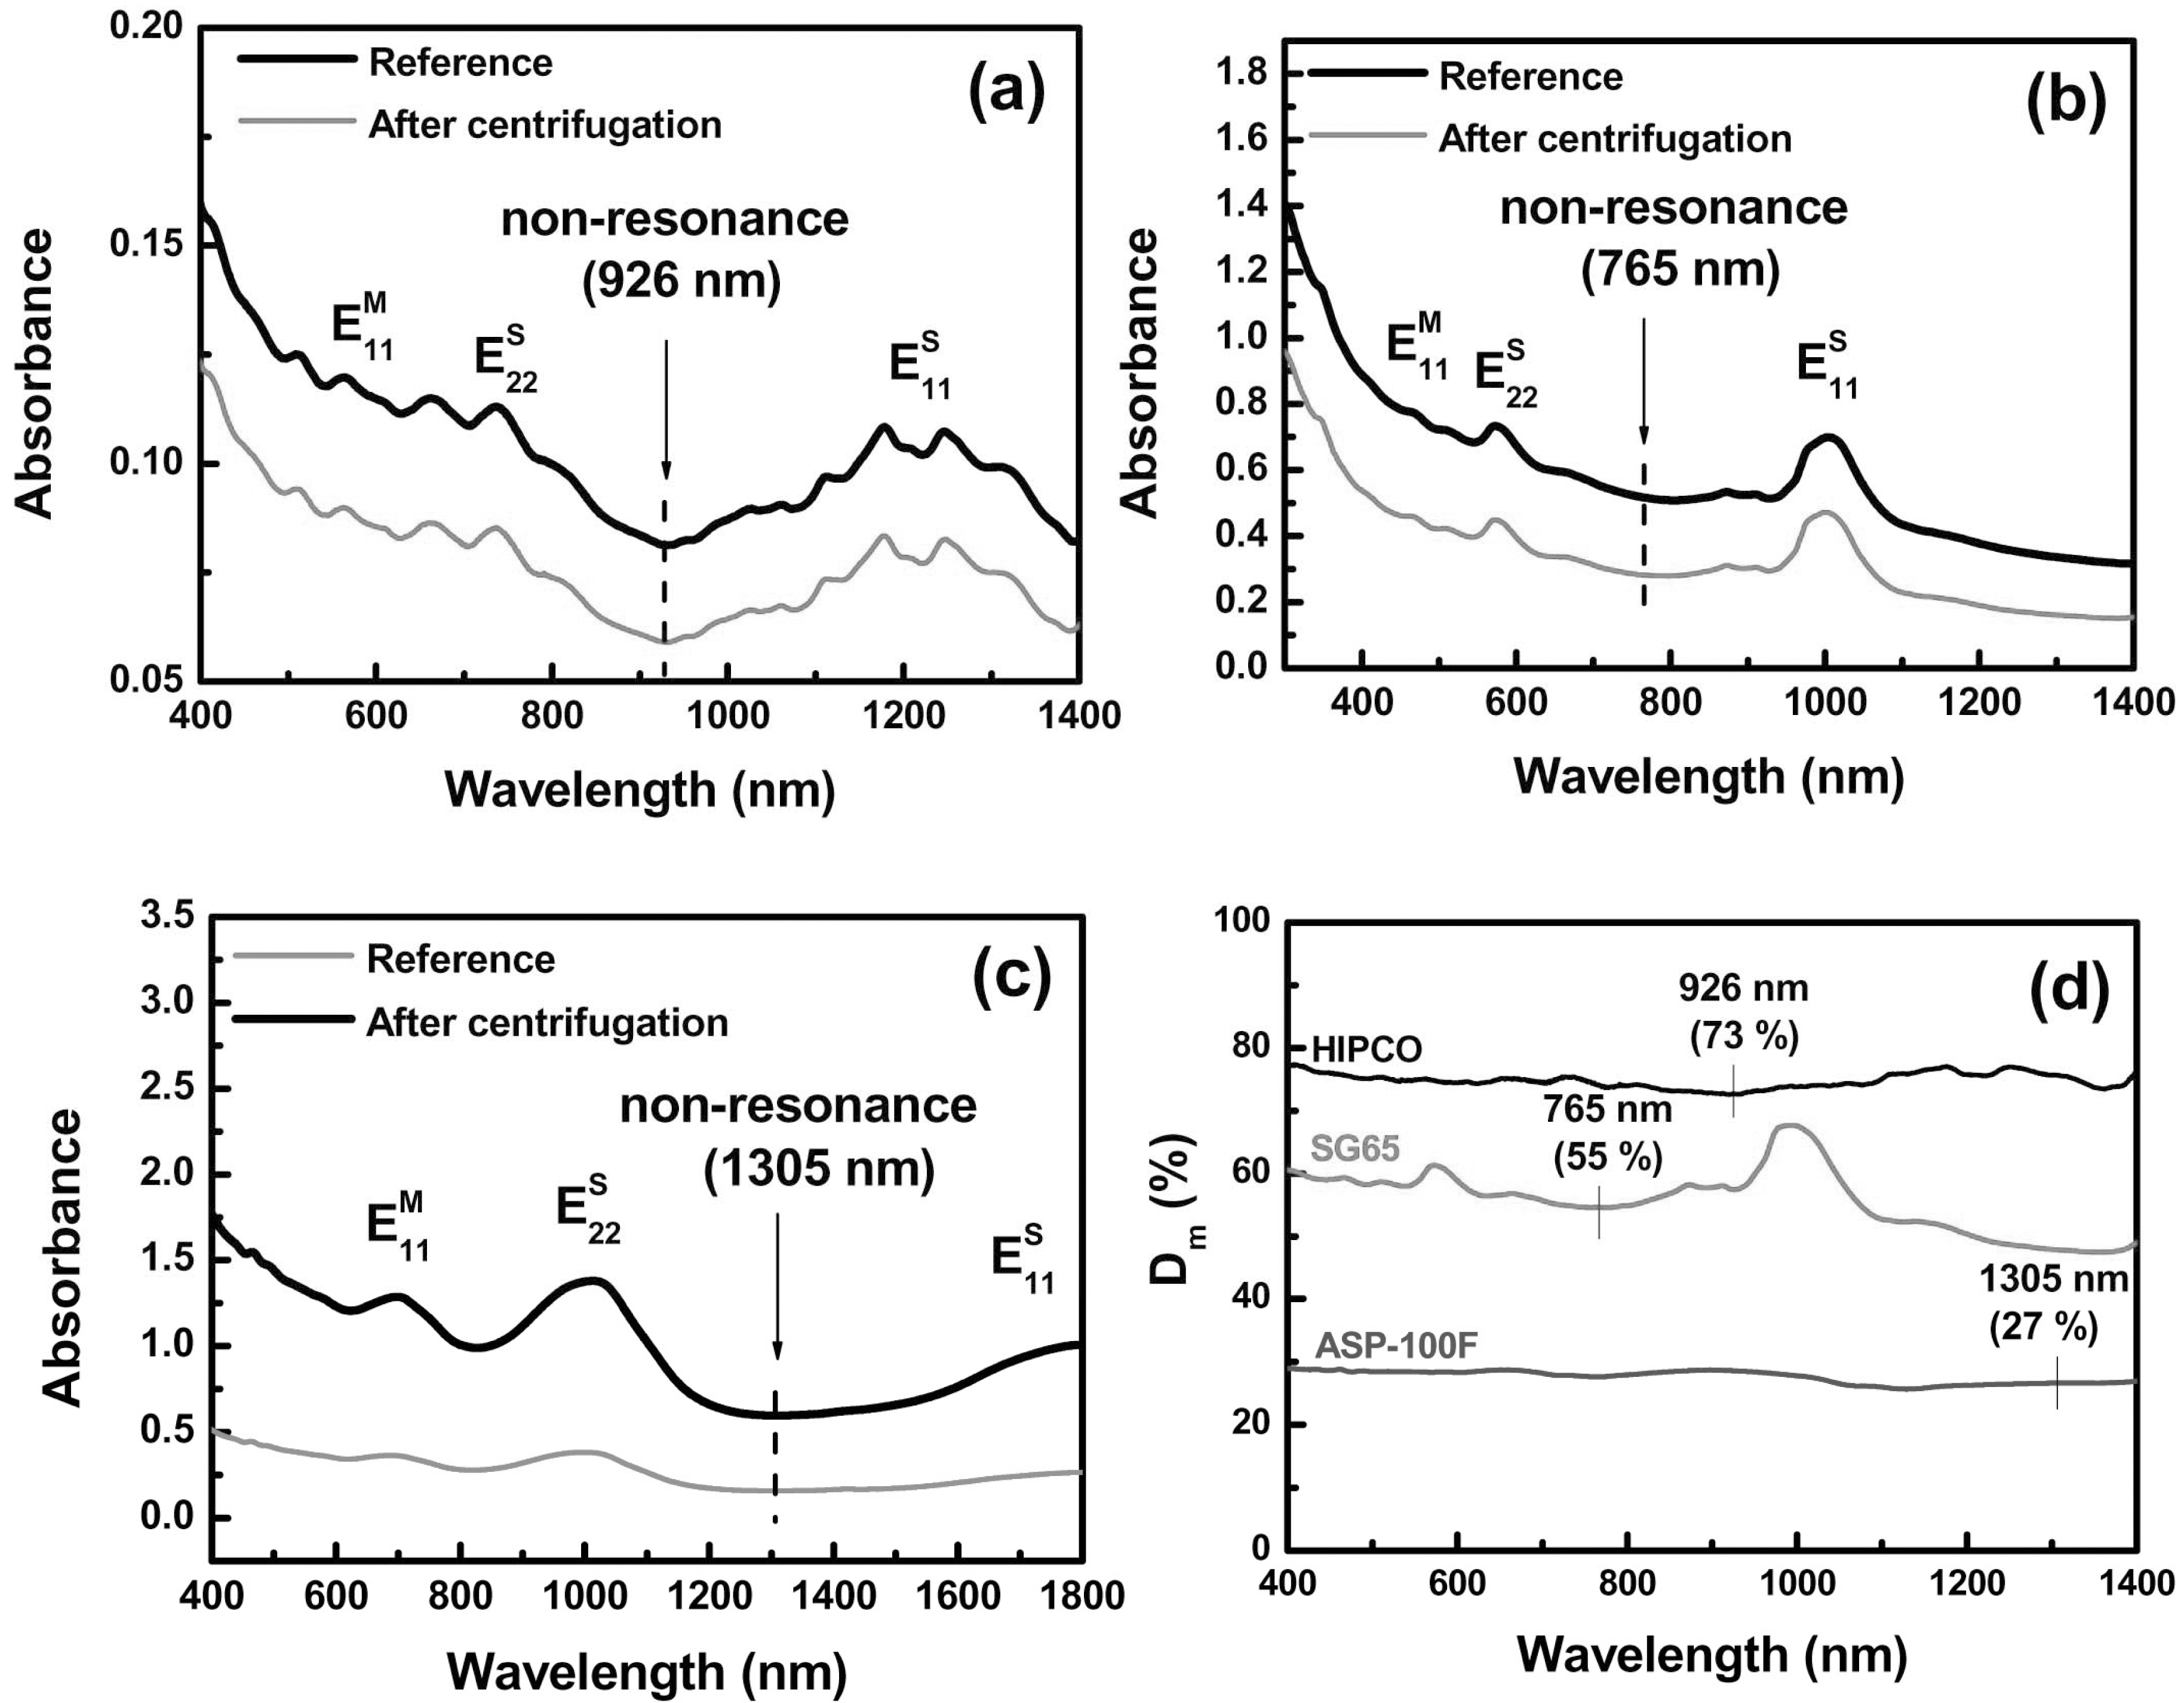
The Dm of the various kinds of SWCNTs was evaluated using same method with MWCNTs except averaging the Dm(λ). Unlike MWCNTs in the optical spectra, the SWCNTs have the van Hove singularity (vHS)-related transition peaks such as E11S and E22S. from the semiconducting SWCNT and E11M from the metallic SWCNT [23]. As shown in Fig. 4a-c, the vHS-related transition peaks are dependent on their diameter or optical band gap [23]. The Dm(λ) of SWCNTs fluctuated with the wavelength, as shown in Fig. 4d. This originates from the different absorbance of E11S, E22S, and E11M peaks before and after the centrifugation. In the previous work, the absorbances of these peaks were stronger with increasing dispersibility of SWCNTs [15]. Consequently , the Dm(λ) fluctuated among E11S, E22S, and E11M peaks. To obtain the reliable Dm of SWNCTs, we selected the wavelength in which the vHS-related transition peaks were not visible between E11S and E22S. For example, in the case of HIPCO SWCNTs, the wavelength of 926 nm was selected for the Dm. The wavelength of 765 nm and 1305 nm was chosen from SG65 and ASP-100F, respectively. In Fig.4d, all the Dm were flat near the selected wavelength.
In table 1, the Dm and SD of the various types of CNTs were summarized. Among the evaluated SWCNTs, the Dm of HIPCO SWCNTs was the highest and the Dm of CB03 MWCNTs was 59%. The SDs of all the CNTs were lower than 5. This indicates that our suggested method is reliable for standardization.
Based on the Beer’s law, we have suggested the evaluation method for the degree of macrodisepersion of CNTs to establish standardization protocol by comparing the absorbance of dispersed CNT solution before and after centrifugation in the UV-VIS-NIR absorption spectroscopy. The Dm of MWCNTs and SWCNTs was
[Table 1.] Degree of Macrodisperion of Various Types of CNTs
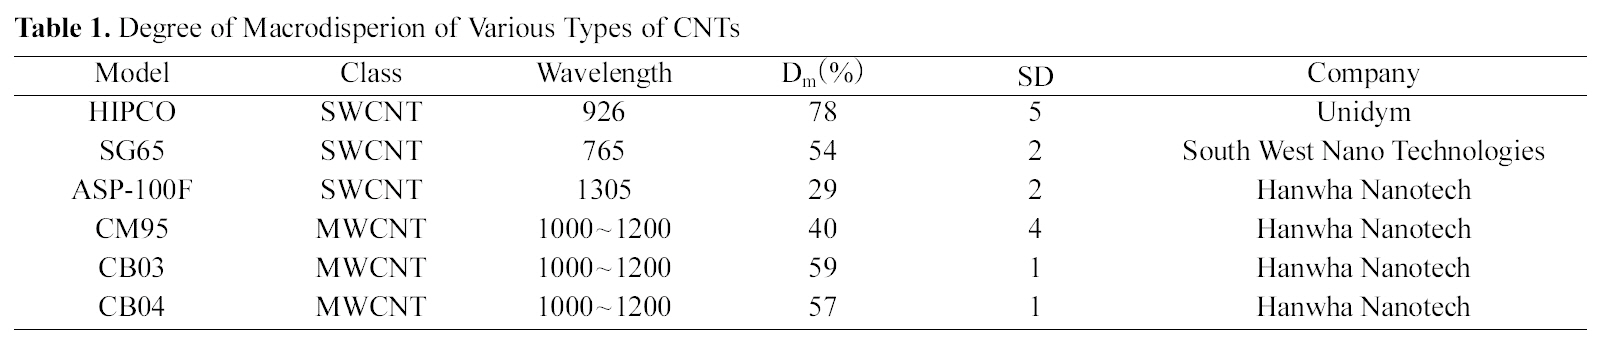
Degree of Macrodisperion of Various Types of CNTs
at the specific wavelength in which the vHS-related transition peaks were not visible between E11S and E22S, respectively. The SD from our method was lower than 5. We think that our method in this work provides an easy and simple way to determine the degree of dispersion and it may lead to establish the standardization protocol for the degree of the dispersion.