Polymer composites with nanoscale fillers are of increasing interest because they can exhibit exceptional mechanical, thermal and electrical properties. Mutlifunctional polymer nanocomposites can be made by using thermally and electrically conductive nanoreinforcements including but not limited to carbon nanotubes, CNT [1], expanded graphite, EG [2], and exfoliated graphite nanoplatelets, xGnPTM [3]. EG and xGnP share the same chemistry with CNTs and thus exhibit similar properties. Their basic differences are that i) CNTs have tubular geometry which can lead to composites with lower percolation threshold whereas graphite fillers have a layered structure and ii) CNTs’ high cost limits their use as polymer reinforcements for engineering composites.
Polymer nanocomposites can exhibit unique properties including superior mechanical performance. The main reason is that as the size of the reinforcement decreases and especially at relatively high reinforcement content the filler/polymer interface dominates and stress transfer from one material to the other is very efficient assuming perfect interfacial contact. However this is not the case observed experimentally where voids along the filler/polymer contact line limit the stress transfer ability and result in properties lower than those expected theoretically based on micromechanical models such as the one proposed by Halpin-Tsai [4]. Specifically, addition of 5 wt% CNTs in polystyrene resulted in tensile modulus of 1.25 GPa whereas the Halpin-Tsai model predicted modulus is 16 GPa [5]. The difference between theoretical predictions and experimental data becomes even larger at higher nanofiller loadings [6].
In addition to the filler/polymer interface other factors such as the aspect ratio of the filler, its orientation and dispersion within the polymer matrix also strongly affect its reinforcing efficiency. Both CNTs and xGnP tend to form agglomerates due to the presence of strong intermolecular van der Waals interactions. The agglomerates have smaller aspect ratio and surface area than the individually dispersed fillers and combined with the lack of homogeneous dispersion within the polymer, they result to insufficient stress transfer and thus composites with poor mechanical properties [7-9]. An example of limited stress transfer in CNT/polymer composites due to agglomeration is given in [10,11] where slippage occurs between the adjacent shells of multiwall nanotubes as recorded by Raman spectroscopy.
Finally, the presence of an interphase, a third phase of finite dimensions and distinct properties, between the polymer and the filler also affects strongly the overall properties of the composites. According to a study comparing the reinforcing efficiency of CNTs and graphite platelets using micromechanical models it is indicated that i) CNTs have superior mechanical reinforcement potential for aligned orientations, while the high in-plane isotropic modulus of nanoplatelets allows better reinforcing in random orientations and ii) CNTs generate a significantly larger amount of interphase. Although these theoretical studies provide useful insight on the effective properties of the composites, there is need for modifying the existing theoretical models in order to account for presence and characteristics of the interphase, filler agglomeration and effective aspect ratio in order to eliminate the gap between theoretical predictions and experimental data.
This study investigates the effect of filler content (wt%), presence of interphase and agglomerates on the effective Young’s modulus of polypropylene (PP) based nanocomposites reinforced with xGnP and CNTs. Experimentally observed nanofiller characteristics such as, the filler’s aspect ratio and agglomeration, and width and modulus of the interphase are considered in the Halpin-Tsai and the model predictions are compared to experimentally determined modulus.
The polymer used in this study is polypropylene powder, (profax 631, melt flow index 12 g/10 min) by Basell. Two types of nanofillers are used i) exfoliated graphite nanoplatelets, xGnPTM, with an average diameter of ~1 micron and thickness in the range of 10~20 nm purchased from XG Sciences, East Lansing MI, and ii) multi-walled carbon nanotubes (outer diameter: 20~30 nm, inner diameter: 5~10 nm, length: 10~30 ㎛, purity >95 wt%, ash<1.5 wt%), purchased from Cheap Tubes, VT.
2.2. Preparation of nanocomposites
The xGnP and CNT fillers are used as received. In the case of xGnP/PP nanocomposites, the compounding is achieved by coating the PP powder with xGnP followed by melt mixing. The coating is done according to the method described in [12] and the composite powder is fed to a twin screw extruder and is injection molded. The CNT/PP nanocomposites are fabricated by melt compounding and injection molding. A DSM Micro 15 cm3 Compounder, (vertical, co-rotating twin-screw micro extruder) and 10 cc injection molding machine are used for melt mixing and injection molding respectively. The materials are mixed for 3 min at a barrel temperature of 180℃ and screw speed of 245 rpm. The mold temperature is 80℃ and the injection pressure is ~7.5 bar. Dog bone tensile specimens according to ASTM D638 are made. The conditions used for melt mixing and injection molding of both the xGnP/PP and CNT/PP composites are the same.
2.3. Characterization of nanocomposites
The stress-strain relation including tensile modulus of xGnP/PP and CNT-PP composites are determined as a function of filler wt% according to ASTM D638 using an Instron 33R 4466 apparatus. A 500 N load cell and an extensometer (Instron 2630-101) with a gage length of 10 mm are used. A displacement control with a velocity of 2.54 mm/s is applied. Each data point reported is an average of five samples.
The interphase characteristics such as width and stiffness of the composites are determined using atomic force microscopy (AFM). A Veeco AFM with Nanoscope V controller, operated in tapping mode using an aluminum coated cantilever (length of 225 ㎛, spring constant of 45 N/m, resonance frequency of 190 KHz), with silicon tip of 2 nm radius provided by Nanoscience Instruments Inc. Phoenix, AZ is used. The interphase is defined in the phase image of the scanned composite surface as the area where there is a sudden change in the phase indicating transition between materials with different stiffness (modulus). The width of this transition area is considered as the interphase width. The phase gradient along the interphase is directly related to its stiffness or modulus. Composites with 0.1 wt% filler content are studied in order to avoid interactions among fillers because the interphase generated around adjacent fillers can overlap and have detrimental effects on the measurement [13].
The tensile modulus of xGnP/PP and CNT/PP composites determined experimentally as a function of the fillers’content (wt%) is shown in Table 1. Five samples are tested for each filler type and content and the average values along with the corresponding standard deviations are shown. In general the modulus is increased with filler content for both
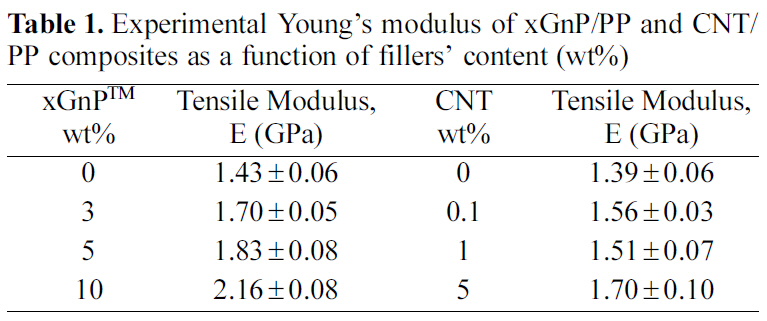
Experimental Young’s modulus of xGnP/PP and CNT/PP composites as a function of fillers’ content (wt%)
fillers used. The increase is more dramatic in case of xGnP. The lower than expected modulus increase in case of CNTs may be due to presence of agglomerates and poor dispersion a result of the insufficient mixing during melt compounding.
3.2. Interphase characterization
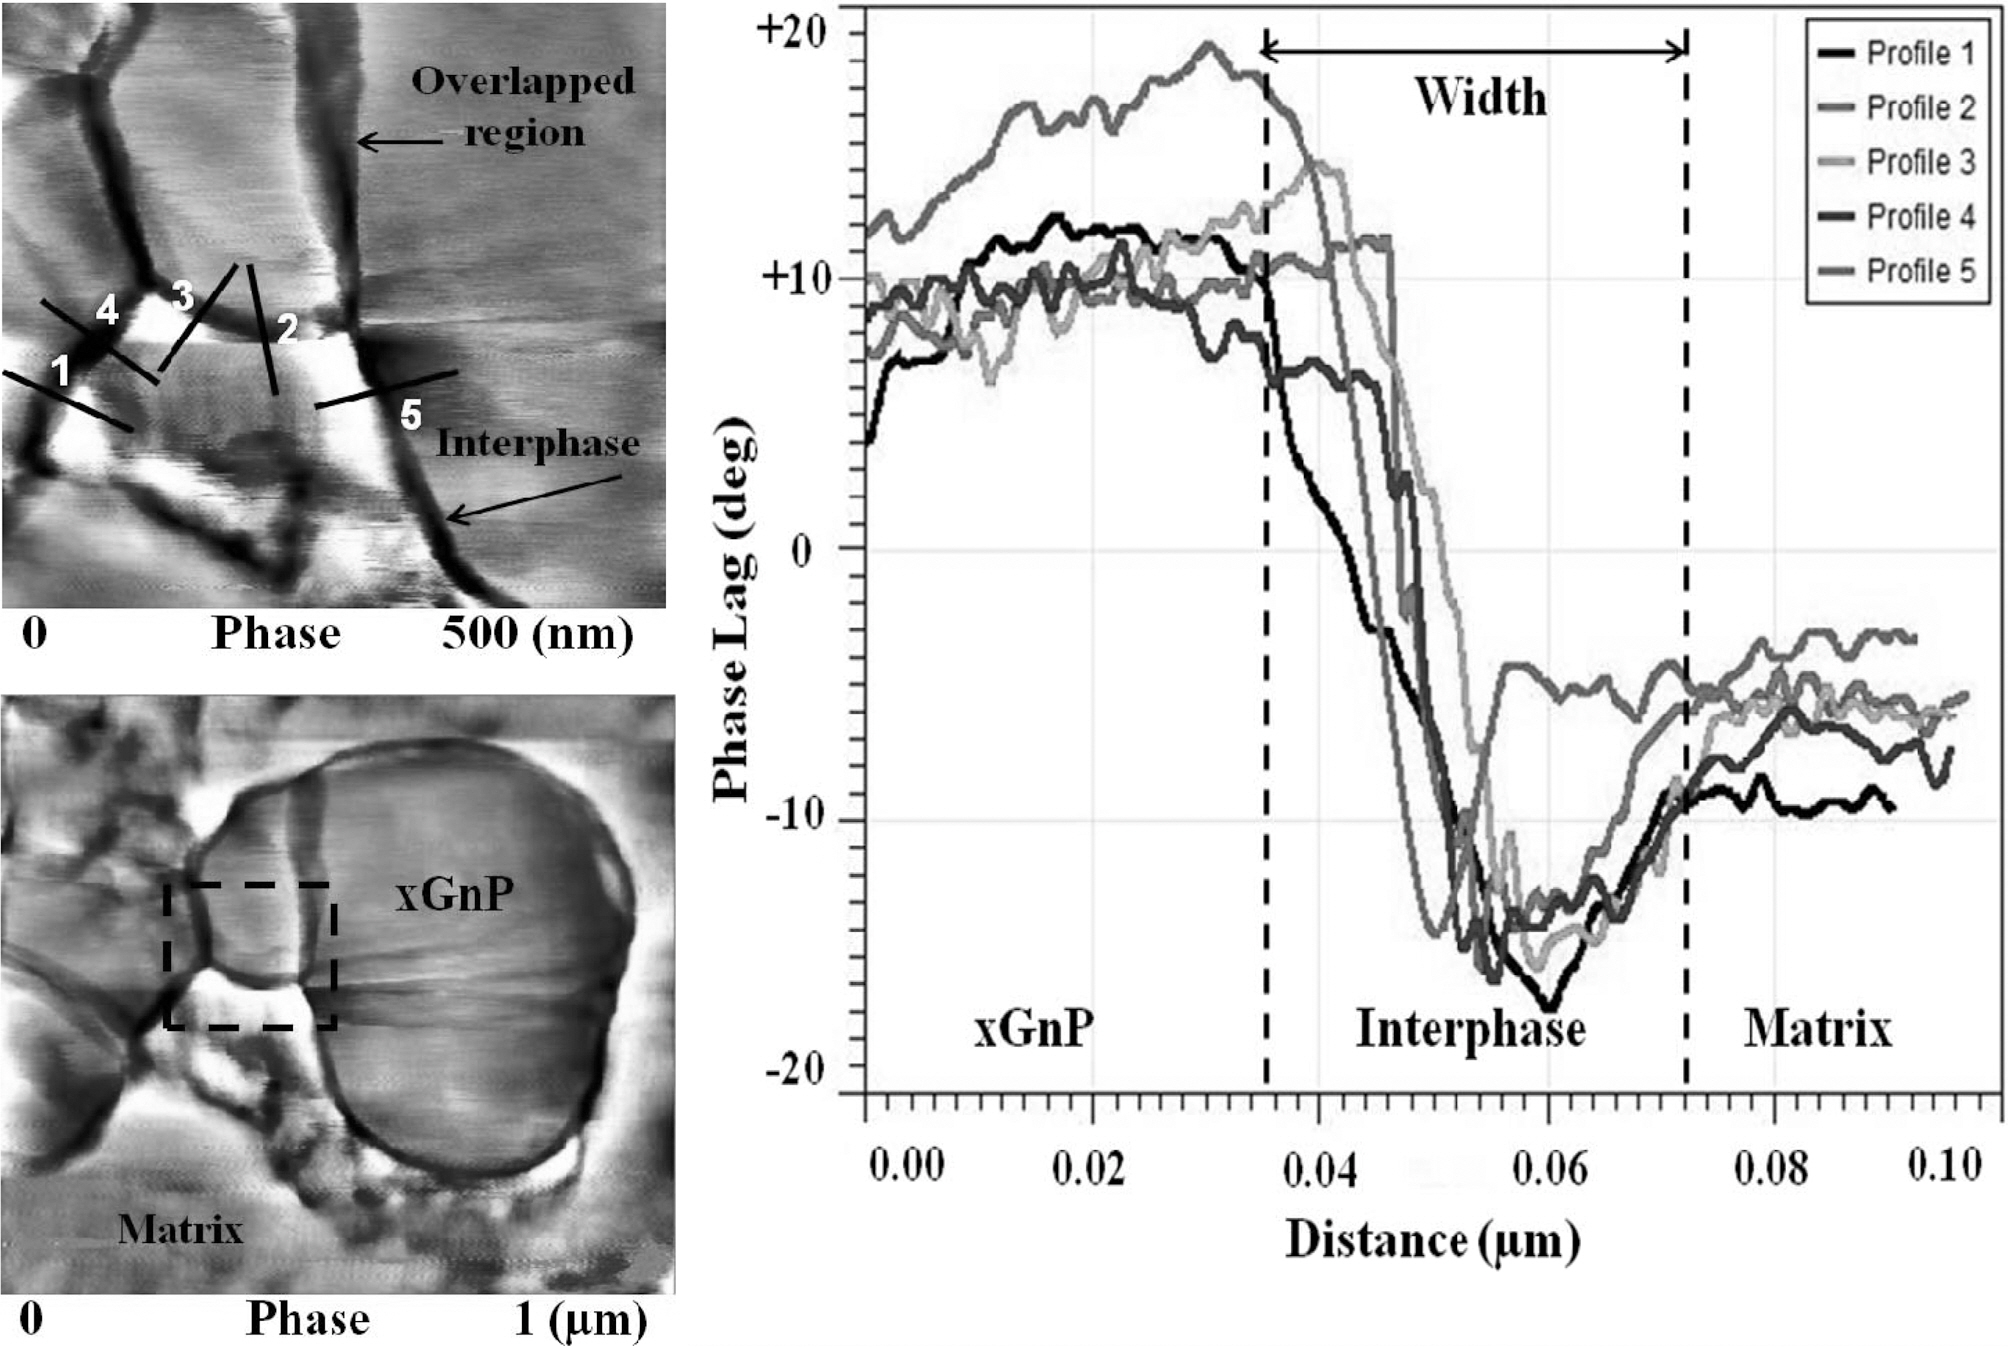
The xGnP/PP and CNT-PP interphase width and stiffness are determined by the AFM phase images. Phase imaging measures the phase lag in the oscillation frequency when the AFM tip interacts with areas/materials of different mechanical properties. It is an extremely sensitive method that can differentiate surface features of different stiffness [13,14]. Fig. 1a is a representative phase image of the top surface of 0.1 wt% xGnP/PP composite. The following observations can be made: i) the diameter of xGnP is about 800 nm which is within the diameter range provide by the supplier; ii) there is a clear transition area, the interphase, between the PP matrix and the xGnP as shown also in Fig. 1b which is a zoom-in of Fig. 1a.
The width of the interphase is determined using the AFM software by measuring the phase lag across lines (profiles) that are drawn on the phase image. Five such lines that are initiated from the polymer pass through the interphase and end at the xGnP are shown in Fig. 1b. The phase lag across each line (profile) is shown in Fig. 1c. As shown in Fig. 1c there are two distinct plateau values at +10 degrees and -10 degrees that correspond to xGnP (left) and PP (right) respectively. A phase lag that relates to stiffness along the interphase and that is not a smooth transition from the xGnP to the PP stiffness value but it is significantly lower than the PP value indicating existence of voids and imperfect xGnP/PP contact is also seen in Fig. 1c.
The average interphase width of xGnP/PP composites based on Fig. 1c and similar figures obtained by scanning different composite areas is ~ 30 nm. Considering that the different stiffness corresponds to different modulus, the average Young’s modulus of the interphase is calculated using Fig. 1c as follows. The transition from the xGnP to the PP modulus is assumed to be linear and the voids along the interphase are considered as material with zero modulus. The rule of mixtures (ROM) is used to estimate the average modulus of the interphase by taking into consideration the width and average modulus of two distinct regions: a) the region with the linear modulus transition that extends to ~2/3 of the overall interphase width i.e. ~20 nm and b) the voids and imperfect contact with zero modulus that extends to ~1/3 of the overall interphase width. Using the ROM and based on the above assumptions the interphase modulus is ~12 GPa.
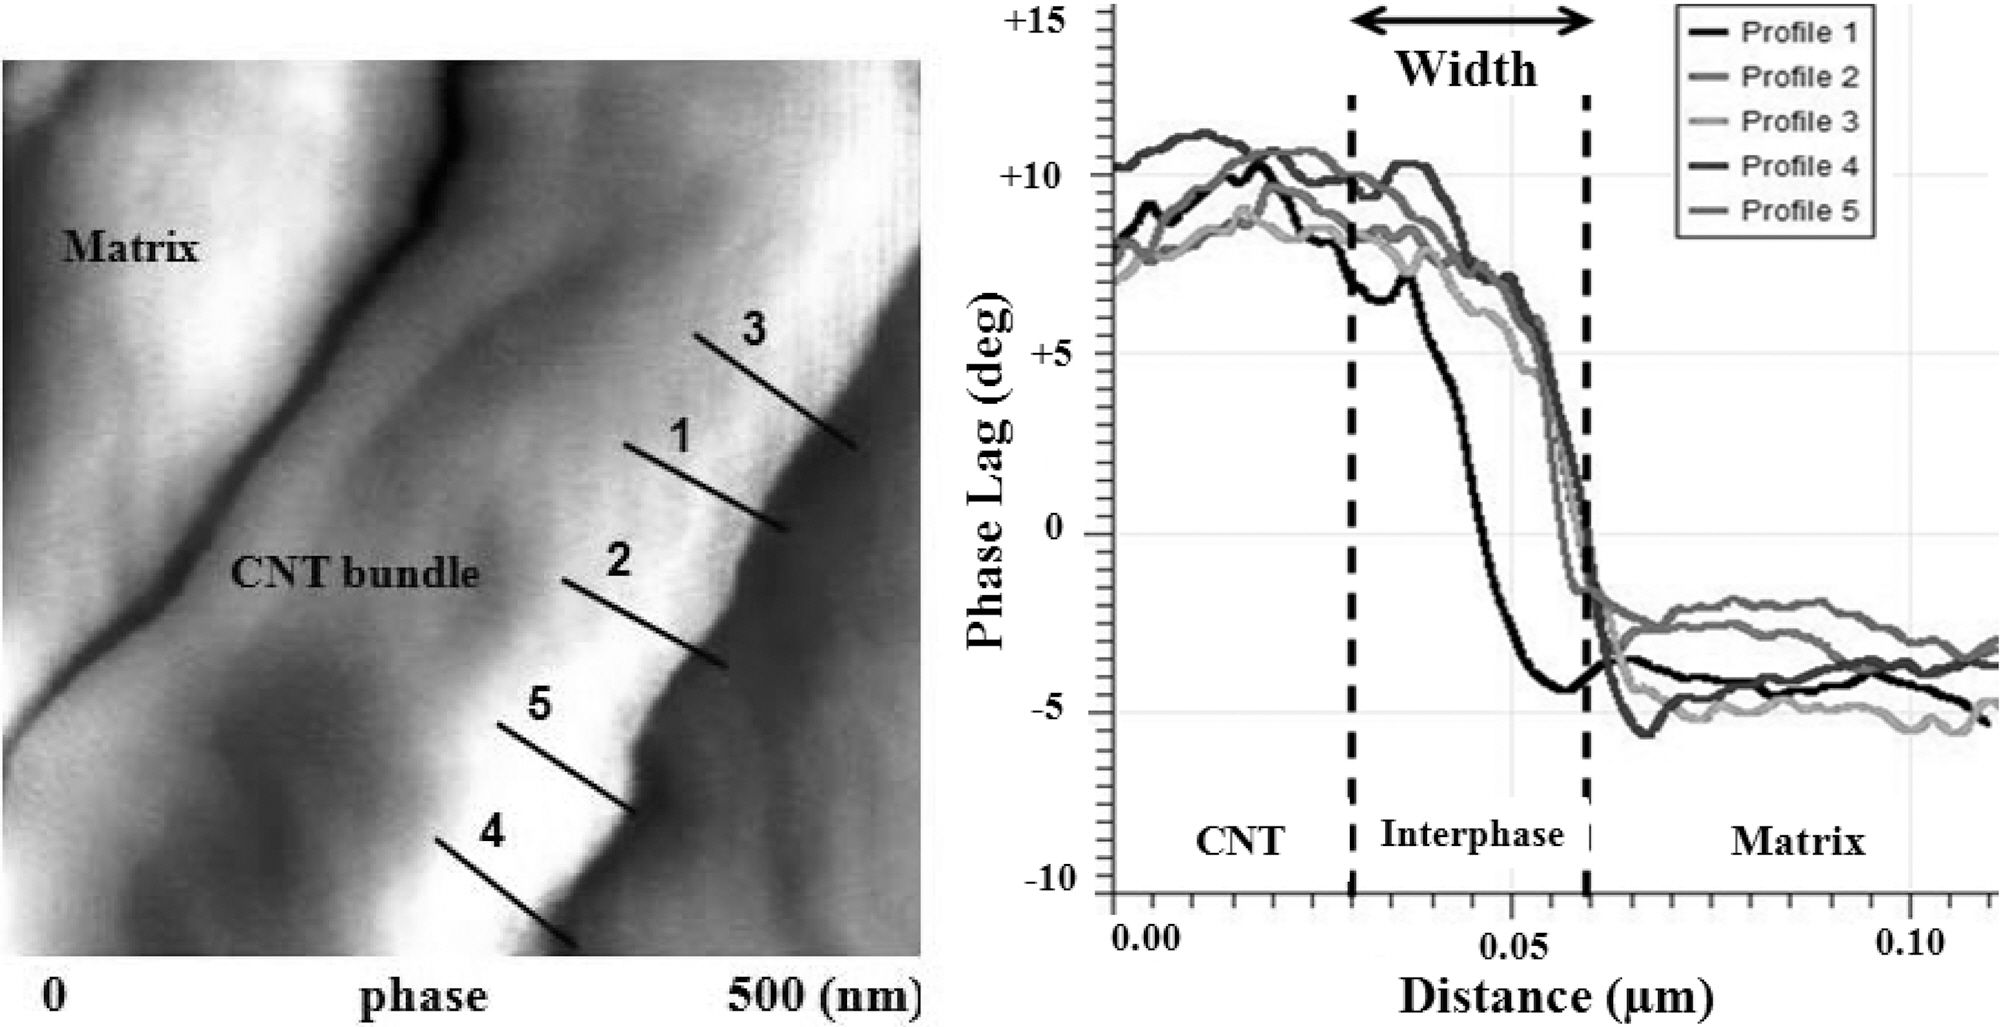
The same approach is used to characterize the width and modulus of the interphase in case of CNT/PP composites. A representative AFM phase image and the corresponding phase lag analysis is shown in Fig. 2. As shown in Fig. 2b there is no evidence of voids at the interphase (phase lag is higher than that of PP). However, it is noted that based on similar images of different areas there are cases where there are voids at the interphase (phase lag is lower than that of neat PP) as observed in case of xGnP/PP composites shown in Fig. 1c. Based on the analysis described above for the xGnP/PP case the interphase width for CNT/PP composites is in the range of 20~60 nm and the average interphase modulus is ~12 GPa.
3.3. Experimental determination of filler characteristics
The aspect ratio of xGnP and CNTs, once the composites have been made, are determined experimentally using AFM.In case of xGnP/PP composites, cross-sectional analysis is performed on the height images obtained by tapping mode AFM. The average height (thickness) and diameter of xGnP
[Table 2.] Properties of reinforcements and interphase determined by different methods
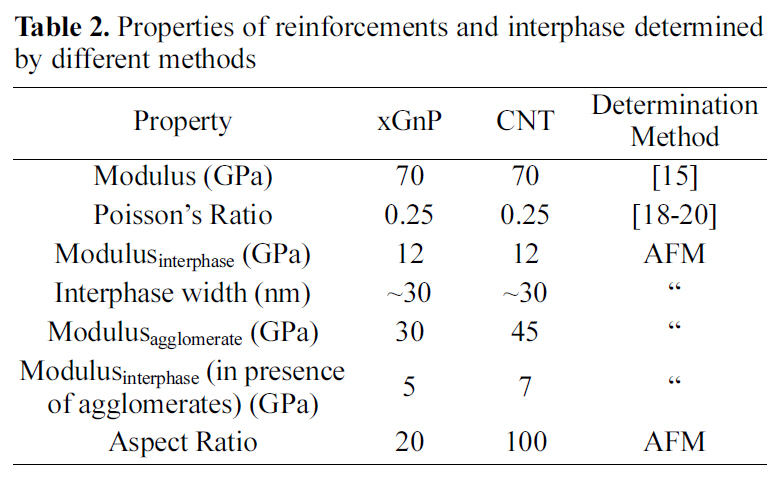
Properties of reinforcements and interphase determined by different methods
are ~40 nm and 800 nm respectively resulting to an aspect ratio of 20 which is significantly smaller than the theoretical aspect ratio of ~50 calculated based on the geometric specifications provided by the supplier. This indicates the presence of xGnP agglomerates within the PP matrix. AFM is also used to investigate the presence of CNT agglomerates. Fig. 2a shows a CNT bundle with an average diameter of~200 nm. Considering according to the supplier that the diameter of an individual CNT is ~25 nm, the measured aspect ratio is ten times smaller than the theoretical one, assuming that the CNTs are not broken during melt mixing.
Agglomerates are expected to have lower modulus than individual CNTs or xGnP. In this study, this is accounted for by two ways. In case of CNTs the modulus of the agglomerate is calculated based on rule of mixtures considering the agglomerate as a composite consisting of CNTs and voids. This resulted in an agglomerate modulus of 45 GPa. In case of xGnP, a rough assumption that the modulus is proportional to the aspect ratio is made resulting to an agglomerate modulus of 30 GPa. The modulus of CNT is considered as 70 GPa according to [1] and it is assumed that xGnP has also a modulus of 70 GPa considering the two materials have same chemistry and thus similar properties. It is noted that this modulus value is significantly lower than the modulus of CNT and xGnP reported in literature which is determined based on either theoretical calculations or testing of pure CNT or xGnP [15].
In presence of agglomerates the modulus of interphase, calculated using AFM phase images as shown in Fig. 2, is also reduced because it is calculated based on the modulus of the agglomerate and not of that of individual CNTs or xGnP. Table 2 shows the modulus values of the fillers and the interphases in presence and absence of filler agglomerates and as a function of the interphase width that are used in the theoretical analysis. The way each of these values is determined is also provided in Table 2.
The main limitations of micromechanical models used to predict the properties of polymer composites including Young’s modulus are that they assume perfect contact at the filler/polymer interface, homogeneous dispersion and specific filler orientation [16] which is not the case observed experimentally especially in nanocomposites, where the interface dominates and there is presence of a third “material” the interphase. A comparison between model predictions and experimentally determined modulus values for both xGnP/PP and CNT/PP composites as a function of the filler loading is provided below. The model used in this study is the one proposed by Halpin-Tsai which accounts for the mechanical properties of components and fillers’geometry and orientation and is described by the following equations [4,17]:
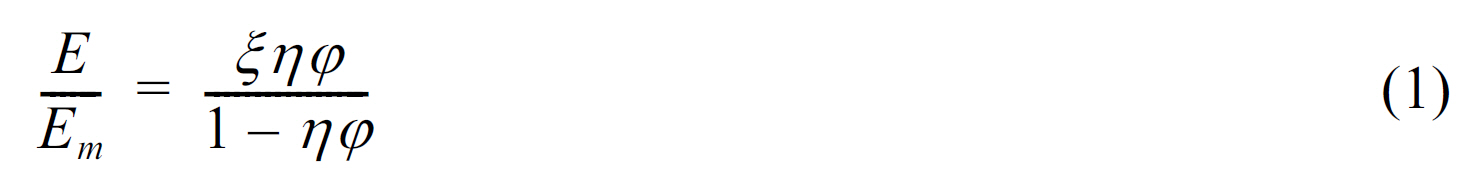
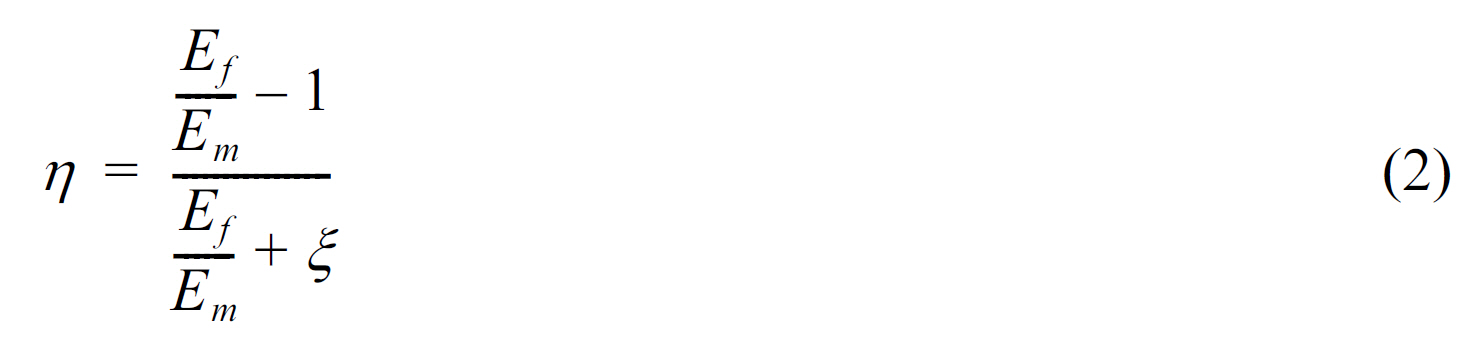
where E, Em, and Ef, are the Young’s modulus of the composite, matrix and filler respectively, ξ is a geometrical correction factor which is a function of fillers’ orientation and aspect ratio, and and φ is the filler volume fraction. The factor ξ is considered as 2
The model is modified to account for the effect of agglomeration and interphase. The agglomeration is accounted for by using reduced modulus and effective aspect ratio of the agglomerates estimated using AFM, whereas the interphase is considered as a third component with modulus and thickness estimated also by AFM. The interphase is accounted for by calculating the effective modulus of the filler/interphase or agglomerate/interphase using the rule of mixtures and then using Equations (1) and (2) considering the filler/interphase or agglomerate/interphase as the new reinforcement. The modulus values, aspect ratio and thickness of interphase for both xGnP and CNT used in the theoretical analysis are listed in Table 2. The Young’s modulus of the neat PP is considered to be 1.39 GPa based on the tensile testing. The effects of interphase, agglomeration and aspect ratio on the theoretical tensile modulus of the xGnP/PP and CNT/PP composites predicted by Halpin-Tsai model are compared to the experimentally determined modulus.
3.4.1. Analysis for xGnP/PP composites
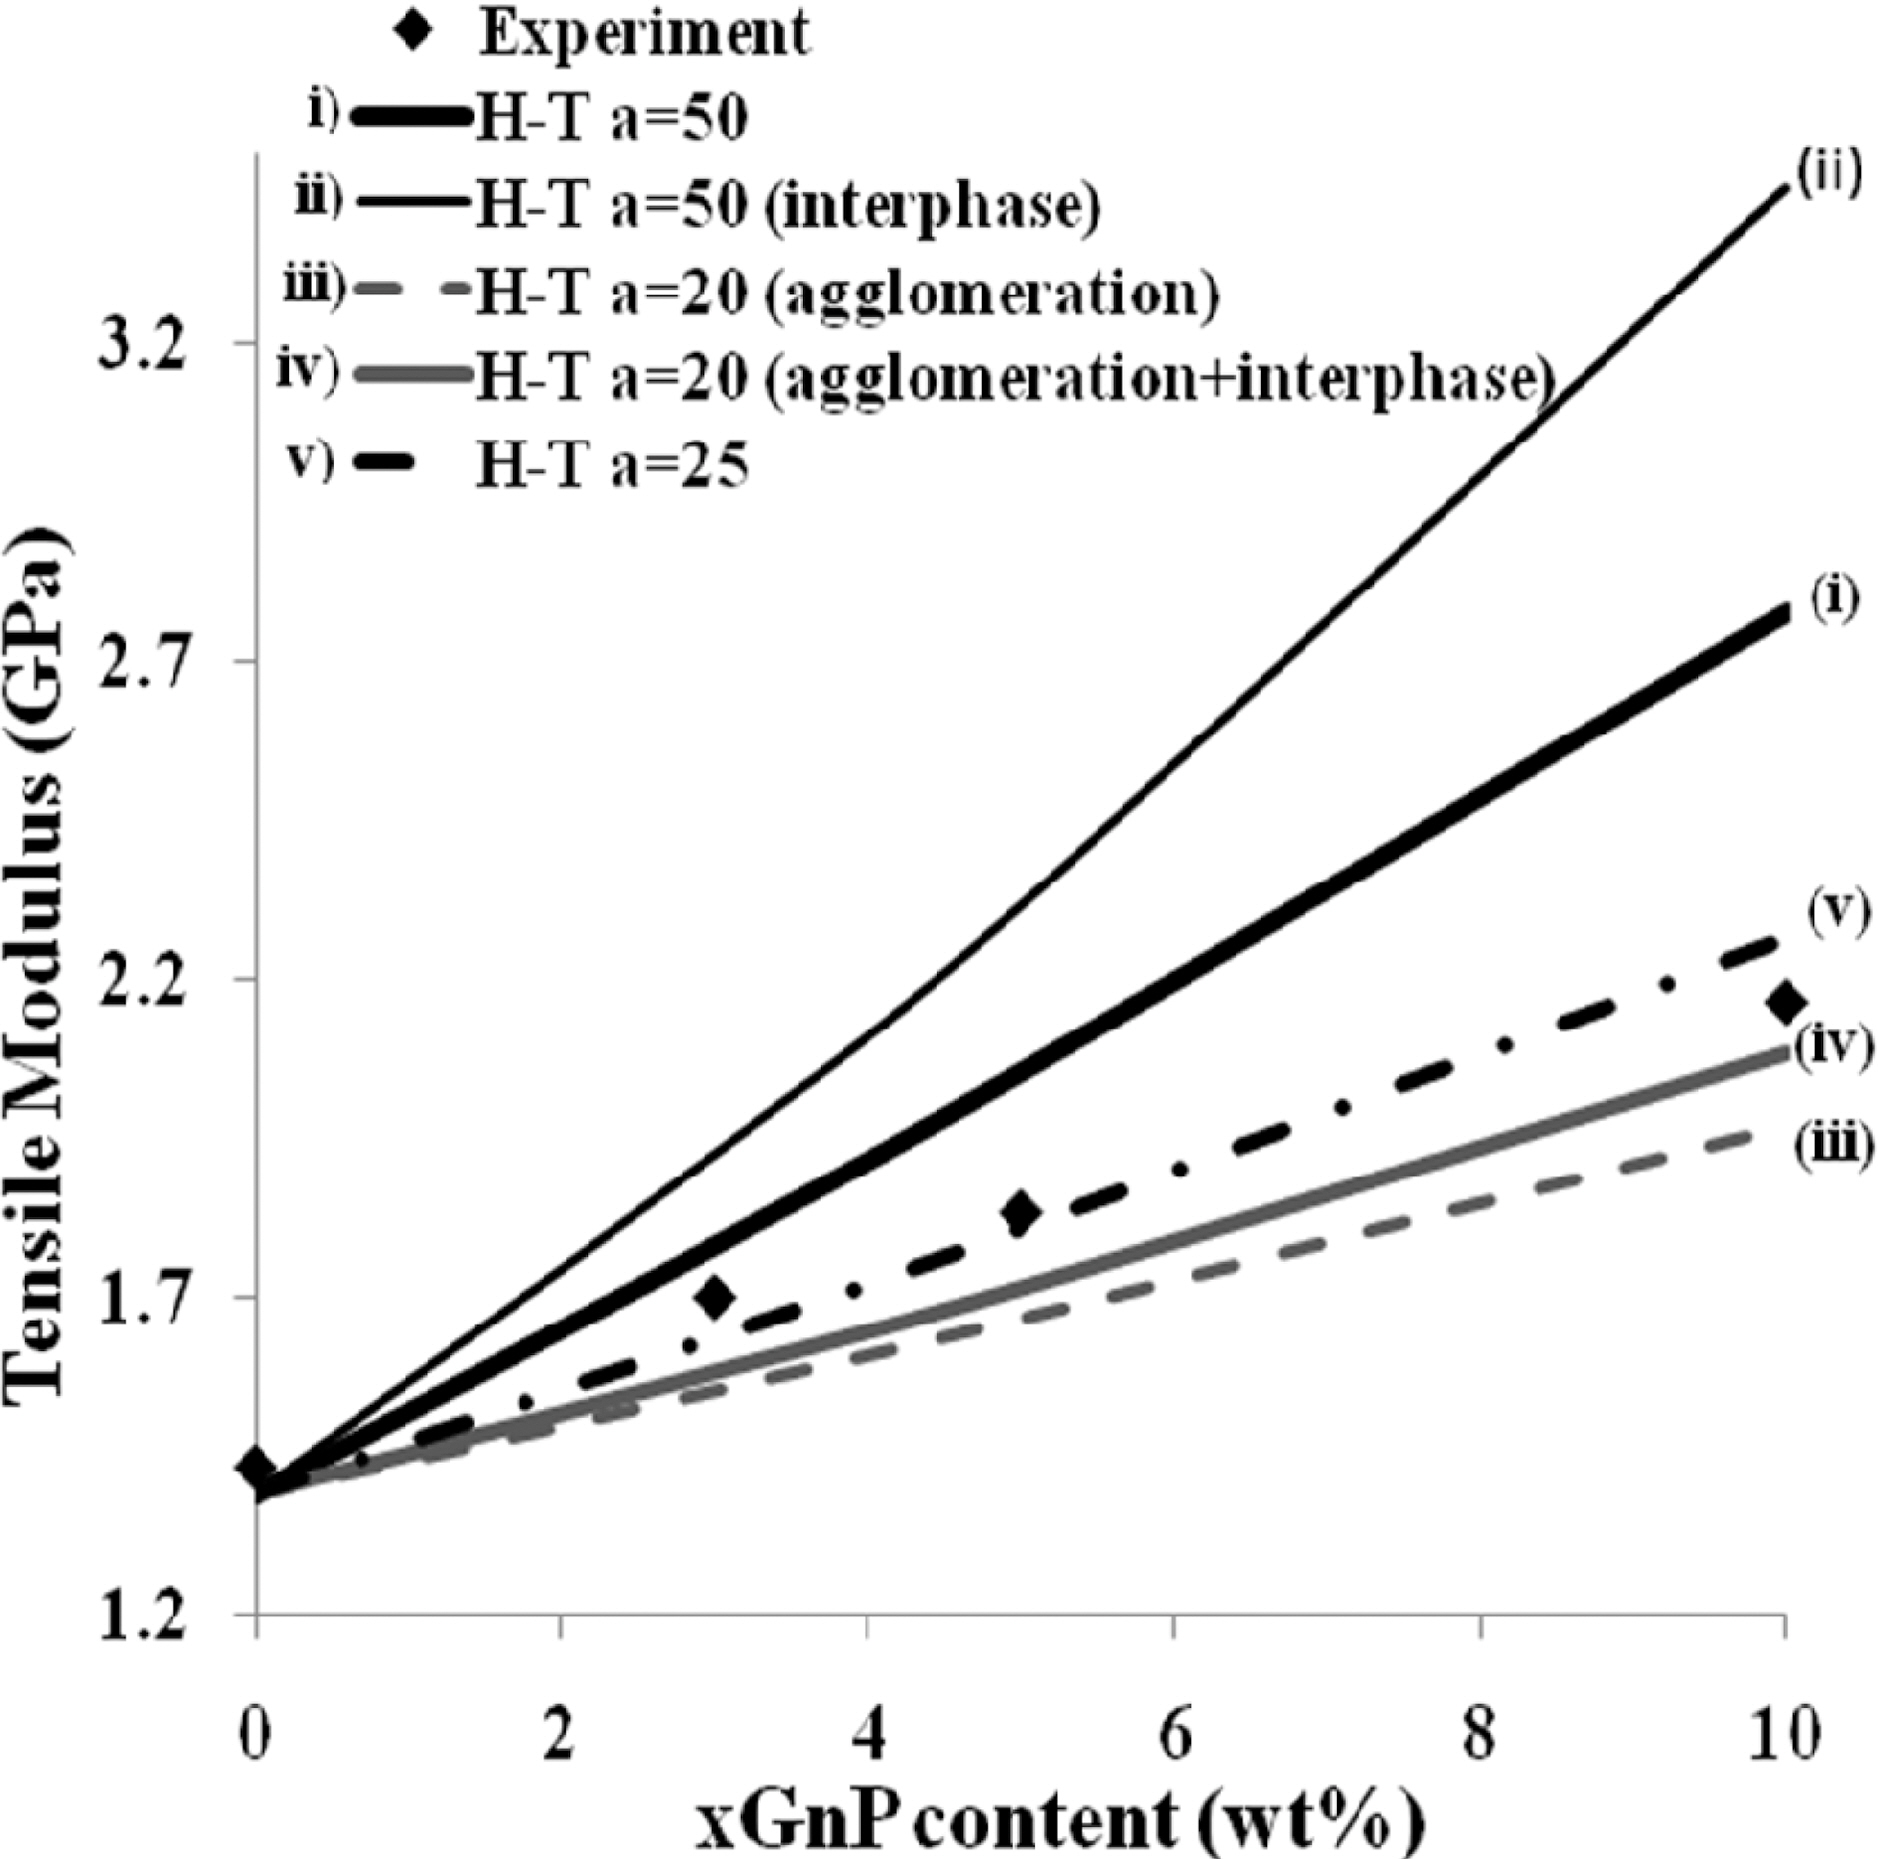
The Halpin-Tsai model predictions for xGnP/PP composites as a function of xGnP content (wt%) and their comparison to experimental data are presented in Fig. 3. The analysis is performed for five different cases i) aspect ratio of 50, which is based on data by the supplier referred as H-T
ratio of 20 which is determined experimentally and accounts for agglomeration referred as H-T a=20 (agglomeration), iii) aspect ratio of 50 considering interphase referred as H-T a=50 (interphase), and iv) aspect ratio of 20 considering interphase referred as H-T a=20 (agglomeration+interphase). In the fifth case presented, H-T a=25, the aspect ratio is backcalculated by fitting the model to the experimental data considering no effect of neither agglomeration nor interphase.
As shown the Halpin-Tsai model over-predicts the modulus compared to experimental data when the aspect ratio of 50 is used indicating that agglomeration and thus reduced aspect ratio needs to be accounted for. The model predicts even higher modulus when the interphase is considered which is expected because the modulus of interphase as determined by AFM is ~12 GPa which is significantly higher than that of neat PP indicating existence of a stiffer phase around the filler. The model under-predicts the modulus when the aspect ratio of 20 is used which means that agglomerates are accounted for. The underprediction might be due to a very conservative estimation of the aspect ratio based on AFM. The model predicts values closer to the experimental data when the aspect ratio is 20 and interphase is considered. This demonstrates the competing effects of enhanced (stiffer) interphase and reduced aspect ratio on the effective modulus of the composites. Finally the ideal case of homogeneous dispersion in the single xGnP level and no presence of interphase is modeled by Halpin-Tsai and an aspect ratio of~25 is back-calculated which is significantly lower than the average value provided by the supplier.
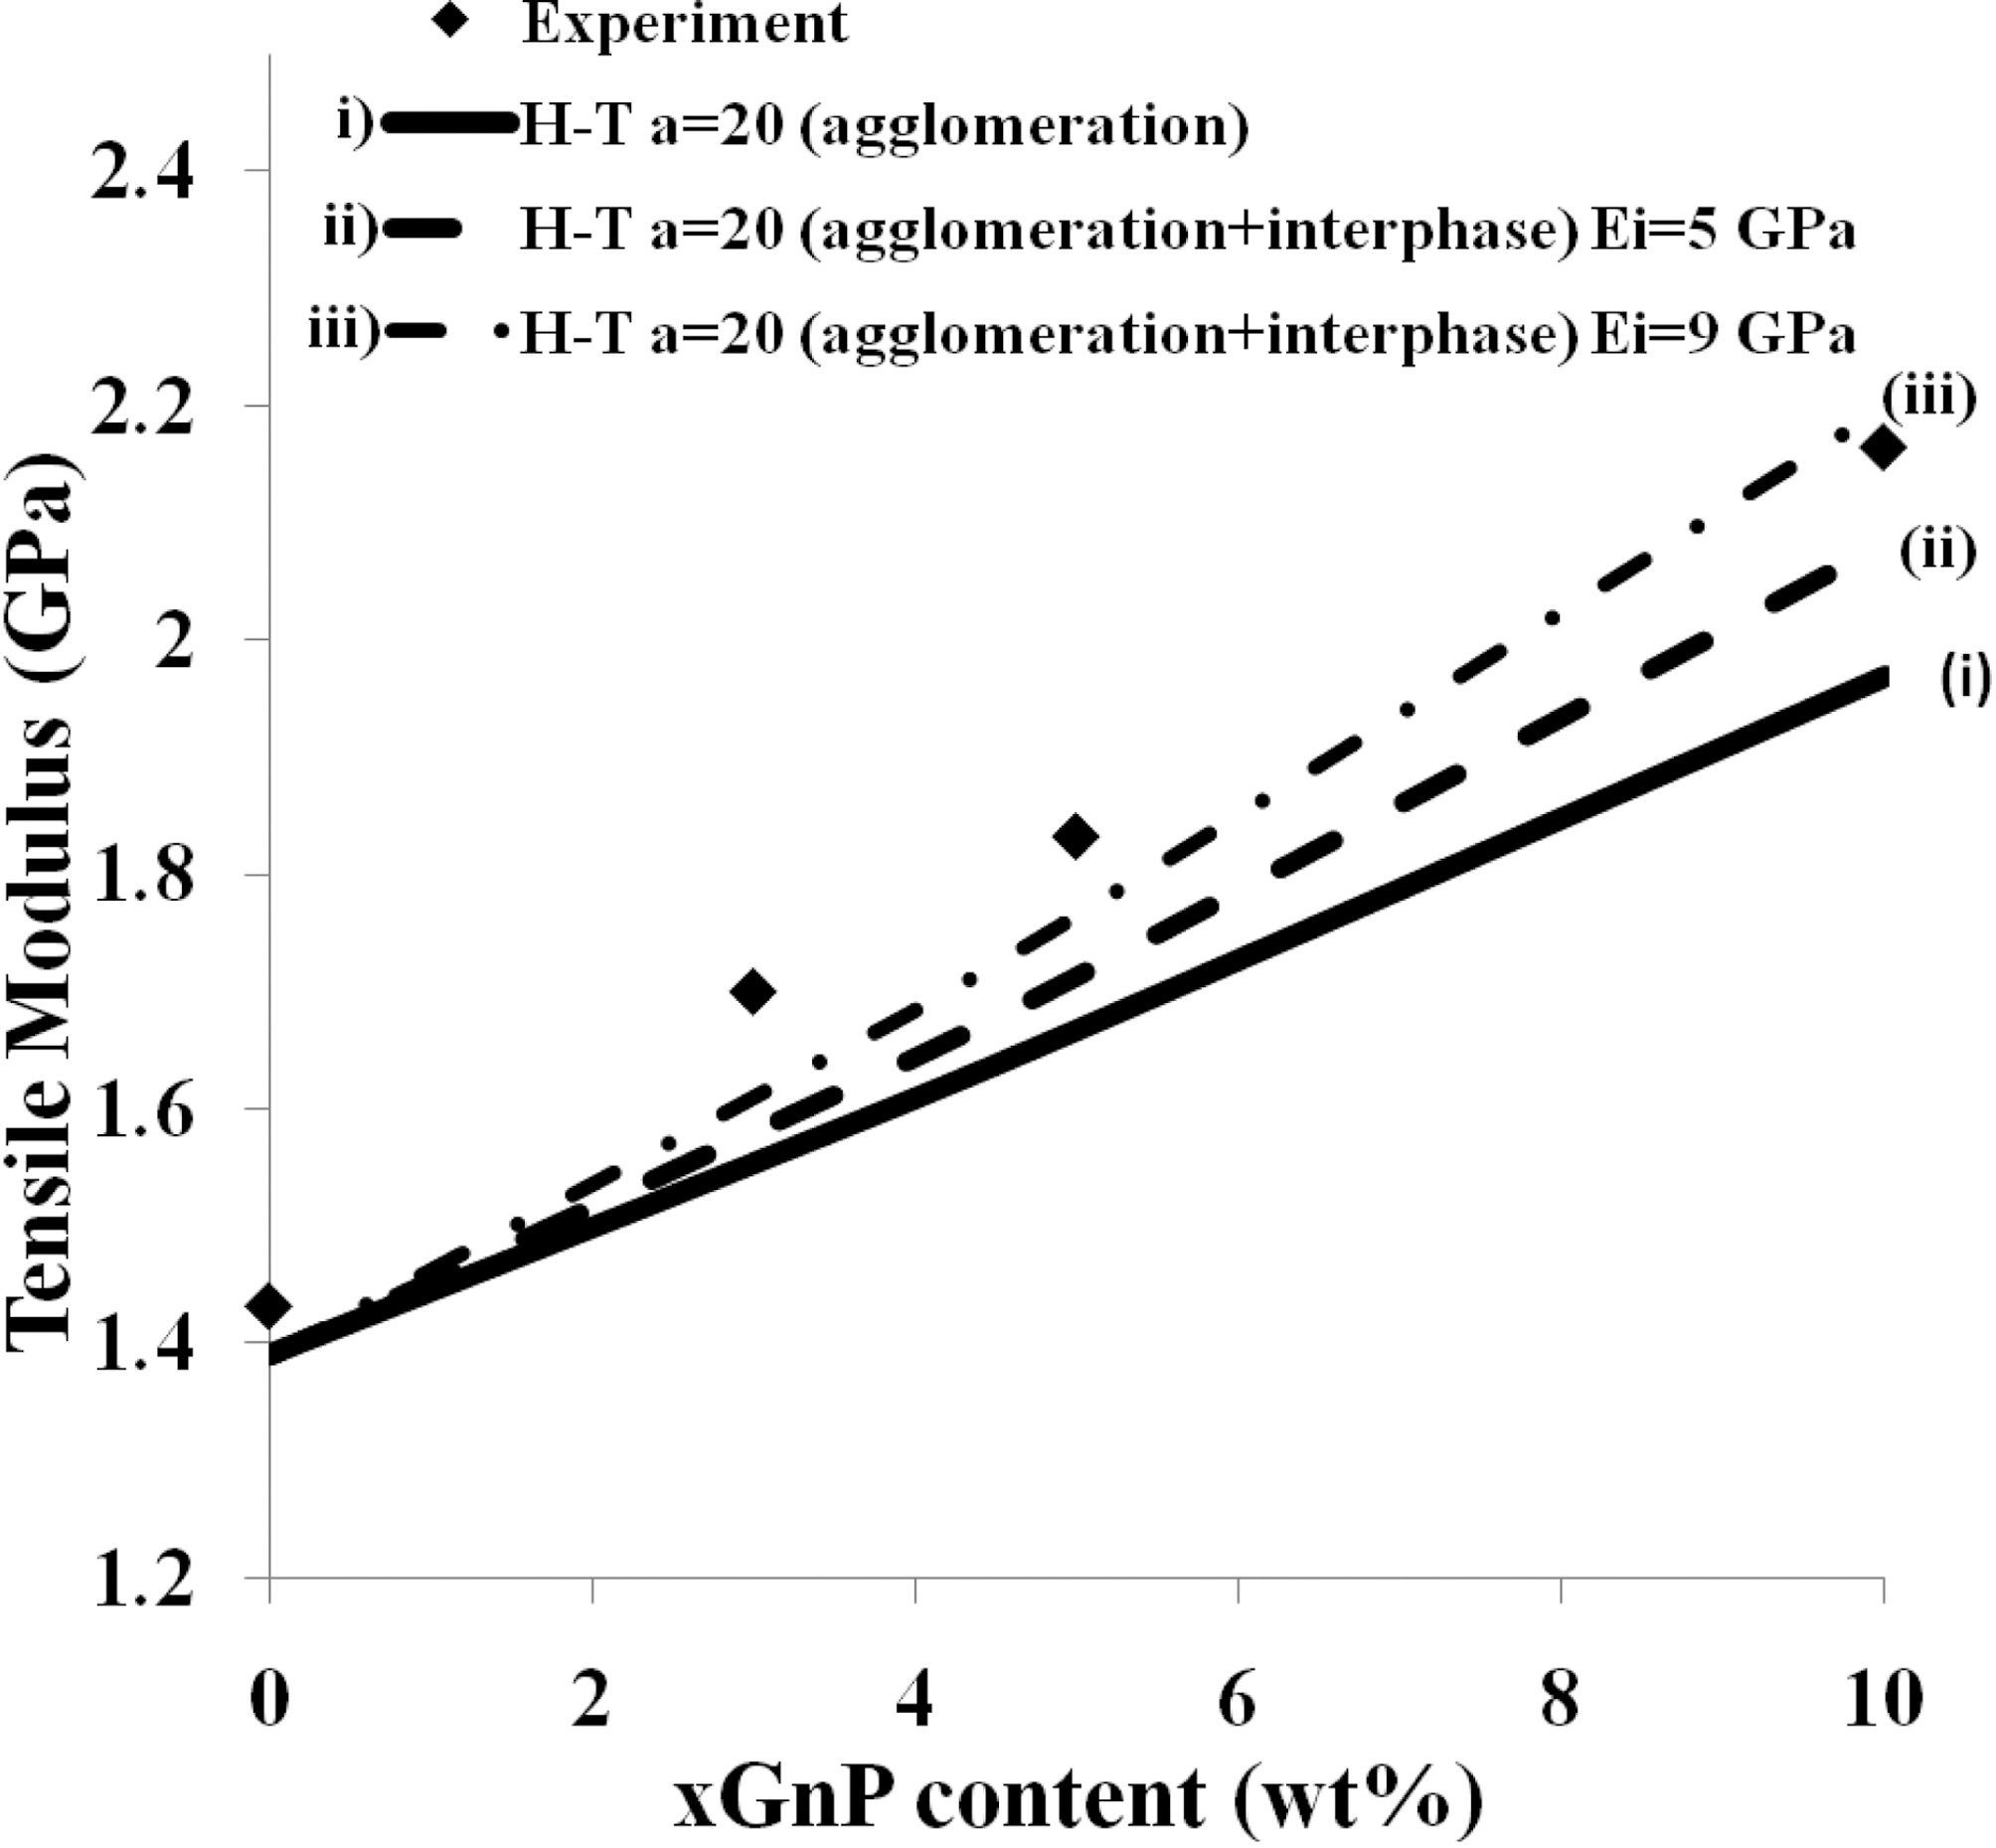
The Halpin-Tsai model is also used to back-calculate the modulus of the interphase assuming an aspect ratio of 20, as determined by AFM, which indicates presence of agglomerates. The three cases presented in Fig. 4 are i) aspect ratio of 20 referred as H-T a=20, (agglomeration), ii) aspect ratio of 20 considering interphase with modulus of 5 GPa as determined by AFM, referred as H-T a=20 (agglomeration+interphase) Ei=5 GPa and iii) aspect ratio of 20 considering interphase with modulus of 9 GPa, backcalculated by fitting the experimental data, referred as H-T a=20 (agglomeration+interphase) Ei=9 GPa.
3.4.2. Analysis for CNT/PP composites
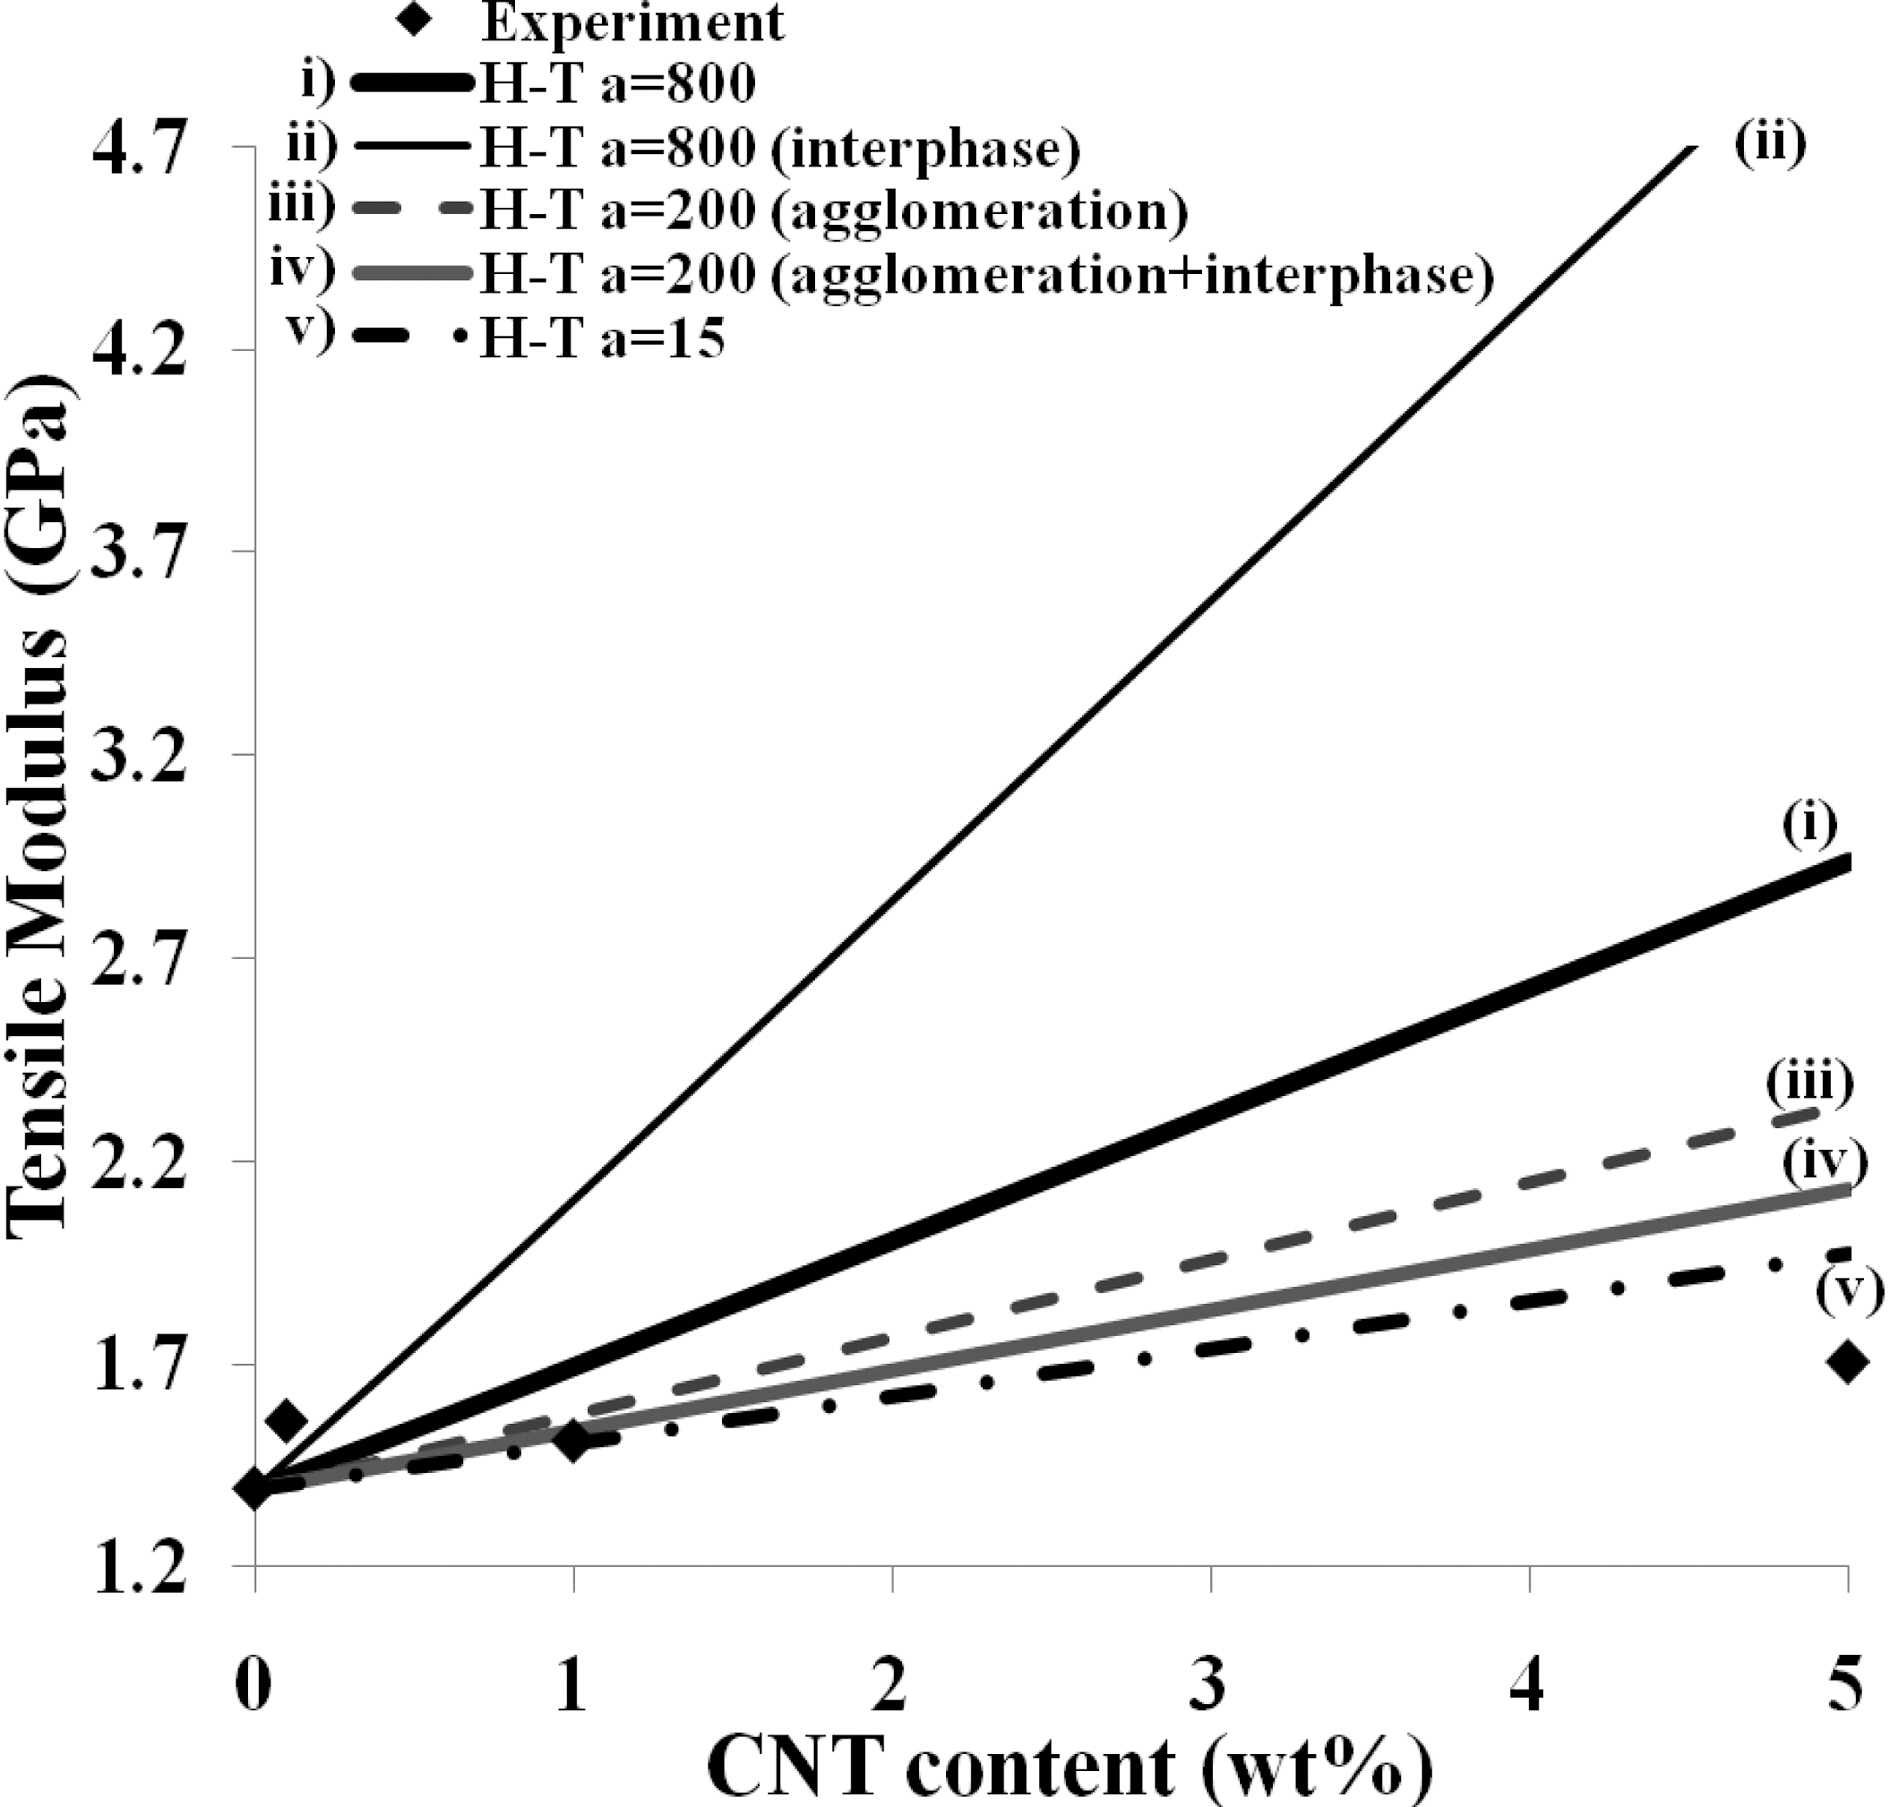
Similar analysis is performed for the case of CNT/PP composites. The Halpin-Tsai model predictions as a function of CNT content (wt%) and their comparison to experimental data are presented in Fig. 5. The two aspect ratios considered are 800, based on the supplier, and 200 based on AFM observations. For the ideal case of a=800 without considering interphase and agglomeration the model overpredicts the effective modulus of the composites. When interphase is account for with Ei=12 GPa as determined by AFM, the model predicts even greater values. However, for the reduced aspect ratio of 100, which indicates presence of agglomerates, the model predictions are closer to the experimental data. An interesting result from this analysis is that when a stiffer interphase (~7 GPa) for agglomerates is considered, the model predictions are even closer to the experimentally determined values (dotted gray line in Fig. 5) indicating that the effect of reduced aspect ratio on the
effective modulus of the CNT/PP composites dominates over the effect of a stiffer interphase. Finally the ideal case of homogeneous dispersion in the single CNT level and no presence of interphase is modeled by Halpin-Tsai and an aspect ratio of ~15 is back-calculated which is significantly lower than the average value provided by the supplier.
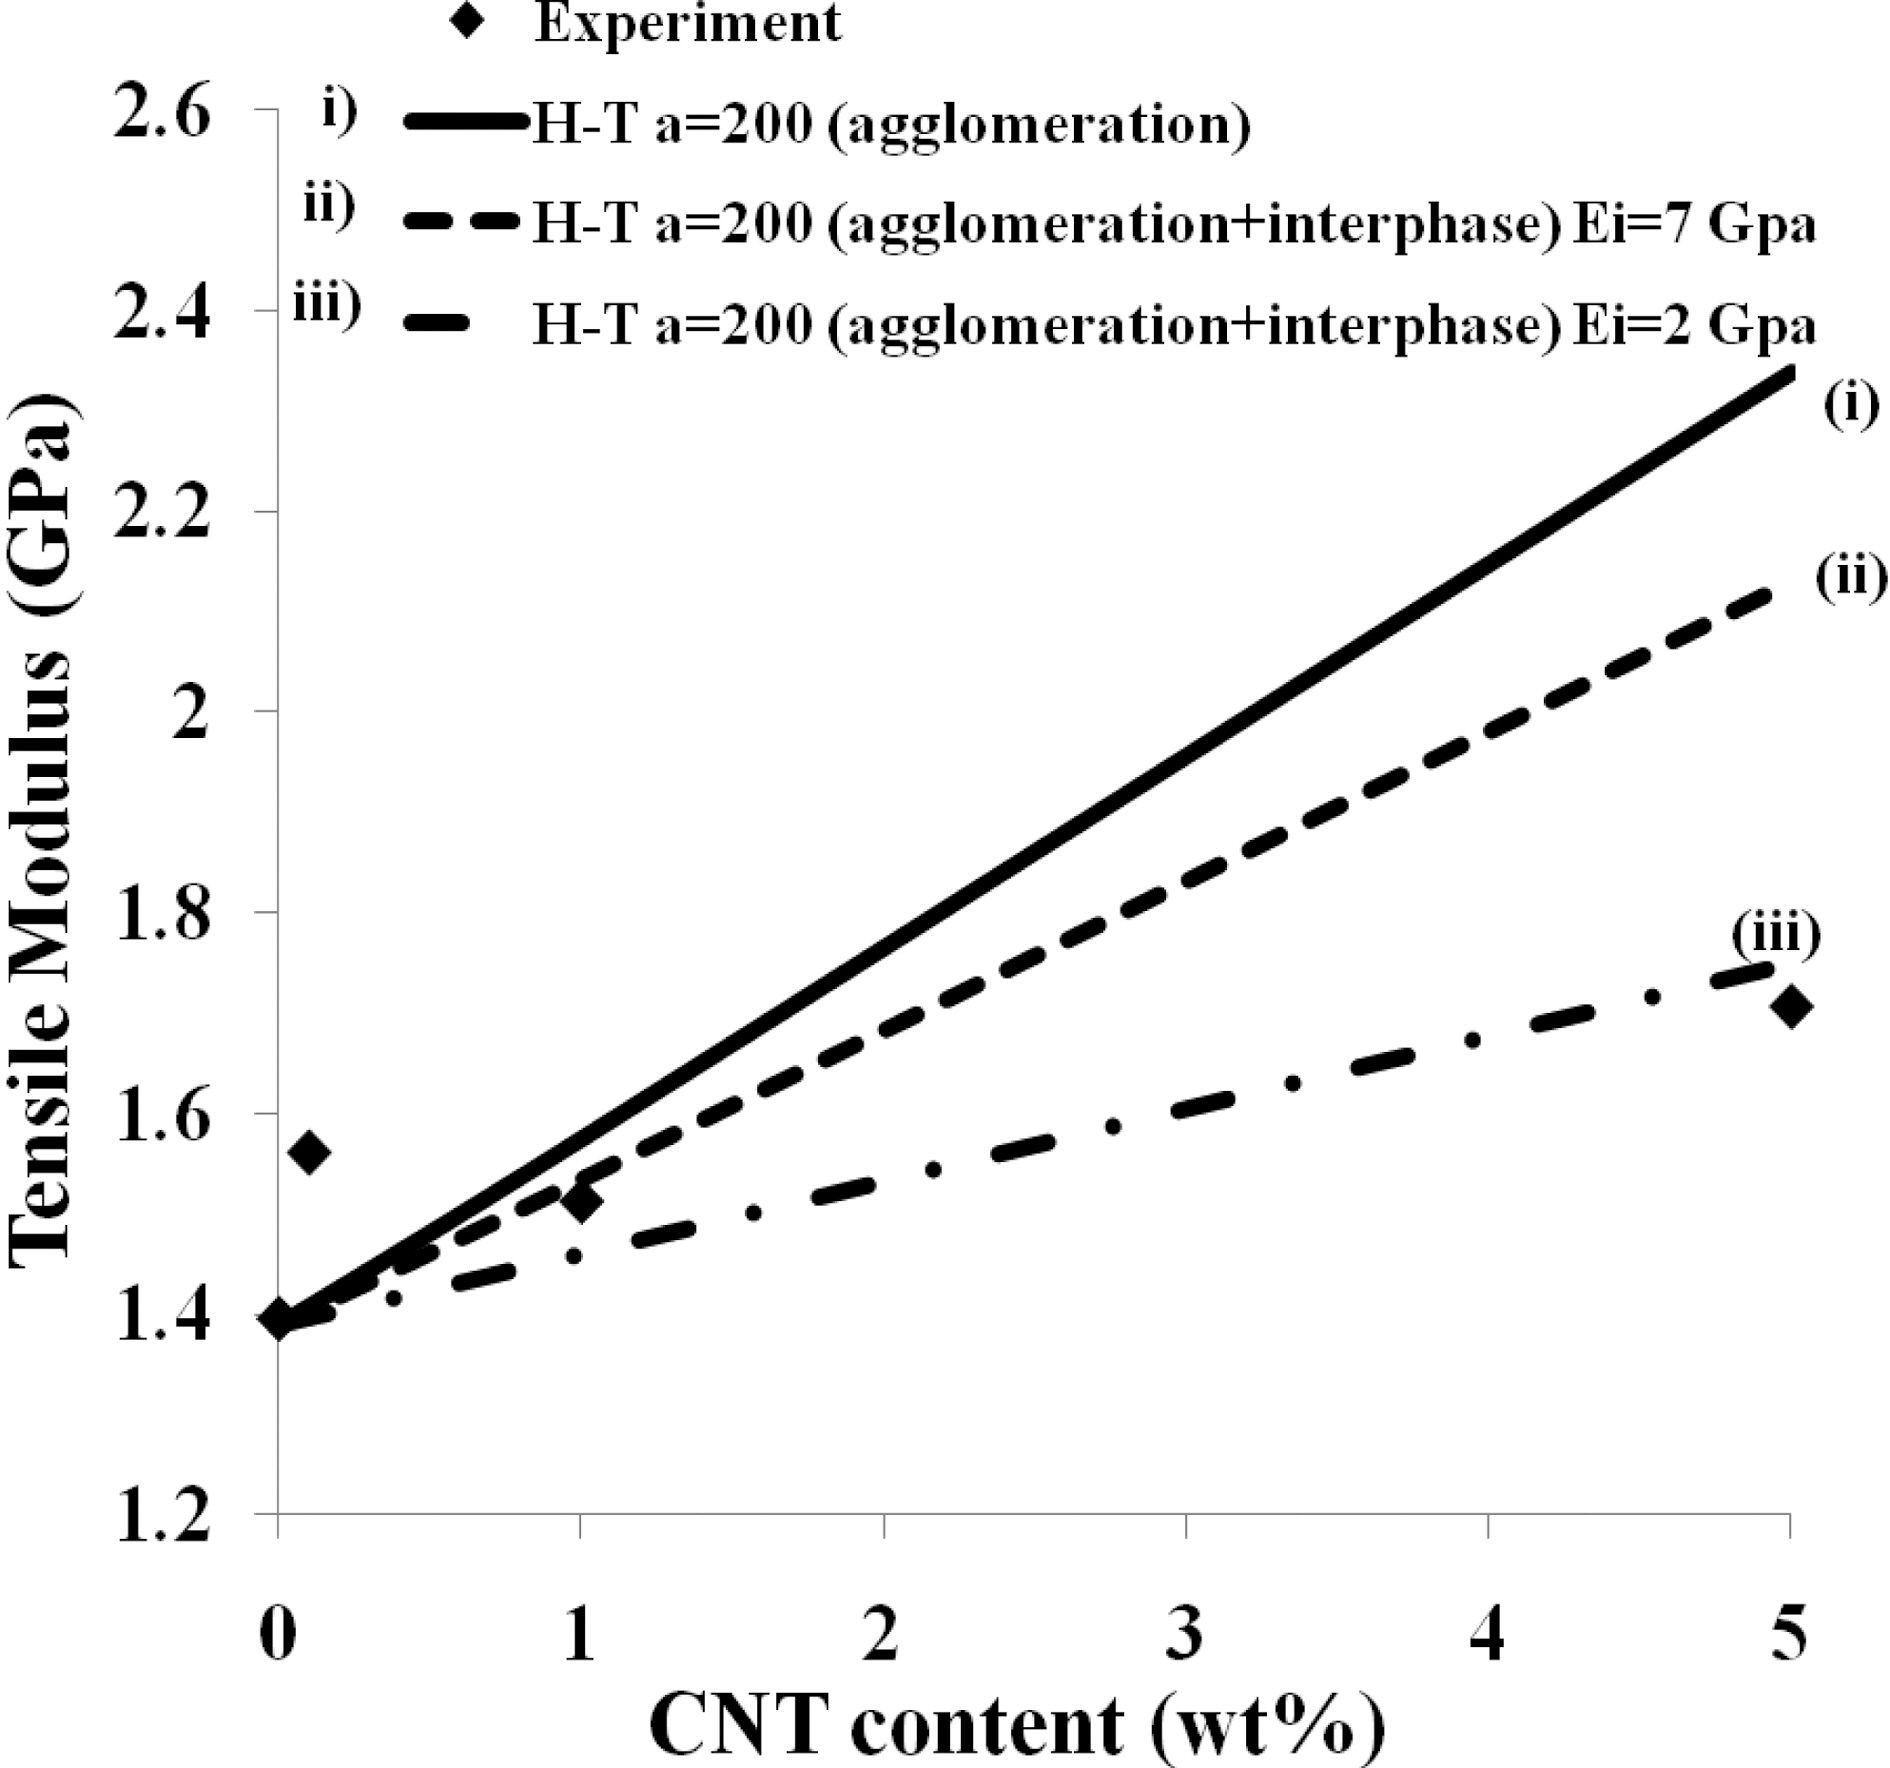
The Halpin-Tsai model is also used to back-calculate the modulus of the interphase assuming an aspect ratio of 200,
as determined by AFM, which indicates presence of agglomerates. As shown in Fig. 6 the interphase modulus should be 2 GPa for good agreement between the model predictions and the experimentally determined modulus.
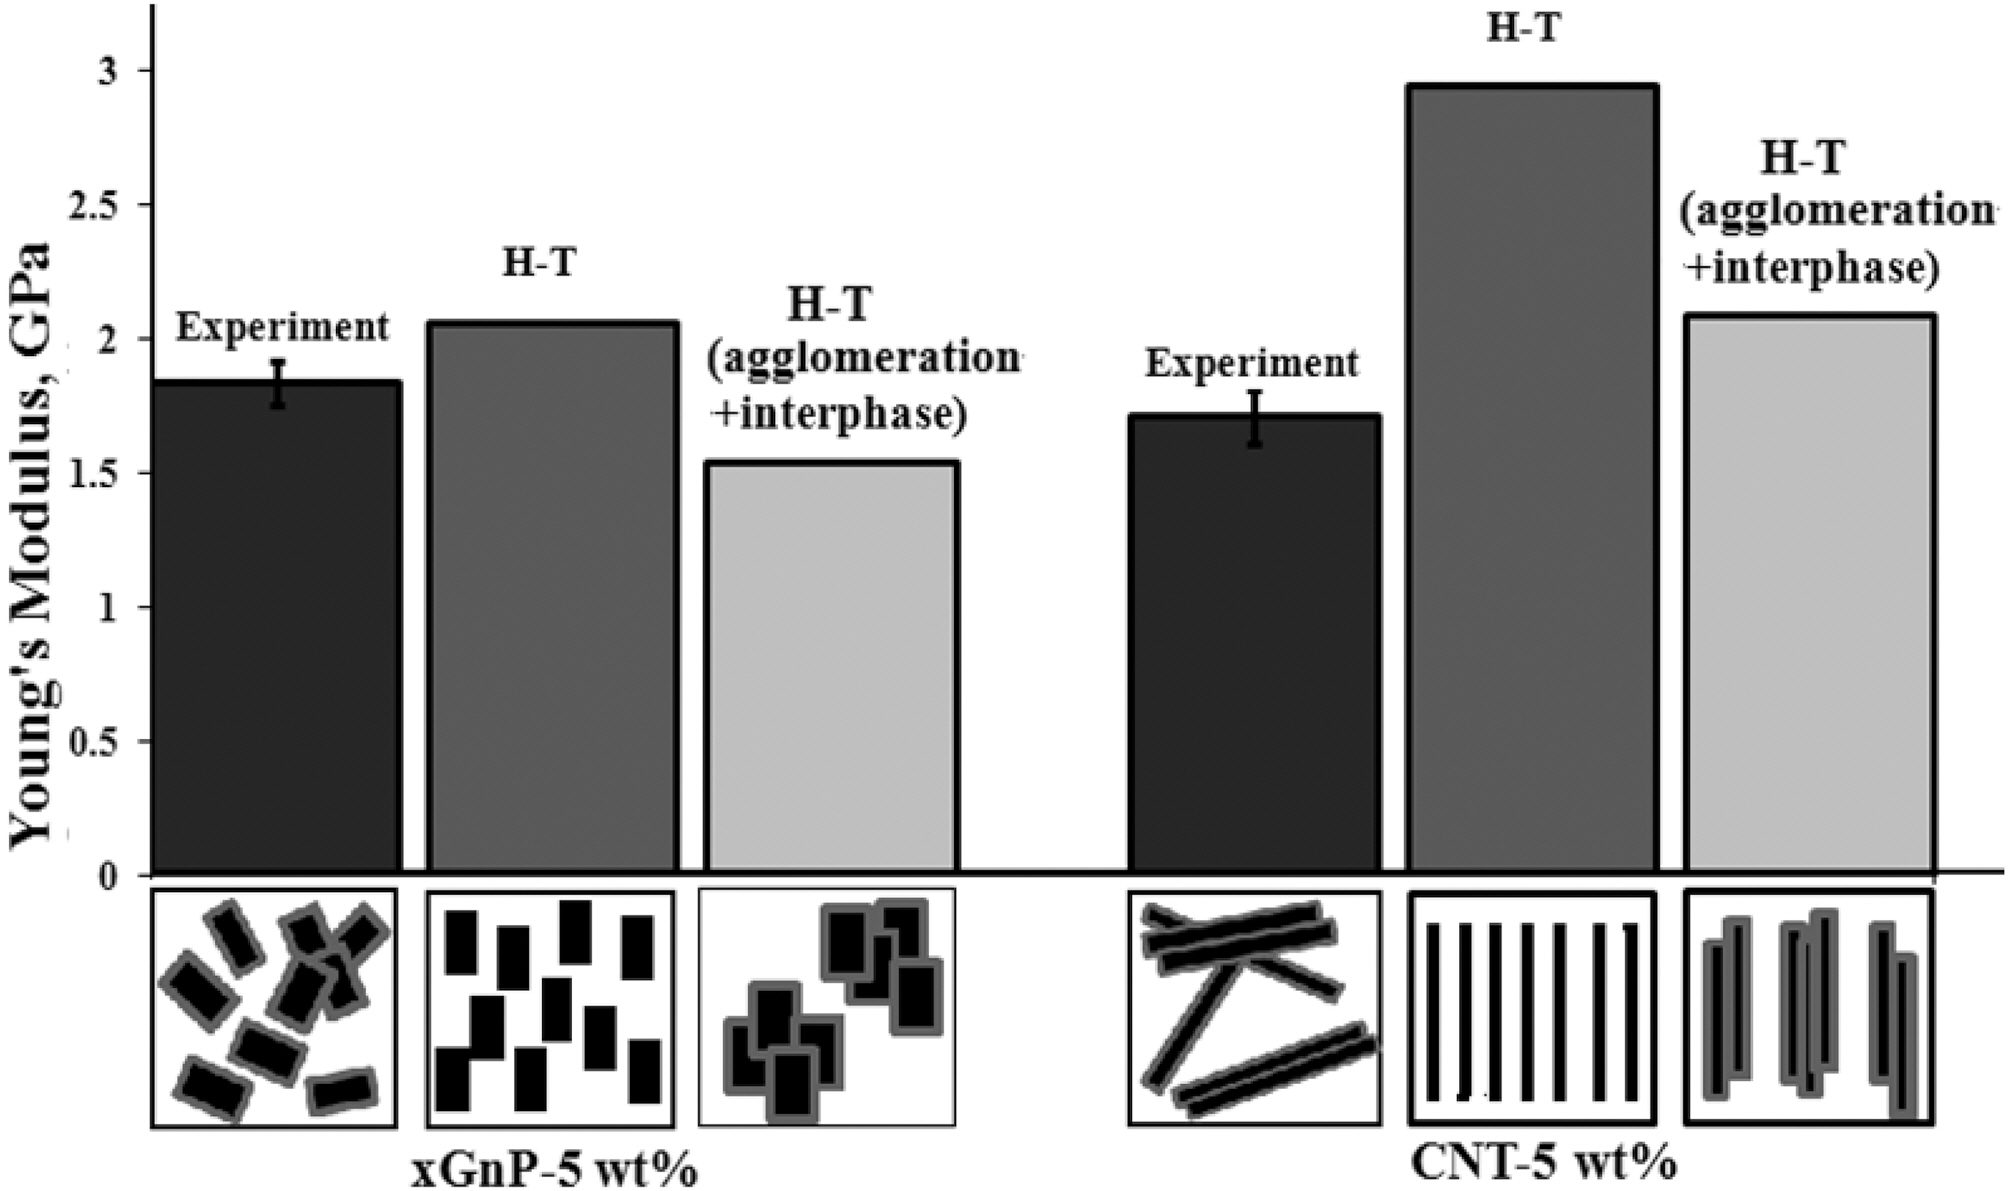
A comprehensive comparison between the experimental results and the model predictions for xGnP/PP and CNT/PP composites at a filler loading of 5 wt% is presented in Fig. 7. The Halpin-Tsai model does not account for agglomeration or presence of interphase which have been confirmed experimentally and in addition it assumes unidirectional alignment of the filler along the direction of the applied tensile load. This is why the model over-predicts the effective modulus of both the xGnP/PP and CNT/PP composites. Accounting for interphase, which is stiffer than the neat PP matrix, increases the effective modulus of the composites. However, the presence of agglomerates has the opposite effect of reducing the composite modulus. Thus depending of which of the two factors i.e., interphase or agglomeration dominates the modified Halpin-Tsai model that accounts for both of them can either under-predict or over-predict as is shown in Fig. 7 for the case of xGnP/PP and CNT/PP composites respectively.
The effect of filler content (wt%), presence of interphase and agglomerates on the effective Young’s modulus of PP based nanocomposites reinforced with xGnP and CNTs was investigated. The interphase width and modulus and the agglomerate size were determined based on AFM. An average interphase width of ~30 nm was estimated for both material systems studied. The interphase modulus considering presence of voids was found to be 5 and 12 GPa assuming filler agglomerates and dispersion at single filler level respectively. Despite the presence of voids the interphase modulus was found to be higher than that of the neat PP. However, the interphase showed to be still stiffer than the polymer matrix in this study. The Halpin-Tsai model was modified to account for these experimentally determined quantities and the model predictions of the effective composite modulus were compared to experimental data. The comparison indicated that the presence of interphase and filler agglomeration have competing effects on the composite modulus. The presented results highlight the need for considering various experimentally observed filler characteristics such as agglomerate size and aspect ratio and presence and characteristics of the interphase in the micromechanical models in order to develop better design tools to fabricate multifunctional polymer nanocomposites with engineered properties.