Among the different pollutants of the aquatic ecosystem,dyes are a large and important group of synthetic organic compounds (SOC). They are widely used in diverse industries such as textiles, paper, rubbers, plastics, foodstuffs,cosmetics, etc., to color their products. These dyes are invariably left in the industrial wastes and consequently discharged mostly in surface water resources. Dyes even in low concentrations are visually detected and meanwhile affect the aquatic life and food web. These colored compounds are not only asthetically displeasing but also inhibiting sunlight into the water streams and thus reduces the photosynthetic reactions [1]. It has been estimated that about 450,000 of dyestuffs produced in the world are discharged in textile wastewater 3.0.CO;2-N'>[2]. The presence of organic dyes in water is harmful to human beings and aquatic life,thereof, the removal of color from wastewater becomes environmentally important. Amongst the conventional and physico-chemical methods used for the removal of dyes,activated carbon adsorption proved to be one of the most efficient and economic processes to remove them from wastewater [1,3-9]. Moreover, the adsorption of dyes onto active carbon depend surface charge on the carbon in the presence water. Activated carbons demonstrate a high capacity for both acid and basic dyes. The effects of various experimental parameters of dye adsorption are initial pH,dye concentration, sorbent dosage, ion strength, and residence time. The inexpensive and readily available adsorbent provides an attractive alternative material for adsorption process.Despite its prolific use in water and wastewater industries,commercial activated carbon (CAC) still remains an expensive material. This has led to a research for low-cost materials as alternative adsorbent materials [9].
Another major problem facing rural villages in industrial developing countries are biomass, sewage and municipal solid waste. In Egypt the estimated amount of agricultural wastes ranges from 22~26 million dry tonnes/year. Five crops represent the highest amount of biomass wastes, these are: rice, corn, wheat/barely, cotton and sugar cane. The accumulation of these wastes causes many health problems and damage to the environment, e.g. the black clouds result from burning of biomass wastes in the field. One of the main wastes in Egypt is cotton stalks where its estimated amount of production is 1.6 ~3 million tonnes annually [10].
A potentially profitable alternative method for cotton stalks reuse is the production of highly efficient adsorbents known as activated carbons [11-13]. It is well-known that carbon adsorbents have attracted special attention since many decades ago,because of their well-developed porous structure, large surface area and good mechanical properties [14,15]. Thus,activated carbon adsorbents introduce many applications on both the technical and laboratory scales. For example, they are used for; purification of sugar syrups, oil decolorization and for the improvement of taste and other properties of alcoholic beverages, as well as the purification of wastewaters and in chemical industries [14,15]. In general, activated carbon can be prepared from a large number of natural?rich in carbon materials, namely carbonaceous materials. The most commonly used raw materials in commercial practice are peat,lignite, wood and agricultural by-products (biomass). It has been found that activated carbons obtained from agricultural by-products can be favorably compared with other activated carbons used in industry with respect to their adsorptive properties [11]. Therefore, production of activated carbons from biomass serves dual purposes by converting unwanted surplus agricultural by-products to value-added and an efficient adsorbent for wastewater treatment and reduction of environmental and health hazards associated with the open burning of biomass wastes [3,13]. Examples of investigations utilizing agricultural biomass sources for activated carbon preparation in the recent two decades include: almond shells and peach stones [16]; olive-seed waste [17,18]; apricot stones [19]; sugarcane bagasse [20]; date pits [21]; nutshells and fruit stones [22]; and corn cobs or maize stalks [23-25].
Two schemes are employed for the production of activated carbons, the first being physical (i.e. thermal) activation of the preliminary-obtained char by an oxidizing gas (such as carbon dioxide, steam, air or mixture of gases). The second method,chemical activation, involves impregnation of carbonaceous precursor with a chemical agent that suppresses volatile components. Such chemical agents are ZnCl2, H3PO4, KOH,NaOH, etc, that promote the formation of cross-links,resulting in the generation of rigid matrix that hinders surface contraction upon pyrolysis process [23-27]. The advantages of chemical activation include low activation temperature, reduced activation time, high surface area, high yield and an important reduction of the mineral content [28].The porous texture of the activated carbons depends on both the activation process and the nature of the precursor. The impact factors affect on the final textural properties of activated carbons prepared by chemical activation are as follows: activating agent, activating agent/C ratio, heating rate, activation temperature and soak time [29]. Accordingly,one of the effective variables on the porosity of the final carbon in chemical activation process is the activation temperature. However, it has been reported recently that activated carbons with high surface area can be developed by KOH activation of pre-carbonized cellulosic biomasses which are mostly of lower hardness (softer) and density than wood or fruit stone precursor such as corn cobs, rice straw,rice husk and cotton stalks [24,30]. This preparation method may be a mixed process of physical and chemical routes,and denoted as a two stage process.
Previous studies demonstrated the promise of producing an effective adsorbent either by H3PO4 activation of cotton stalks [12,13] or KOH activation in one-stage [12]. However,very few researches have been reported to investigate the feasibility for production of activated carbons by semicarbonization followed by chemical activation of cotton stalks.Therefore, the objectives of this study were to investigate: (i)the feasibility of production of activated carbon by KOH activation of semi-carbonized cotton stalks (CCS) under different activation temperatures and chemical ratios of KOH/CCS as 1:1 (at 700, 750 and 800oC) and 4:1 at 800oC;(ii) the kinetics and mechanism of adsorption of methylene blue (MB) as probe molecules for technical and laboratory purposes [31] to find out the possibility of using these carbonaceous materials as low-cost adsorbents as well as iodine number detection. For this purpose, three simplified kinetic models (pseudo-first-order, pseudo-second-order and intraparticle diffusion) as well as two commonly isotherms in batch equilibrium (Langmuir and Freundlich isotherms)were performed to elucidate the adsorption mechanism.
A novel route of carbonization, a semi-carbonization was applied for producing a semi-carbonized cotton stalks [32].Crushed cotton stalks were dried at 100oC overnight after washing with boiling water. Then, the dried cotton stalks were semi-carbonized at 200oC for 30 min, then followed by raising the temperature up to 400oC and kept for another 30 min under its own atmosphere.
After the semi-carbonization step, the cooled-semi-carbonized cotton stalks (CCS) was mixed with KOH pellets, dissolved in small amount of water in a Pyrex dish with the prescribed KOH/CCS ratio. The mixture was stirred vigorously for 1 h and placed in a stainless steel reactor. The activation temperature program was carried out by raising the temperature with heating rate at 10oC/min until the desired activation temperature and kept for 30 min in a self-generated atmosphere.The activated mass was cooled to room temperature and washed sequentially with 1 N HCl solution, followed by washing with boiling water, until pH 6?7. The notation of the obtained samples and preparation conditions, in addition to carbon yield and ash content, are listed in Table 1.
2.2. Determination of physico-chemical properties
The textural parameters, such as the BET-surface area(SBET), total pore volume (Vp) and average pore diameter(Rp) were evaluated from BET-equation, using Quantachrome
[Table 1.] Preparation Conditions of the Derived Samples from Semi-carbonized Cotton Stalks
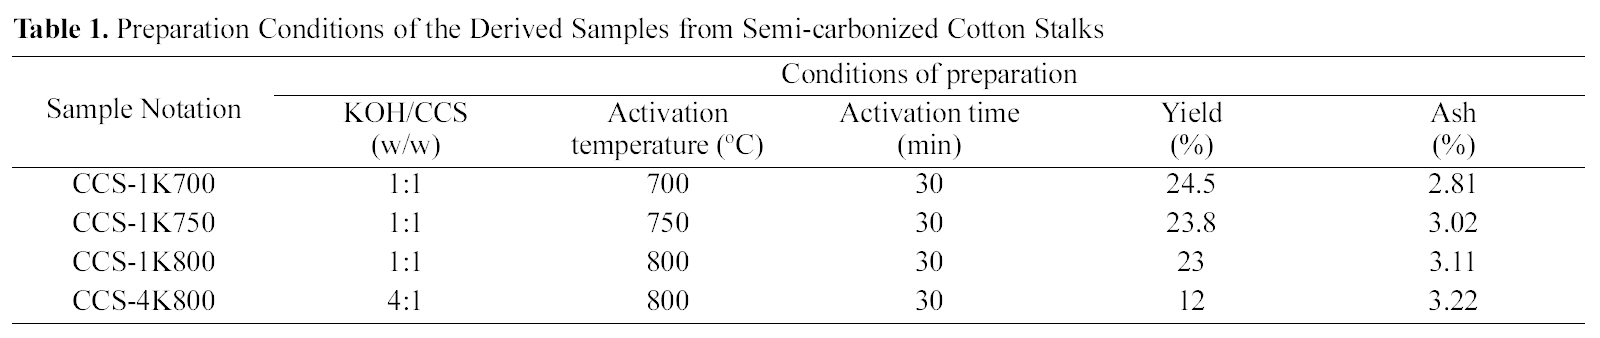
Preparation Conditions of the Derived Samples from Semi-carbonized Cotton Stalks
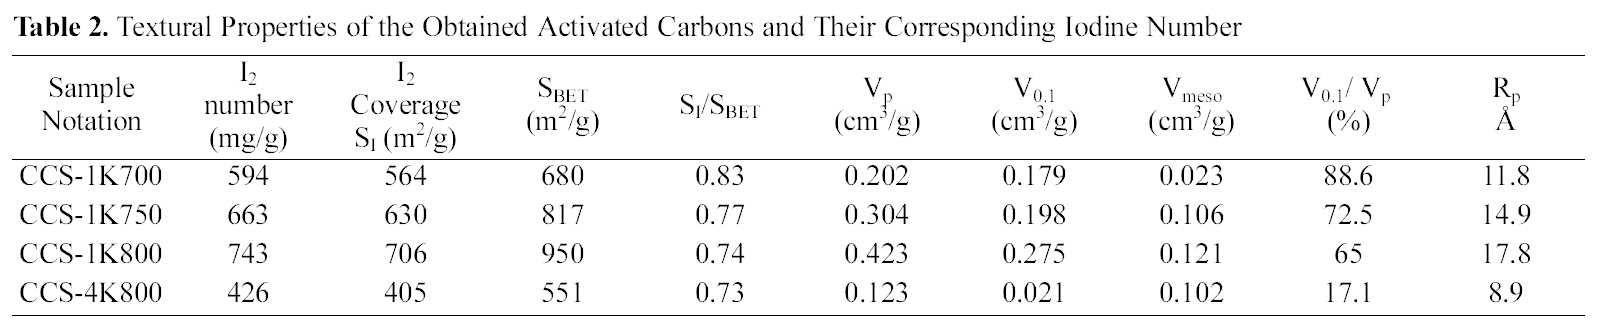
Textural Properties of the Obtained Activated Carbons and Their Corresponding Iodine Number
[Table 3.] FTIR Absorption Bands for CS CS-1K800 and CS-4K800 Samples
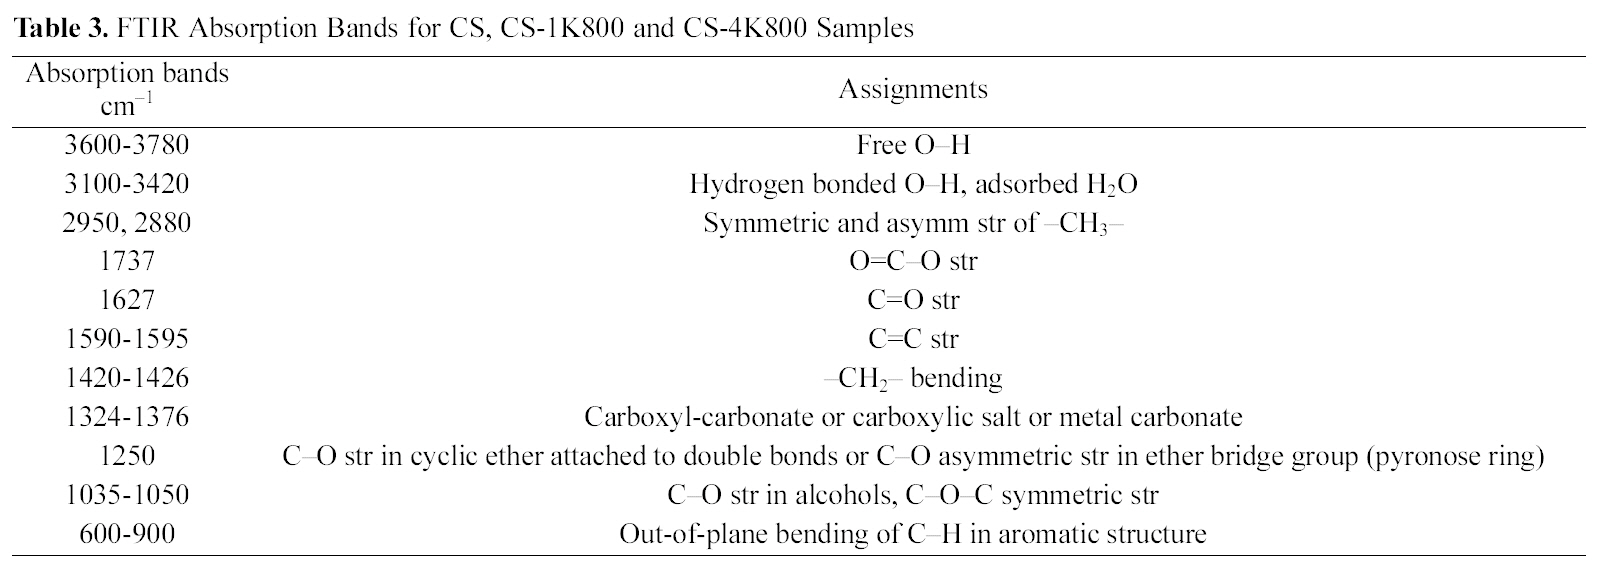
FTIR Absorption Bands for CS CS-1K800 and CS-4K800 Samples
Nova Automated N2 gas adsorption at 77 K. In addition, an estimate for micropore volume (V0.1) was taken as volume of liquid nitrogen held at P/Po=0.1 [33] in order to calculate mesopore volume from Vmeso=Vp?V0.1 (Table 2).
A scanning electron microscope, SEM-JEOL (JXA-840A Electron Probe Micro-Analyzer, Japan), was used to study the structural features of the cotton stalk raw material and activated sample (CCS-1K800). Before scanning, the selected samples were coated with gold (Au) using a quick autocoater(JFC-1500, JEOL). The surface functional groups were qualitatively determined by FTIR spectra of cotton stalks raw as well as for two selected carbons CCS-1K800 and CCS-4K800, recorded within the wavenumber range 4000 to 400 cm1. Analysis was achieved by a spectrophotometer Type FTIR?6100 (JASCO), employing the KBr pellets technique,was performed on those samples. Pressed KBr pellets at a sample /KBr ratio of 0.2% (w/w) were scanned after drying overnight at 100oC. Functional group assignments by FTIR spectra on the selected carbon products are cited at Table 3.
Iodine and methylene blue are considered as probe molecules for assessing the adsorption capacity of adsorbents for solutes of molecular sizes > 10 and > 15 A, respectively.Adsorption capacities of iodine and methylene blue are normally listed as specification parameters for commercial activated carbons.
2.3.1. Iodine number estimation
Iodine adsorption capacity (iodine number, mg/g) was determined by the titration of the residual solution of 10 ml I2 with 0.1 N sodium thiosulphate in the presence of 1 ml of 1 wt% starch solution as indicator. The iodine number was evaluated from the adsorbed iodine unit mass of the carbon adsorbent at the residual iodine concentration of 0.02 N [30].
2.3.2. Batch equilibrium experiments
For these experiments, a stock solution of methylene blue (MB), was prepared by dissolving 0.5 g in 1 L of distilled water in measuring flask of 1000 ml capacity. 50 mg of the powdered pre-dried carbon was mixed with 50 ml MB of increased concentrations (50~300 mg/l) in 250 ml stopperedreagent bottles. The container bottles were agitated occasionally in a shaker for 72 h at ambient temperature to attain equilibrium. The residual dye concentration was determined using a UV-Vis spectrophotometer (Shimadzu Model PC-2401) with 1.0 cm length-path cell. Absorbance measurements,of the properly diluted filtrates, were made at the maximum wavelengths of at 664 nm. The amount of dye uptaken by the carbon samples was calculated by applying the massbalance equation;
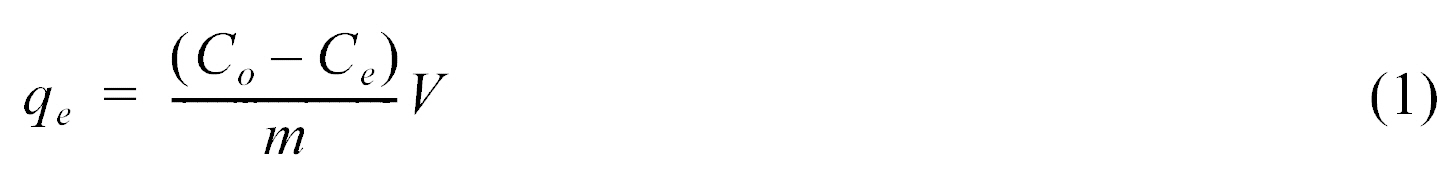
where
3.1. Effect of activation temperature on the carbon yield and ash content of prepared carbons
The results of the activation yields and ash contents are given in Table 1. As expected, the carbon yields in the present case are extremely high and vary between 12 ~24.5%. The carbon yield generally decreases with raised temperature. A decrease in weight, and consequently in carbon yield, would be ascribed to enhanced gasification with raised temperature. On the other hand, the ash content appears to increase continuously with temperature from 700 to 800oC (from 2.81 up to 3.22%).Thus, raising activation temperature is reflected on the ash content as a result of two factors : (a) relative increase in carbon gasification and (b)deposition of higher amounts of dehydrated / reacted potassium oxide or carbonate. Low ash contents in the produced carbons may be due to the effect of vigorous washing by 1 N HCl solution.
3.2. Textural properties of the investigated carbons
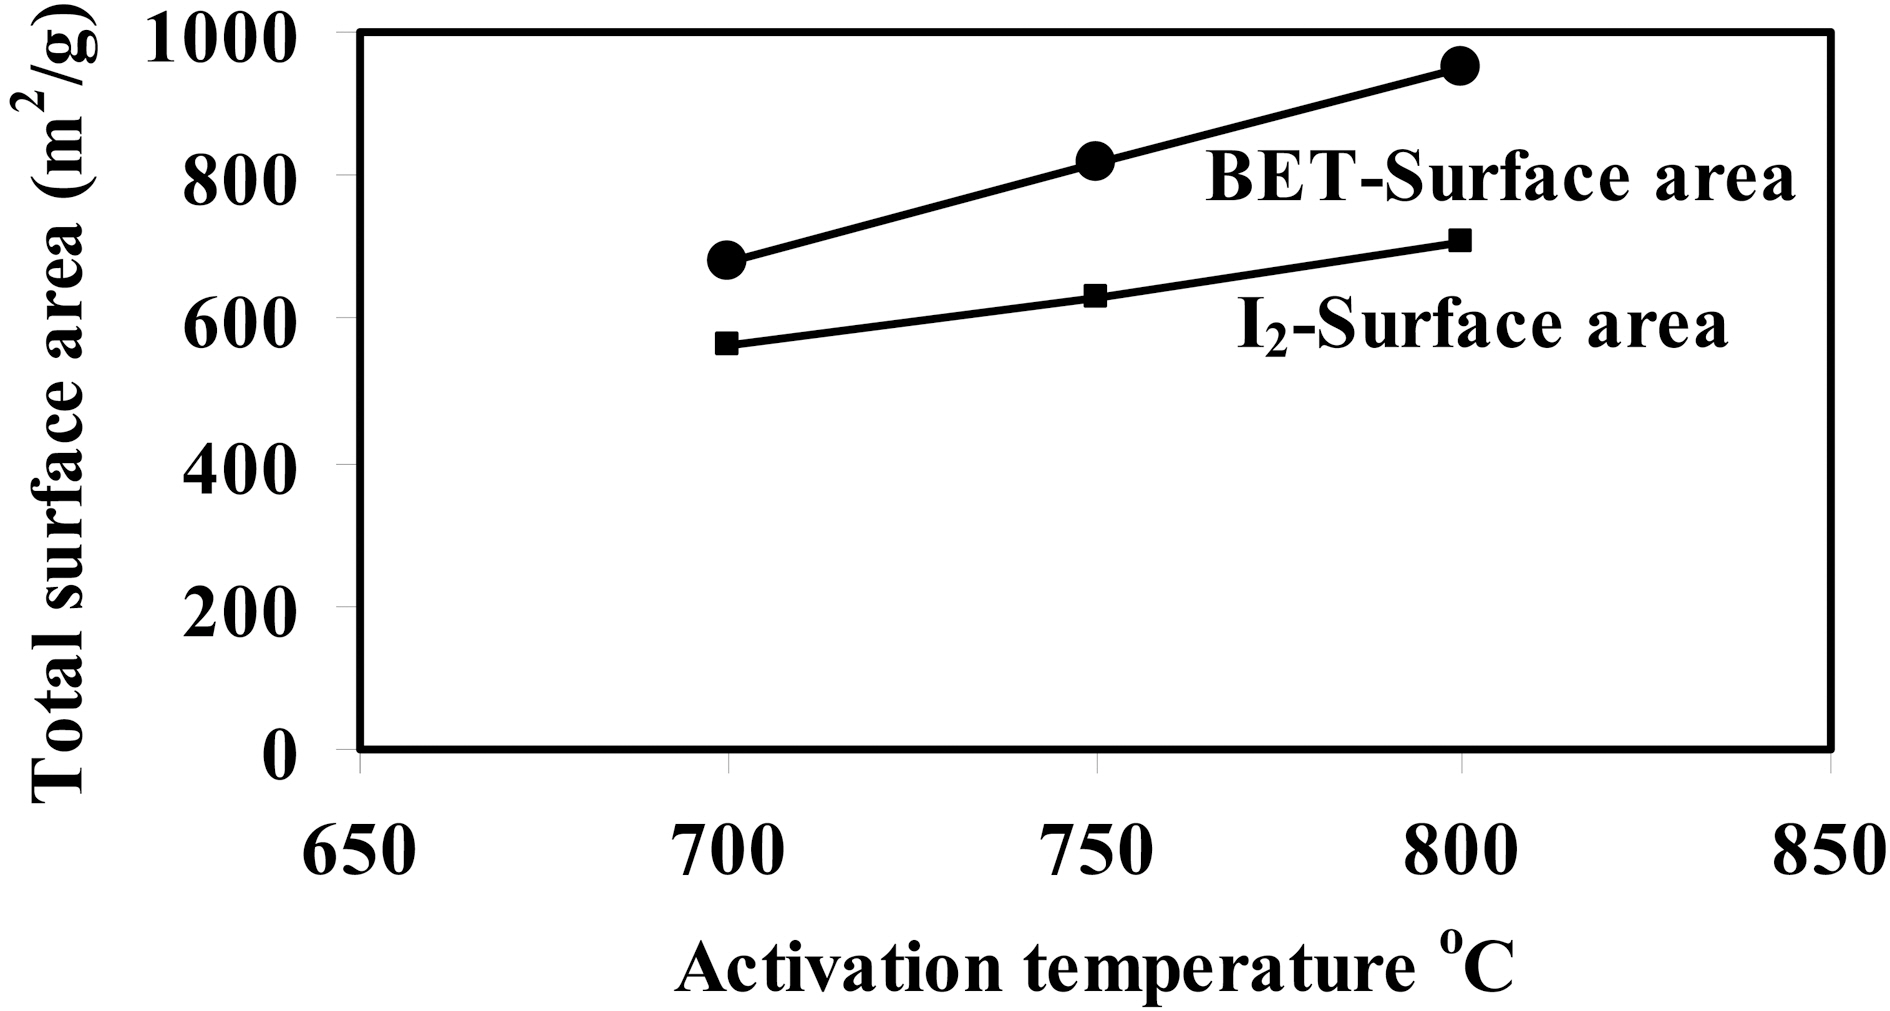
Fig. 1 shows a relationship between activation temperature(700 ~ 800oC), with a ratio of 1:1, and BET-surface area and iodine coverage in m2/g (cf. Table 2). It can be observed that a big difference between surface area evaluated from nitrogen adsorption and iodine capacity, where SBET > SI which owing to pore diameter size of I2 > N2. This finding confirms that iodine, as established before, measures the
surface area within pores at and beyond 10 A in diameter.From Table 2, it can be seen that ratio of SI /SBET decrease from 0.83 to 0.74 with developed porosity presented as SBET or V0.1 (Fig.1 ).
It is well established that the activation temperature is one of the important parameters in the preparation of activated carbons using the chemical activation process [26]. In the present investigation, ratio of KOH to carbonized cotton stalks (CCS) was fixed at 1:1 in order to study the effect of activation temperature at 700, 750 and 800oC. Table 2 summarizes the textural parameters that were determined using N2 adsorption isotherms at 77 K (not shown here)according to the BET equation. It can be seen clearly that a considerable increase in the internal porosity of the developed carbons appears as the activation temperature increases from 700 to 800oC; SBET increases from 680 to 950 m2/g (~40%); Vp from 0.202 up to 0.423 cm3/g(~109%). This finding implies that the obtained semicarbonized cotton stalks- KOH activated possess a welldeveloped porosity, and could be prepared from KOH activation under the prescribed conditions. A significant increase in the average pore diameter was observed with increasing in activation temperature as follows: 11.8, 14.9 and 17.8 A for CCS-1K700, CCS-1K750 and CCS-1K800,respectively. This observation could be attributed to the formation of wide micropores (i.e., super-micropores>7.2 Aaccording to IUPAC classification) as activation temperature increases. Also, it can be observed that microporosity decreased as activation temperature increased from 88.6 to 65%, accompanied by increasing in mesoporosity from 11.4 to 35%. This trend confirms that the micropores are widening to generate mesopores or macropores inside the carbon matrix. Therefore, it is clearly noted that there is widening of porosity with increasing the activation temperature as shown in the following order: CCS-1K800 > CCS-1K750 >CCS-1K700, respectively.
As the chemical ratio becomes 4:1 at an activation temperature at 800oC, i.e. CCS-4K800, it is observed that a
considerable reduction appears in all textural parameters as listed in Table 2. This observation is not consistent with the previous studies on the activation of KOH with cotton stalks in one-stage, chemical ratios were 1:1, 2:1 and 3:1 at 700oC [12];or other precursors, as e.g. spanish anthracite or corn cobs [34,35], where an increase in KOH/precursor (up to 4)resulted in enhanced porosity. Amongst the above literature, it was reported that KOH ? a higher chemical ratio?works through two competing mechanisms of pore evolution in the carbon structure; (i) the formation of micropores which starts with the addition of KOH to the carbonaceous materials, and(ii) the gasification of surface carbon atoms through oxidation reaction at the carbonization temperature 700oC.Both mechanisms lead to generation of an abundance of micropores [36].
Furthermore, It was established by Lozano-Castello
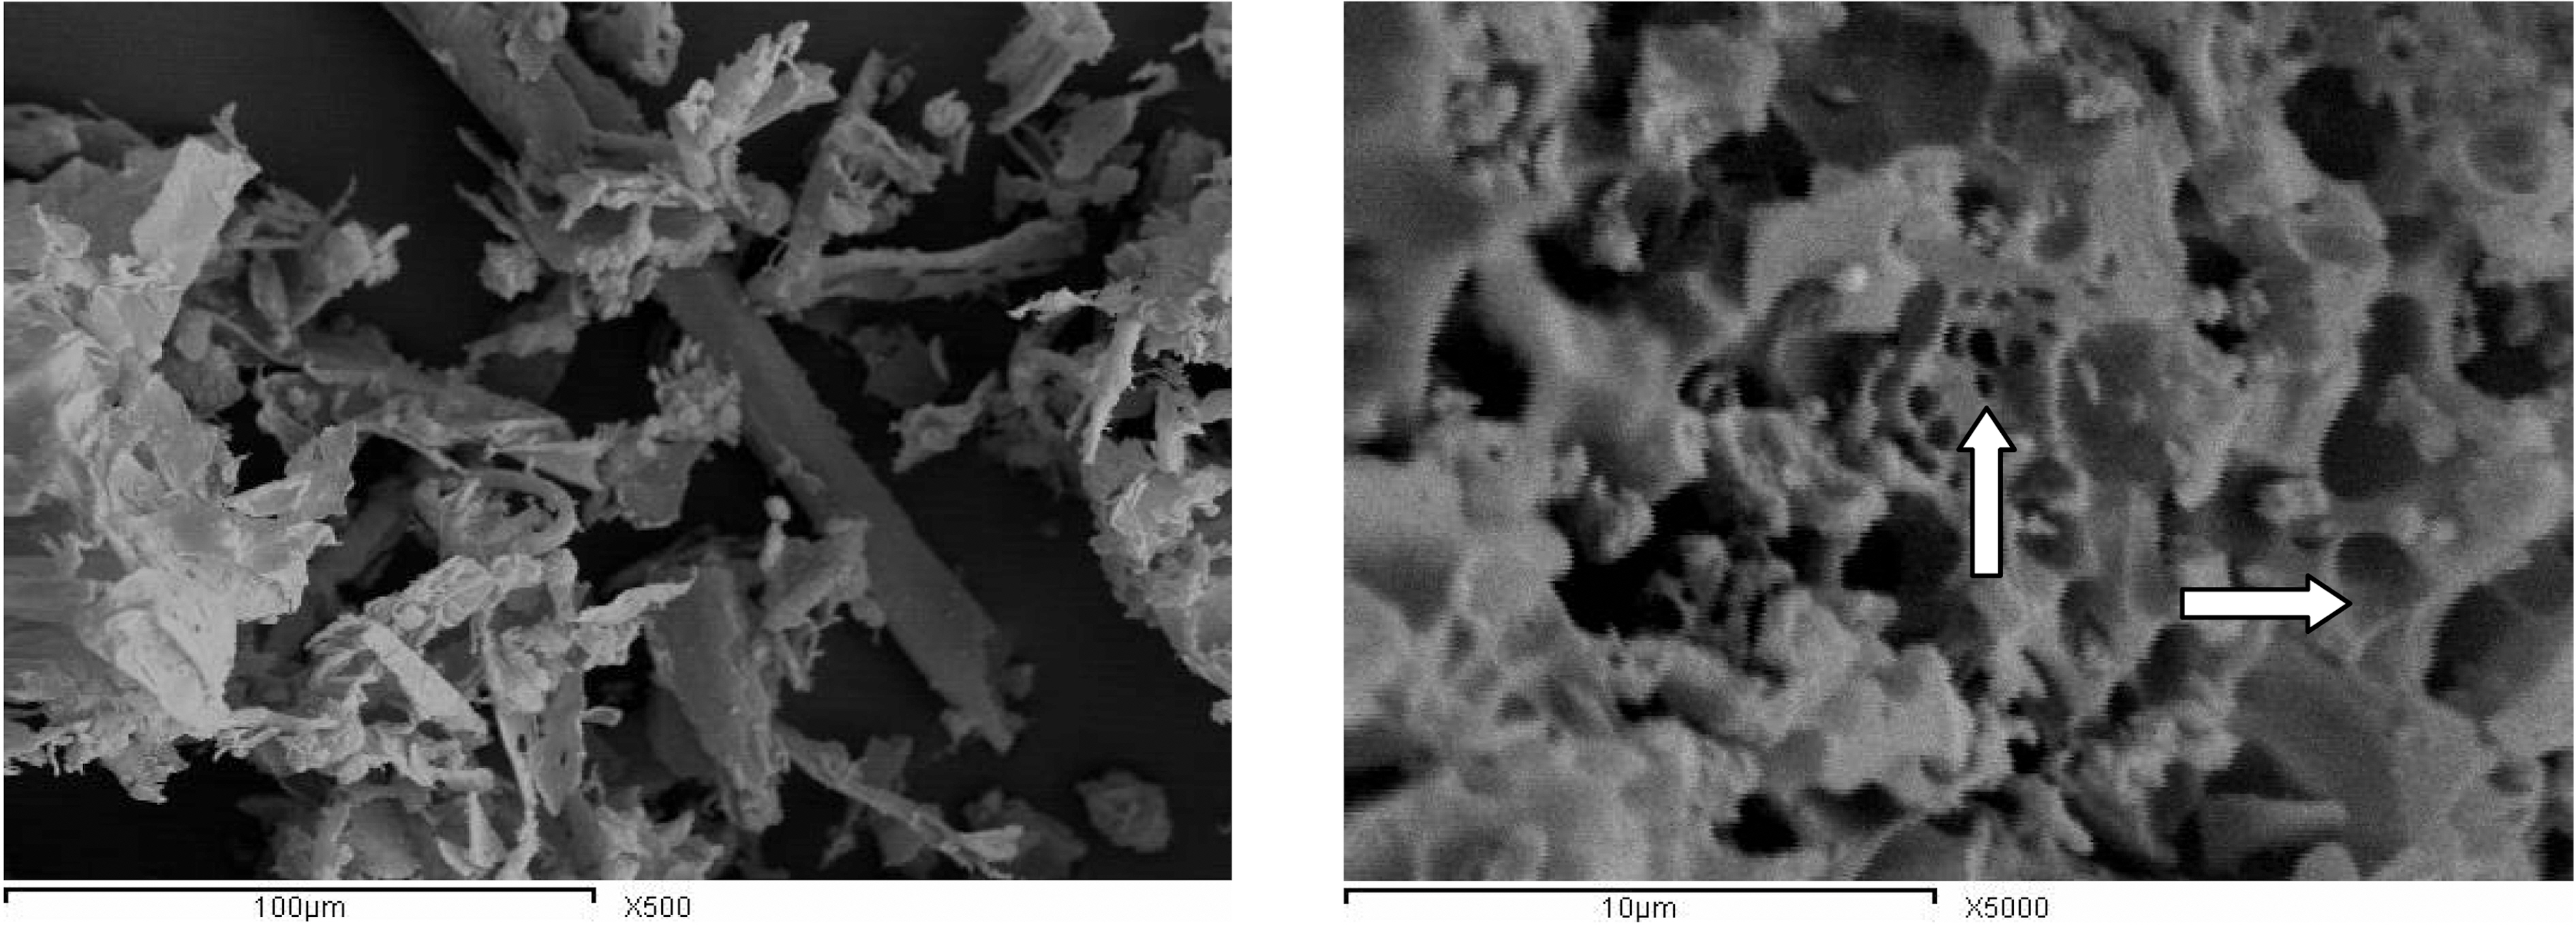
SEM microscopy is widely used to study the morphological features and surface characteristics of the carbonaceous adsorbents [37]. Fig. 2 depicts the SEM micrographs of parent cotton stalks and an activated sample, CCS-1K800 at two magnifications, 500x and 5000x, respectively. SEM micrograph of the original material illustrates its intact fibrous nature, where its activated carbon shows the formation of pores on the outer surface that can be further enhanced by chemical activation, which results in generation of large cavities (cf. arrows on SEM image of CCS-1K800). Thus destruction of the original defined fibers is accompanied by formation of a deformed mass with clear porosity, is indicated.
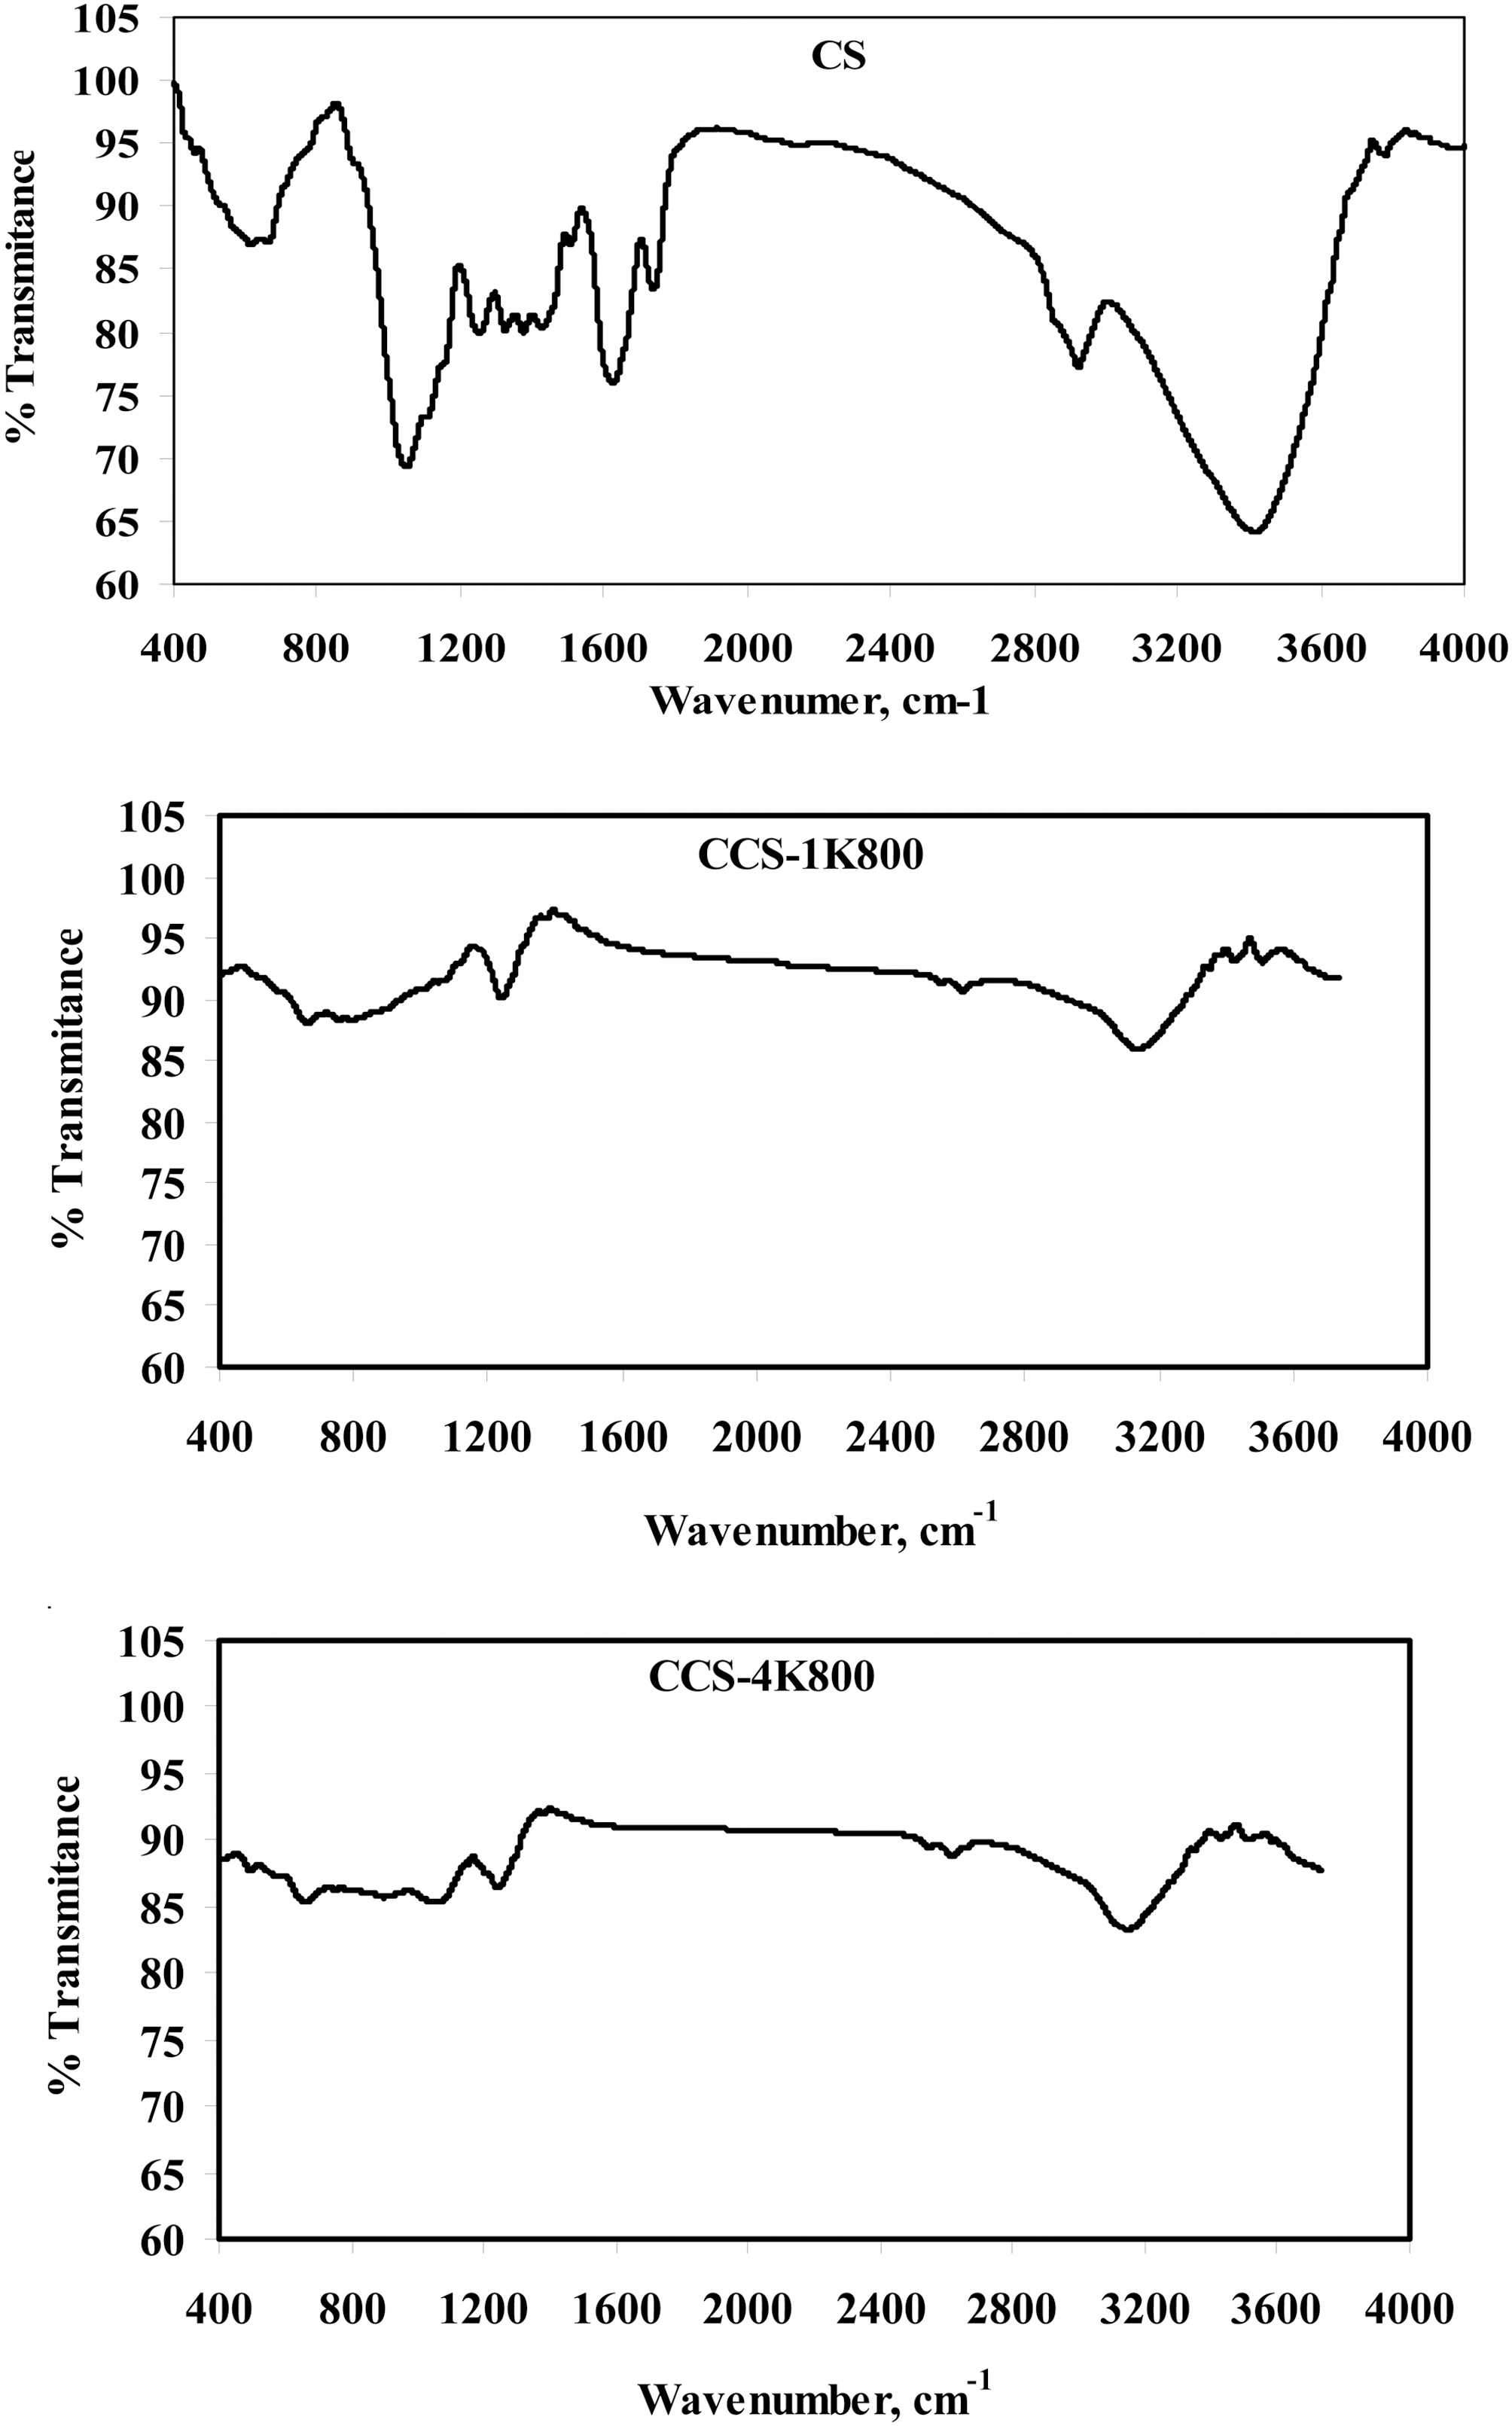
Fig. 3 shows the FTIR spectra for the original cotton stalks in comparison with the two activated carbonized cotton stalks; CCS-1K800 and CCS-4K800, in order to identify the oxygen functional groups on their surfaces and Table 3 illustrates the absorption bands for the studied samples.Absorption in the 3600?3780 cm?1 range, has been assigned to stretching of free O?H groups on the surface [38]. In addition, hydrogen bonded OH groups can be assigned to broad peak in the 3350?3430 cm?1 range and a broad peak around 3300?3400 cm?1 is likely due to adsorbed water. A small intense peak in the range 2800?3000 cm?1 region is due to C?H stretching modes. The band at 2980 and its shoulder at 2880 cm?1 were ascribed to C?H symmetric and asymmetric stretching of residual methylene groups on the surface. It can be seen from the spectrum of cotton stalks in Fig. 3 that the peak intensities at 1737 cm?1 and 1250 cm?1 for ester and phenolic ether groups, respectively, disappeared considerably after KOH treatment. This observation confirms that the lignin which consists of many ester and ether bands in cross-linked structure is damaged by KOH impregnation [27].Also, it is observed on the FTIR spectrum of cotton stalks that the peak at 1625 cm?1 is decreased in intensity and shifted to the lower wavenumber at 1600 cm?1 for CCS-1K800. This peak has been attributed to C=O stretching.
The peaks at 1620?1430 cm?1 region were ascribed to the skeletal C=C stretching in aromatic rings. A band at 1373 cm?1 was ascribed to the formation of carboxyl-carbonate or carboxylic salt or metal carbonate. Bands between 1300 and 900 cm?1 which appear in all spectra have been currently assigned to C?O stretching in acids, alcohols, phenols, ethers and esters [39]. Shoulder peaks appear between 900 and 600 cm?1 were assigned to an out-of-plane C?H bending mode in aromatic rings. Overall, it can be concluded that FTIR analysis revealed the presence of C?O, C?O?C, O=C?O, C?O?H, C=O? and some alkyl groups on the surface of studied samples. Chunlan
groups reacted with KOH and form the intermediate groups like C?O?K; and then (ii) the resulted groups further reacted with the carbon of precursor to produce K2CO3 and K2O species, hence, porous structure is developed. Thus these surface functional groups can serve as “active sites” where chemical transformations occur via surface reactions [29]which enhance the adsorption capacity of these carbons towards hazardous materials.
3.4. Adsorption isotherms for methylene blue (MB)
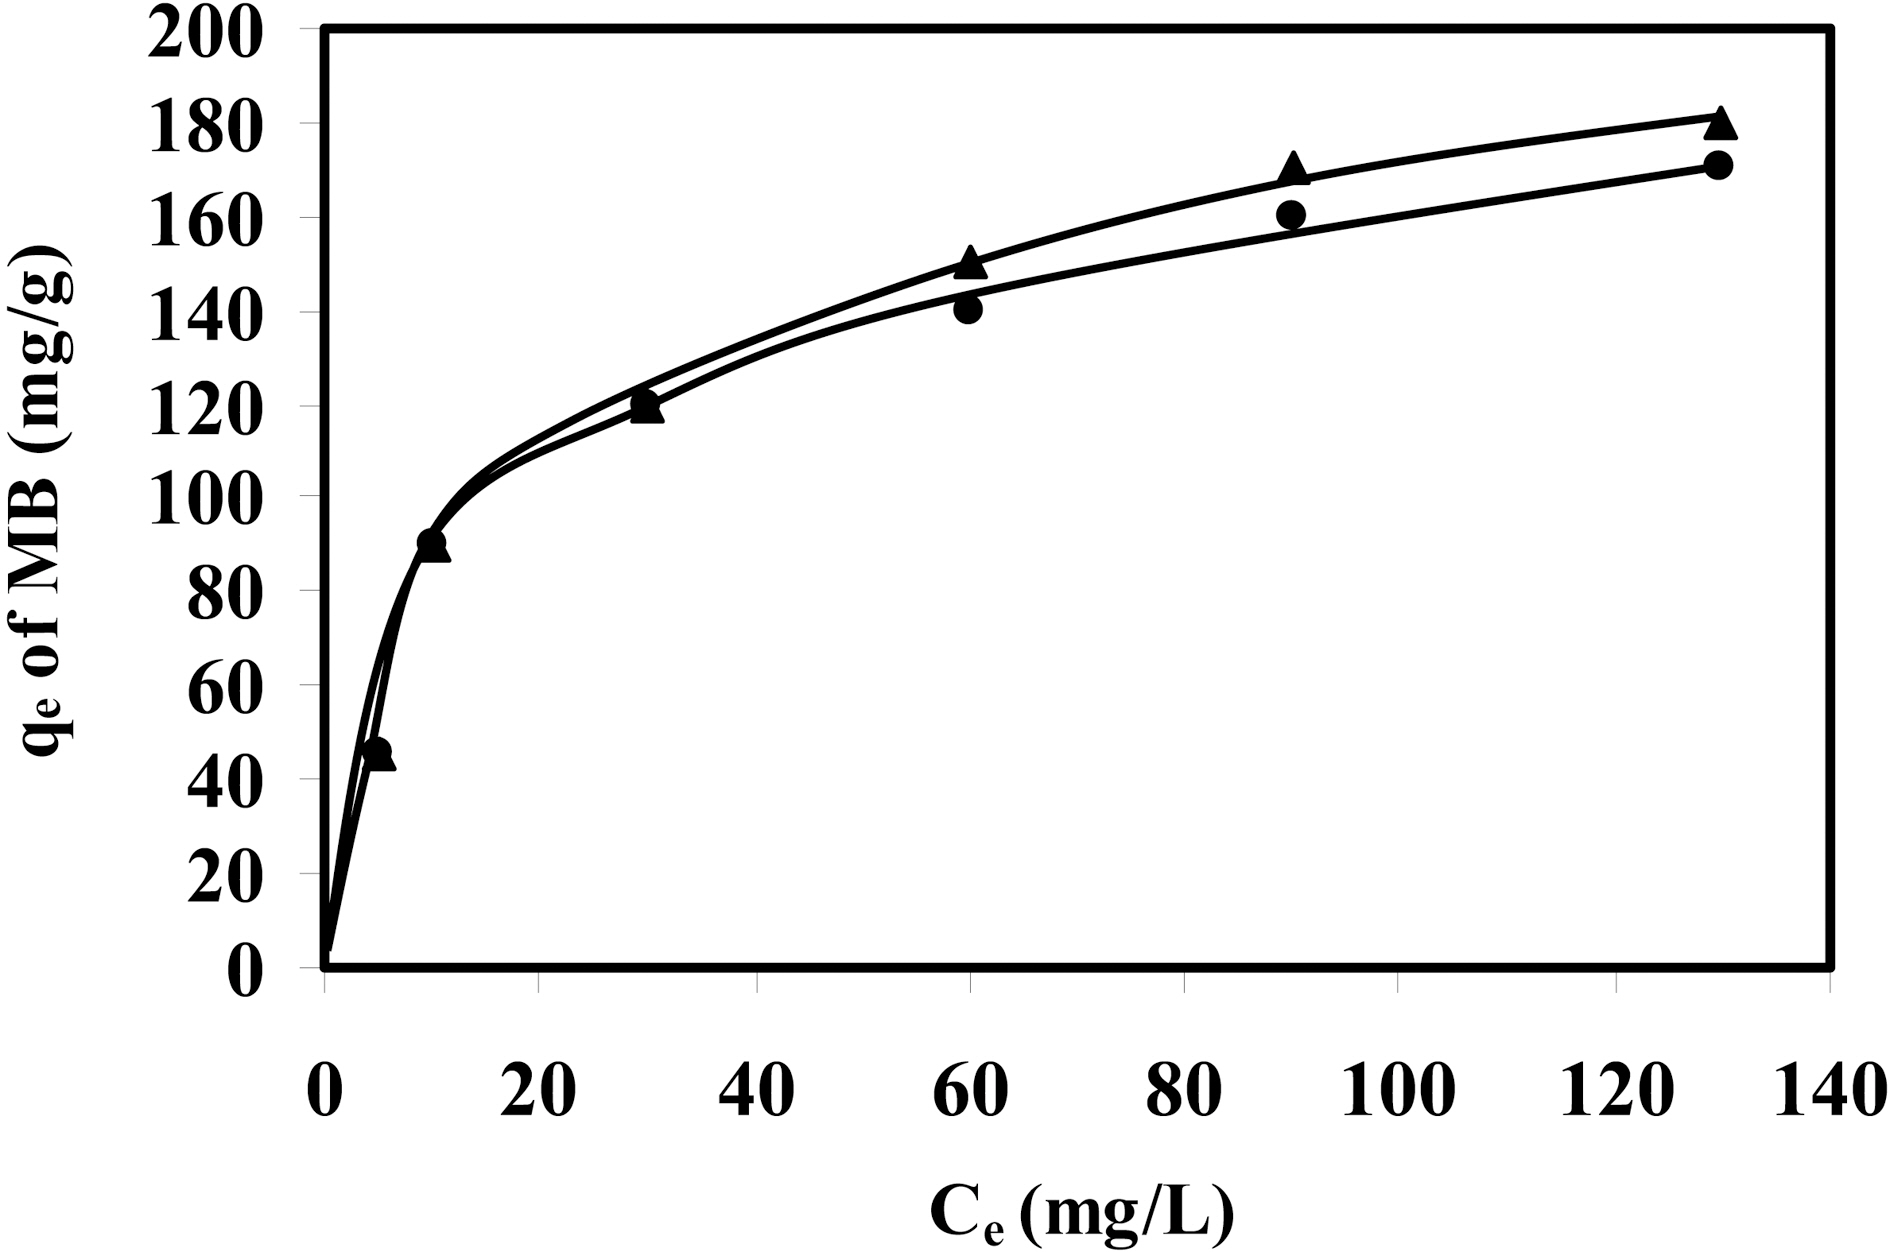
Batch adsorption experiments were carried out on two activated samples CCS-1K750 and CCS-1K800, with welldeveloped porosity, for removal of methylene blue molecules from aqueous solution. The adsorption isotherms of various classes of compounds (
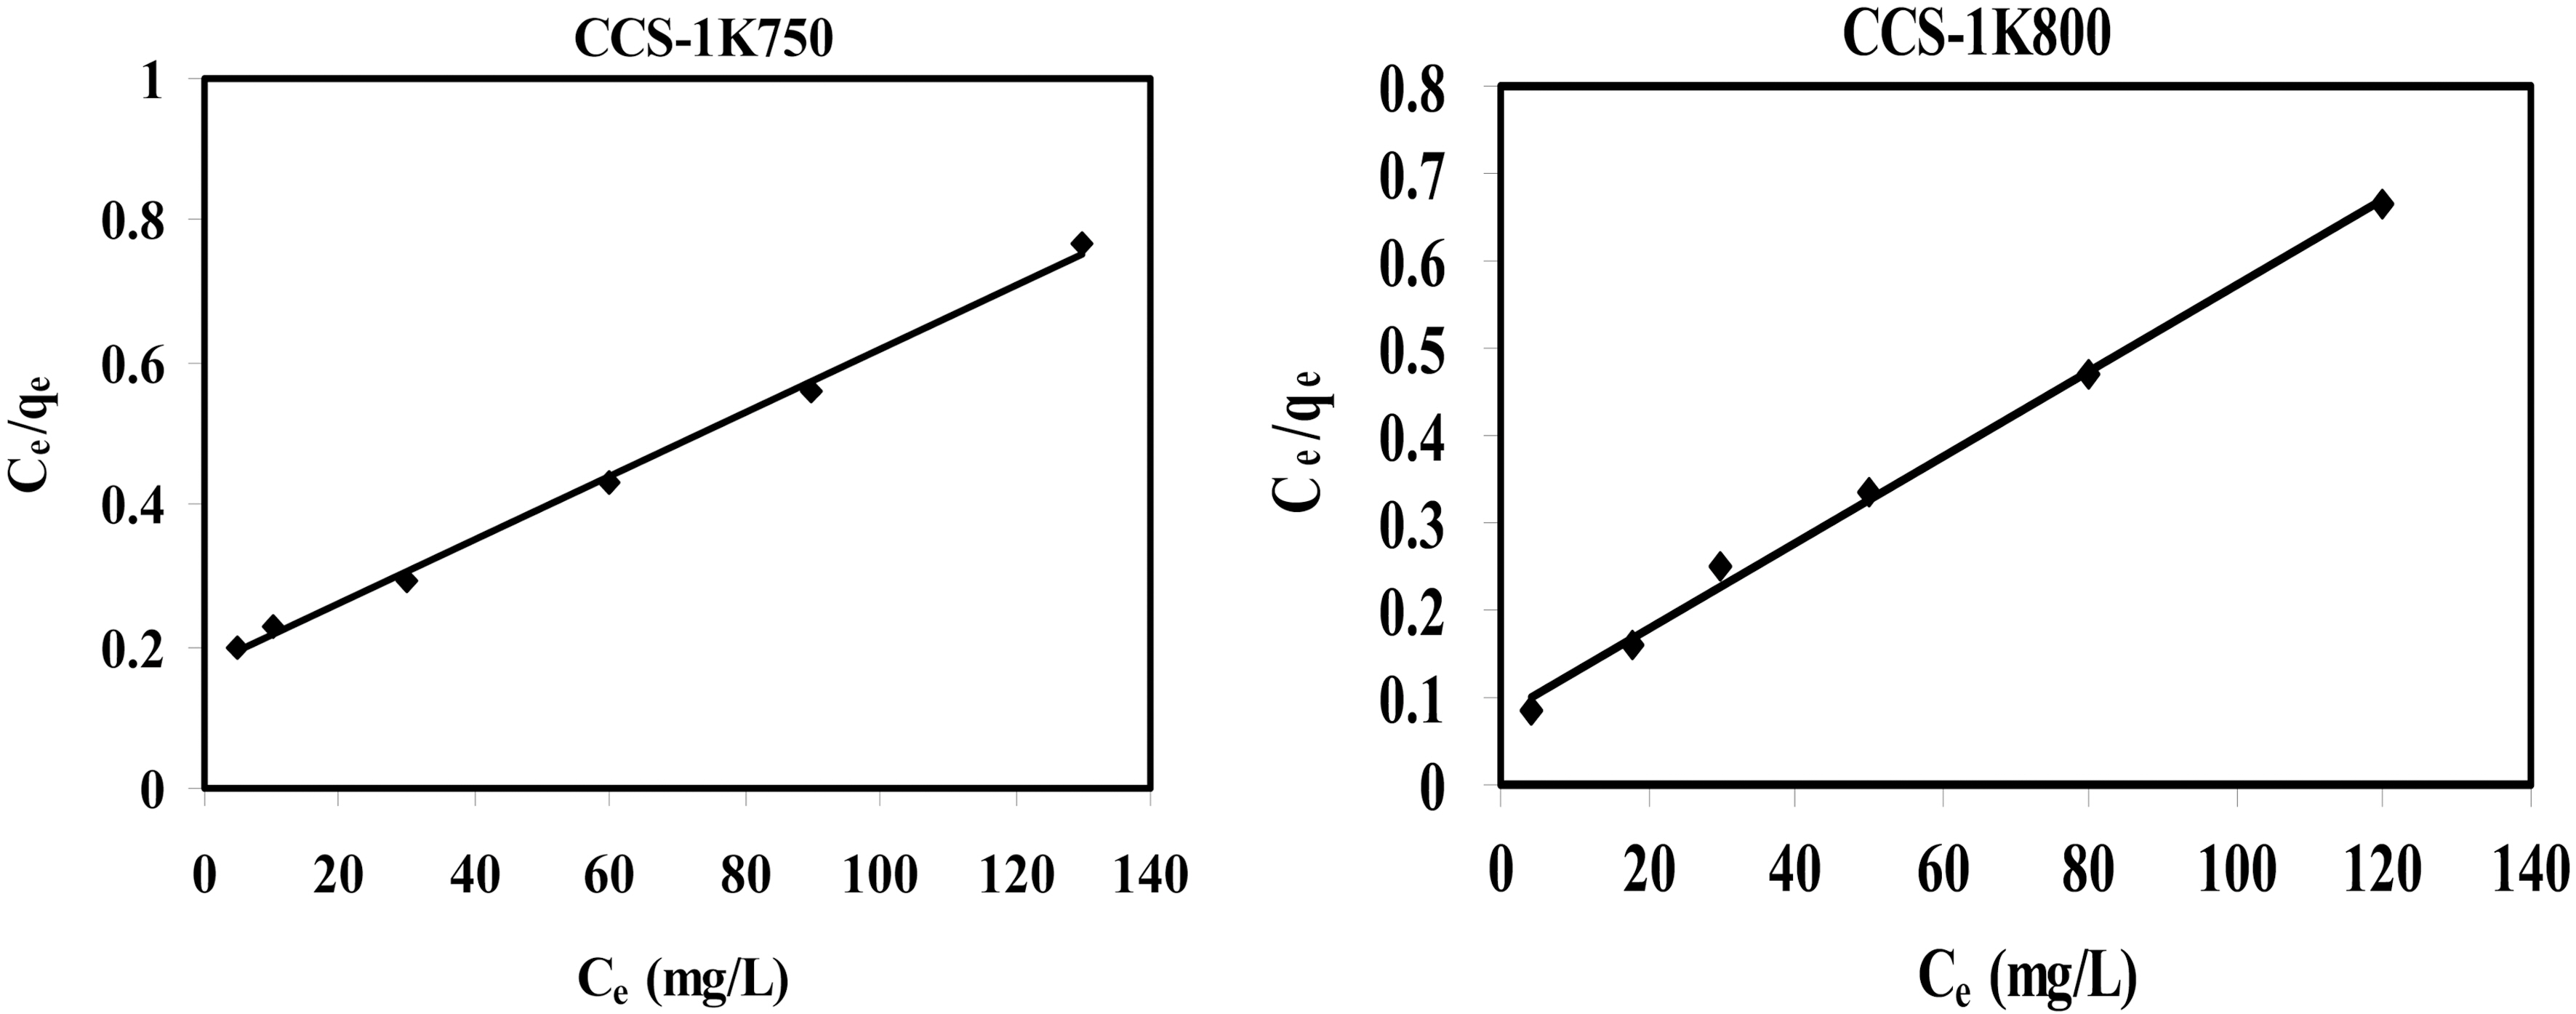
Two isotherm equations are tested in this work, i.e. the Langmuir and Freundlich models. The applicability of the isotherm equations was compared by judging the correlation coefficients,
Langmuir isotherm equation is represented by:
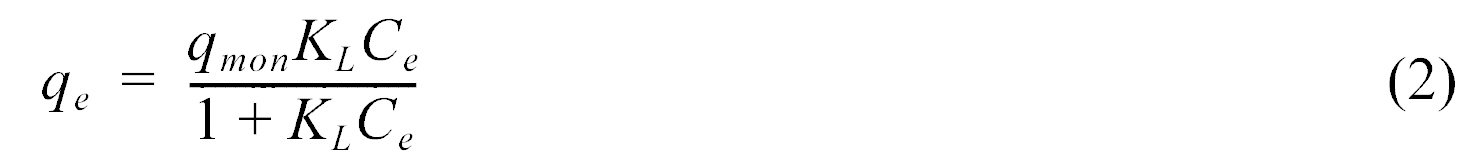
where
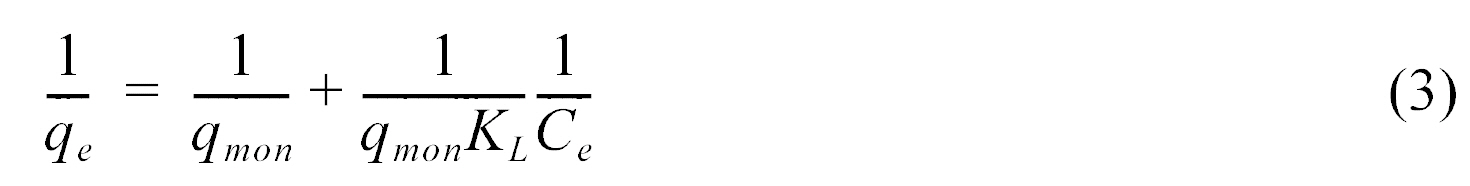
The linear plots of 1/
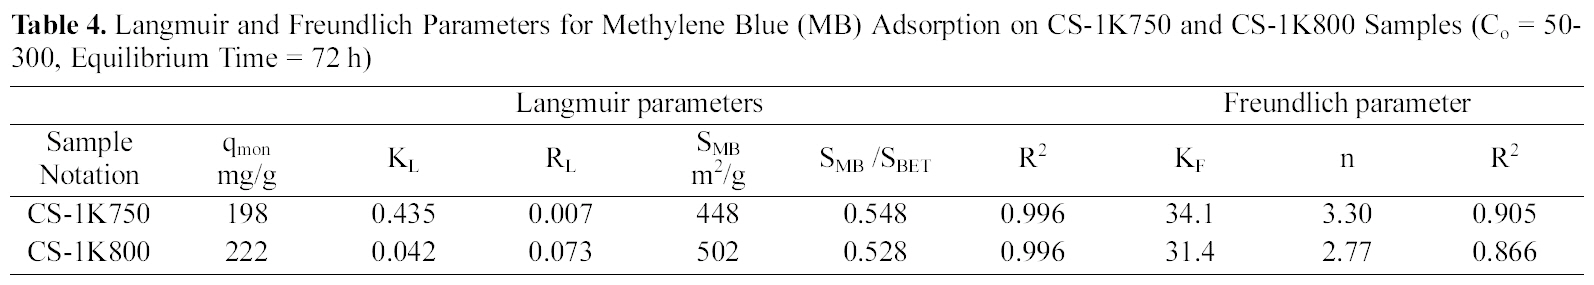
Langmuir and Freundlich Parameters for Methylene Blue (MB) Adsorption on CS-1K750 and CS-1K800 Samples (Co = 50-300 Equilibrium Time = 72 h)
adsorption capacity from 198 to 222 mg/g (~12.1%), which means an increase in accessible sites suitable for accommodation of the dye molecules (i.e. with dimensions ≥15 A). By adopting the value of 120 nm2 for the molecular area of MB to estimate the area covered by adsorbate (
The essential features of Langmuir adsorption isotherm can be expressed in terms of a dimensionless constant called separation factor or equilibrium parameter (
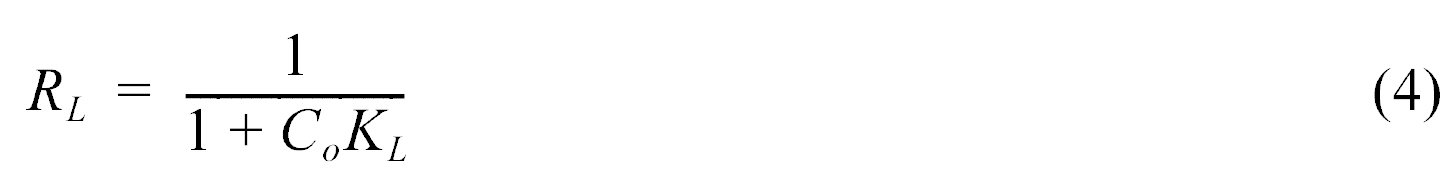
where
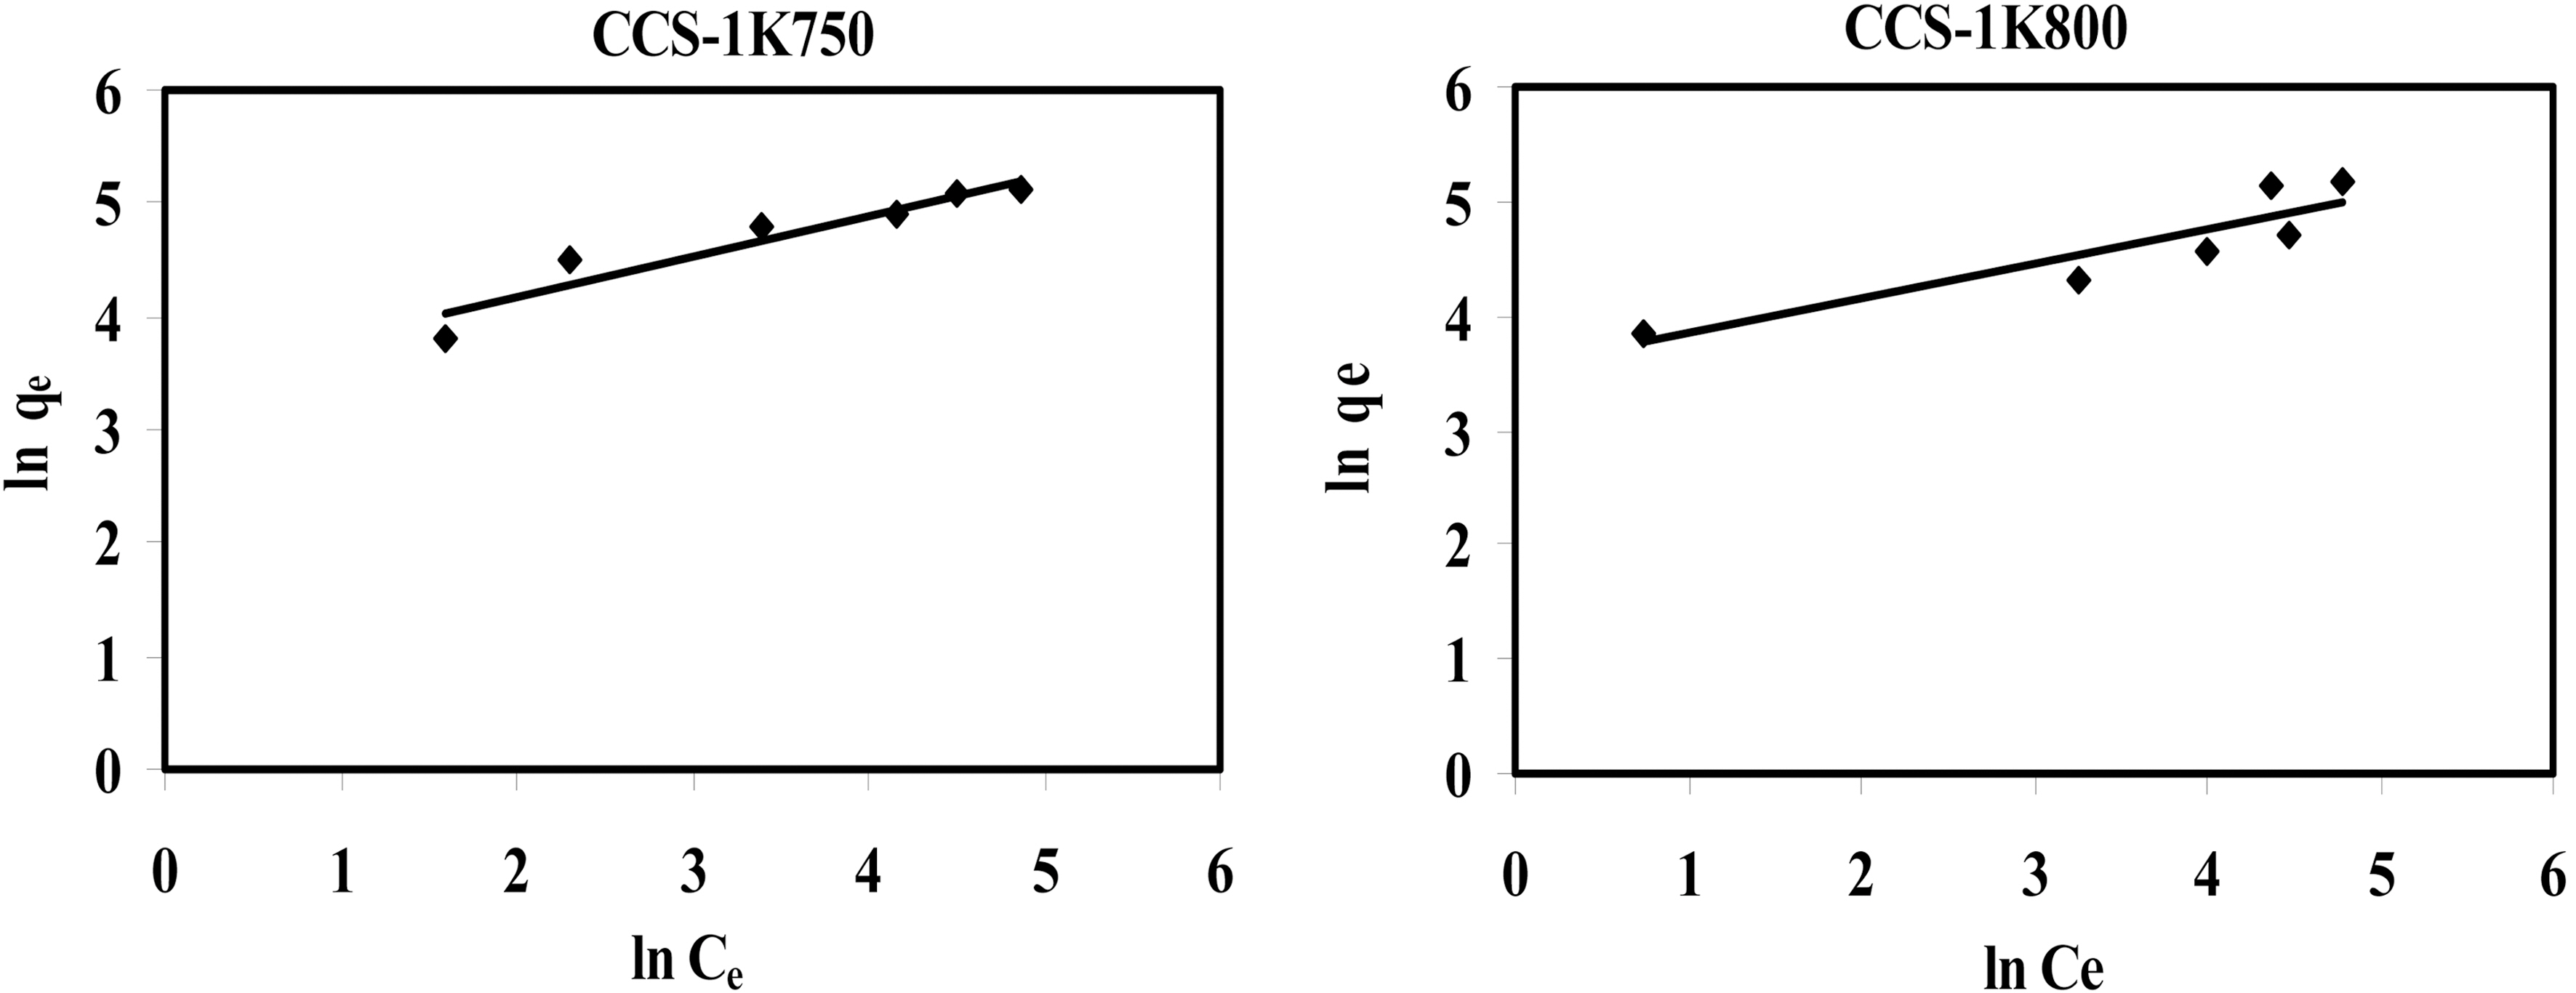
The Freundlich isotherm is the earliest known relationship describing the sorption equation. This fairly satisfactory
empirical isotherm can be used for non-ideal sorption that involves heterogeneous surface energy systems and is expressed by the following equation:

where

Linear plots of ln
3.5. Adsorption kinetics of methylene blue under different conditions
3.5.1. Effect of contact time and initial methylene blue concentration
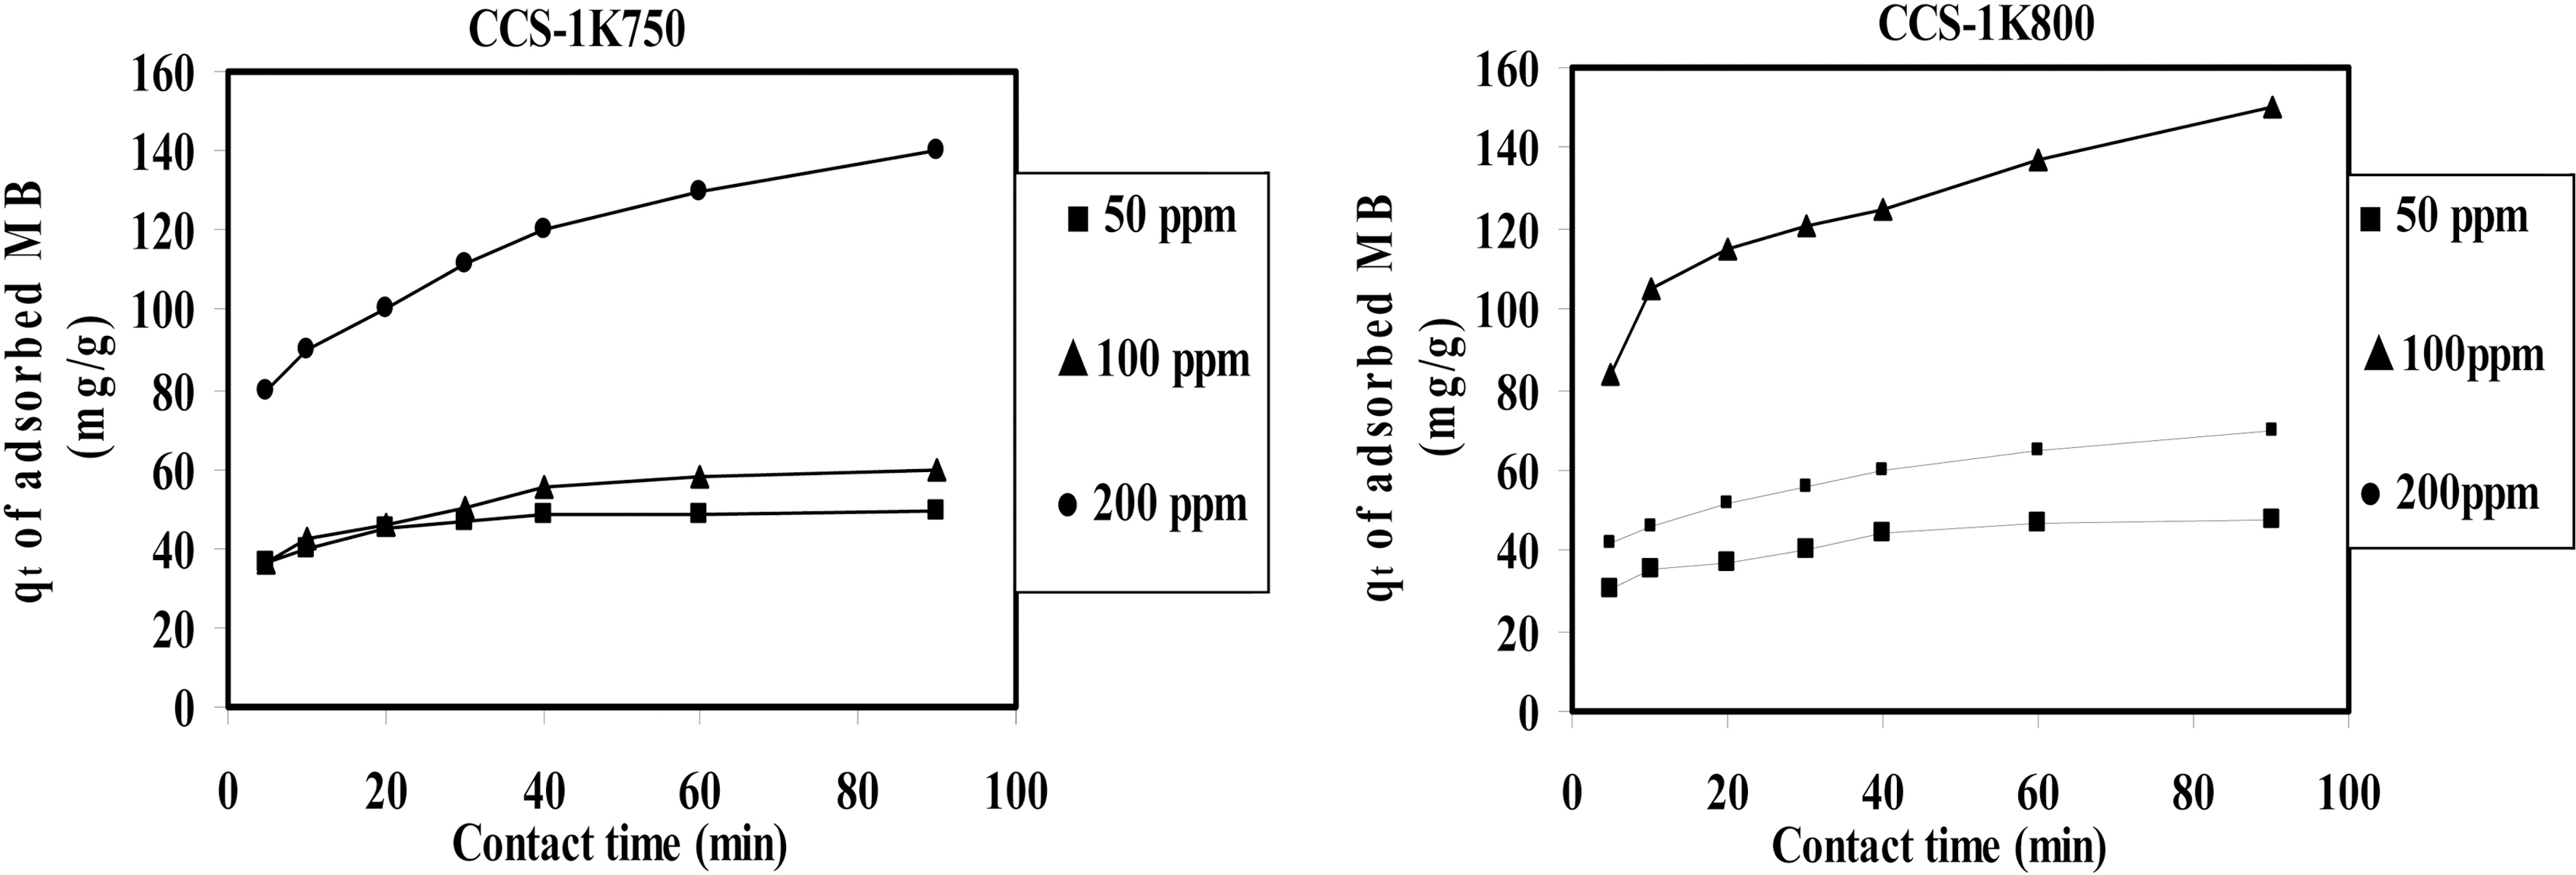
The effect of the initial MB concentration on the MB adsorption by CCS-1K750 and CCS-1K800 is depicted in Fig. .7 It can be seen that the amount of dye adsorbed (qt,mg/g) increased with increased dye concentration in solution and remained constant after equilibrium time. The concentration provides an important deriving force to overcome all mass transfer resistance of the dye between the aqueous and
solid phases. Therefore, a higher initial concentration of MB dye will enhance the adsorption process. When the initial dye concentration increased from 50 to 200 ppm (mg/L), the amount uptake of MB onto CCS-1K750 increased from 49 to 140 mg/g; and for CCS-1K800 from 48 onto 150 mg/g,whereas the percentage removal decreased from 100 to 72% within 90 min (not shown here). Thus, the uptake of MB dye increased with increasing initial dye concentration, while the % removal of dye showed the opposite trend. A similar trend was also observed for MB dye adsorption onto bamboobased activated carbon [4,42].
Fig. 7 also indicate that the contact time needed for MB solutions with initial concentration 50~100 mg/L to reach equilibrium was less than 40 min, whereas initial concentration of 200 mg/L, equilibrium time of 60 min was attained.
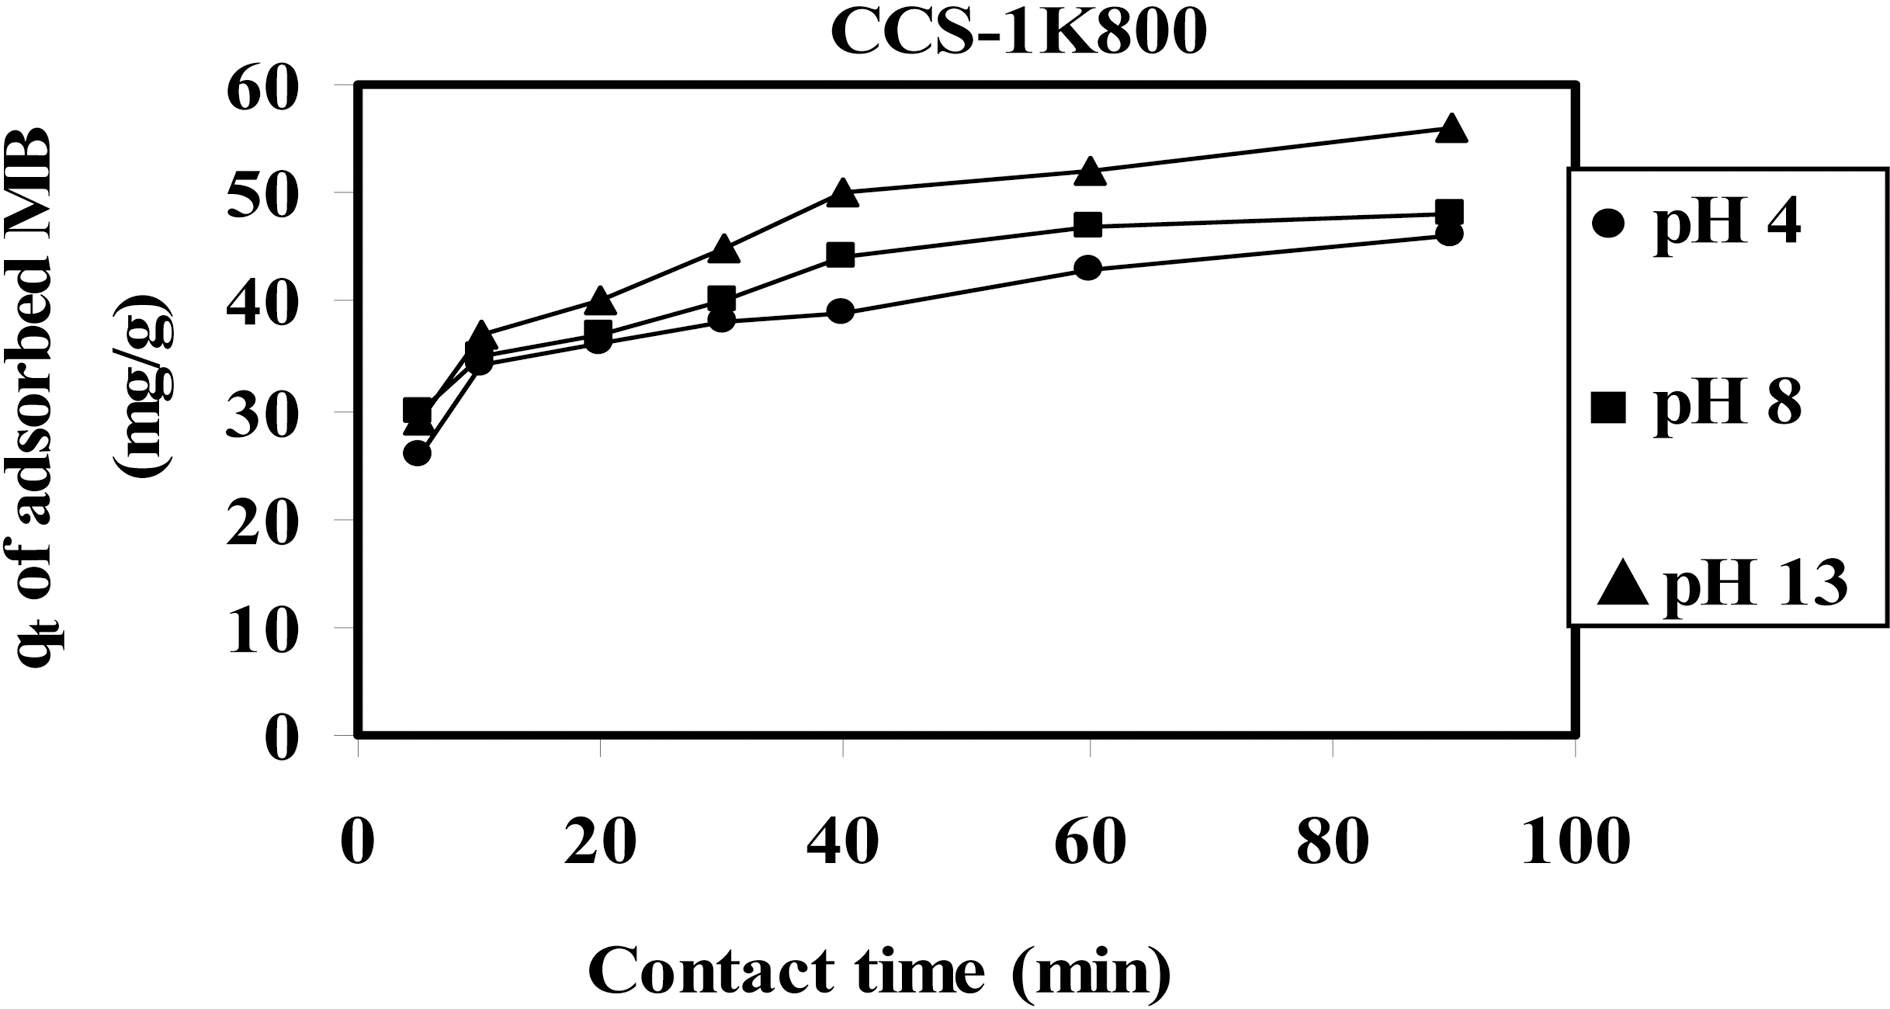
3.5.2. Effect of solution pH on MB dye adsorption in relation to contact time
The effect of solution pH on the equilibrium uptake of MB by CCS-1K800 was studied at 50 mg/L initial dye concentration at pH =4, 8 and 13 as shown in Fig. .8 The dye uptake was found to increase with slightly increase from
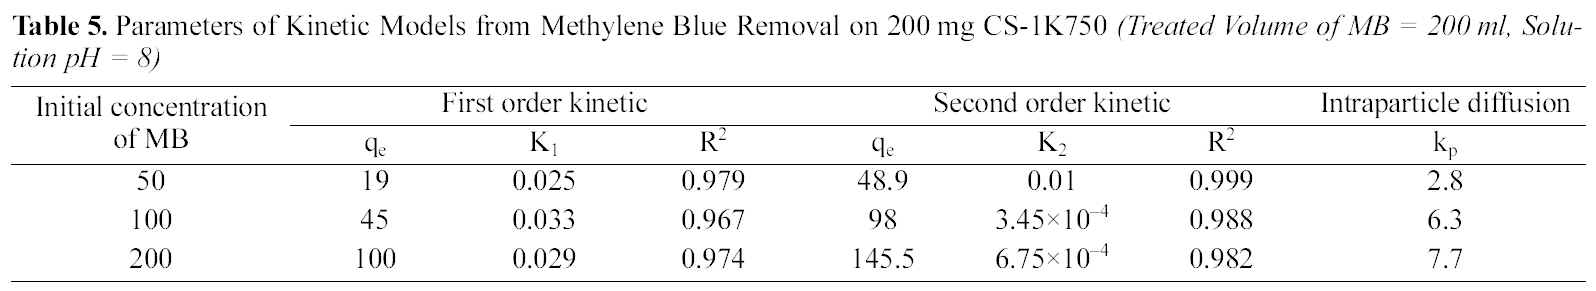
Parameters of Kinetic Models from Methylene Blue Removal on 200 mg CS-1K750 (Treated Volume of MB = 200 ml Solution pH = 8)

Parameters of Kinetic Models from Methylene Blue Removal on 200 mg CS-1K800 (Treated Volume of MB = 200 ml Solution pH = 8)
46 to 56 mg/g for an increase in pH from 4 to 13. Also, the required equilibrium time to reach maximum capacity through contact time plateau was 60 min. Hence, as pH increased,the removal increased slightly. However, several investigations have reported that MB adsorption usually increases as the pH is increased [43,44]. This finding may be attributed to a decrease in accessible sites suitable for the accommodation of the MB molecules (i.e. with dimensions≥15 A). Principally,MB and other cationic dyes produce an intense molecular cation (C+) and reduced ions (CH+). At high pH, OH? on the surface of adsorbent will favor the adsorption cationic dye molecules. Otherwise, at low pH as 4, the surface charge could be positively charged and H+ ions are formed which competes effectively with dye cations leading to a decrease in the uptake of MB dye [4].
3.5.3. Kinetic analysis
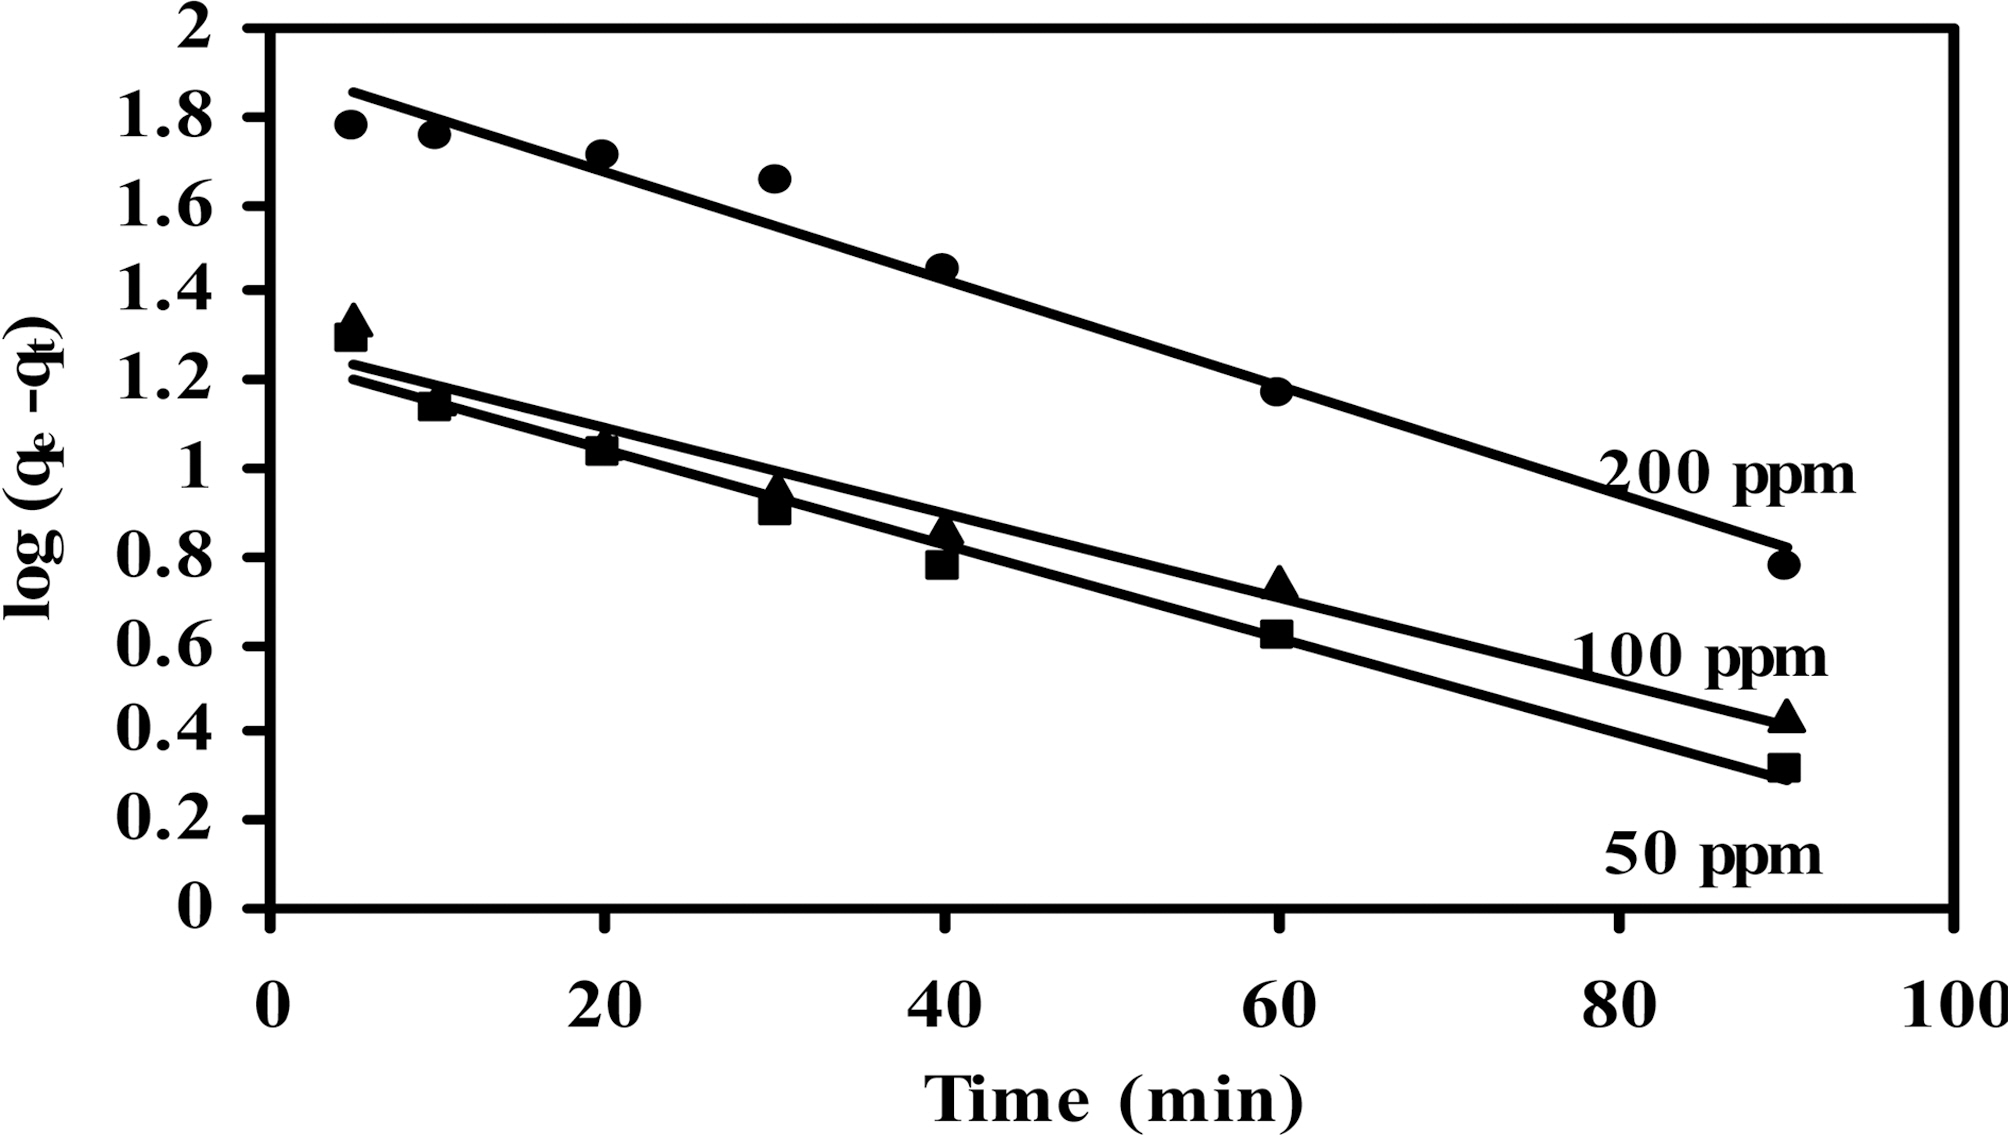
Several kinetic models have been applied to examine the controlling mechanism of dyes adsorption from aqueous solutions and explain the obtained experimental data [9]. The kinetics of adsorption can be described by the first-order Lagergren equation that is given by Eq. (7):
where
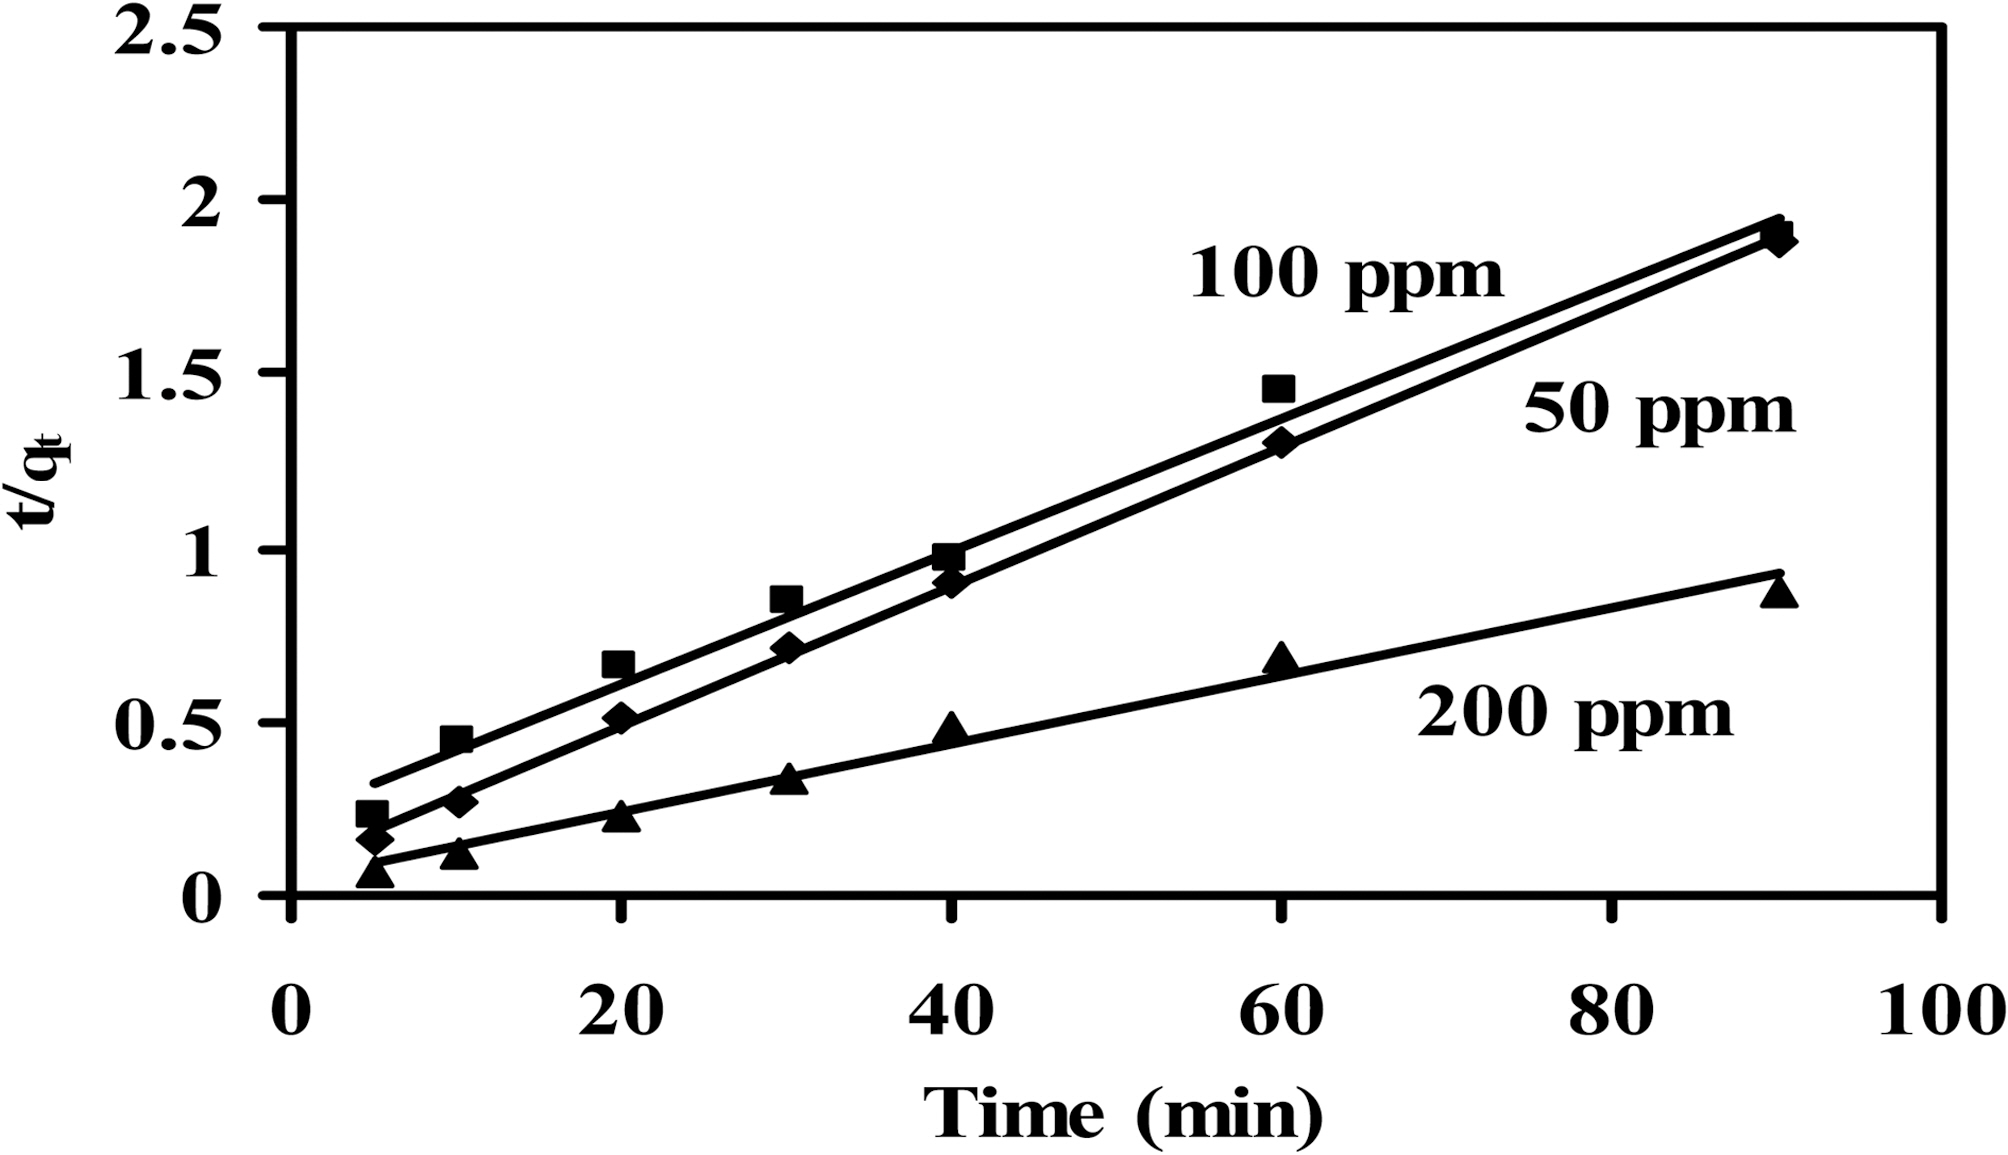
In some cases a pseudo-second-order model, given by Eq.(8), in its linear form provides a better fit:

where
of two kinetic models are cited in Table 5 and 6 for CCs-1K750 and CCS-1K800 (initial concentration=50~200 mg/L,treated volume of MB=200 ml, adsorbent weight=200 mg,pH=8 at 25oC). The plots of pseudo- first-, and-second-order for the adsorption of MB dye on CCS-1K750 are shown in Figs. 9 and 10, respectively.
From Table 5 and 6, it can be seen that the correlation coefficient (
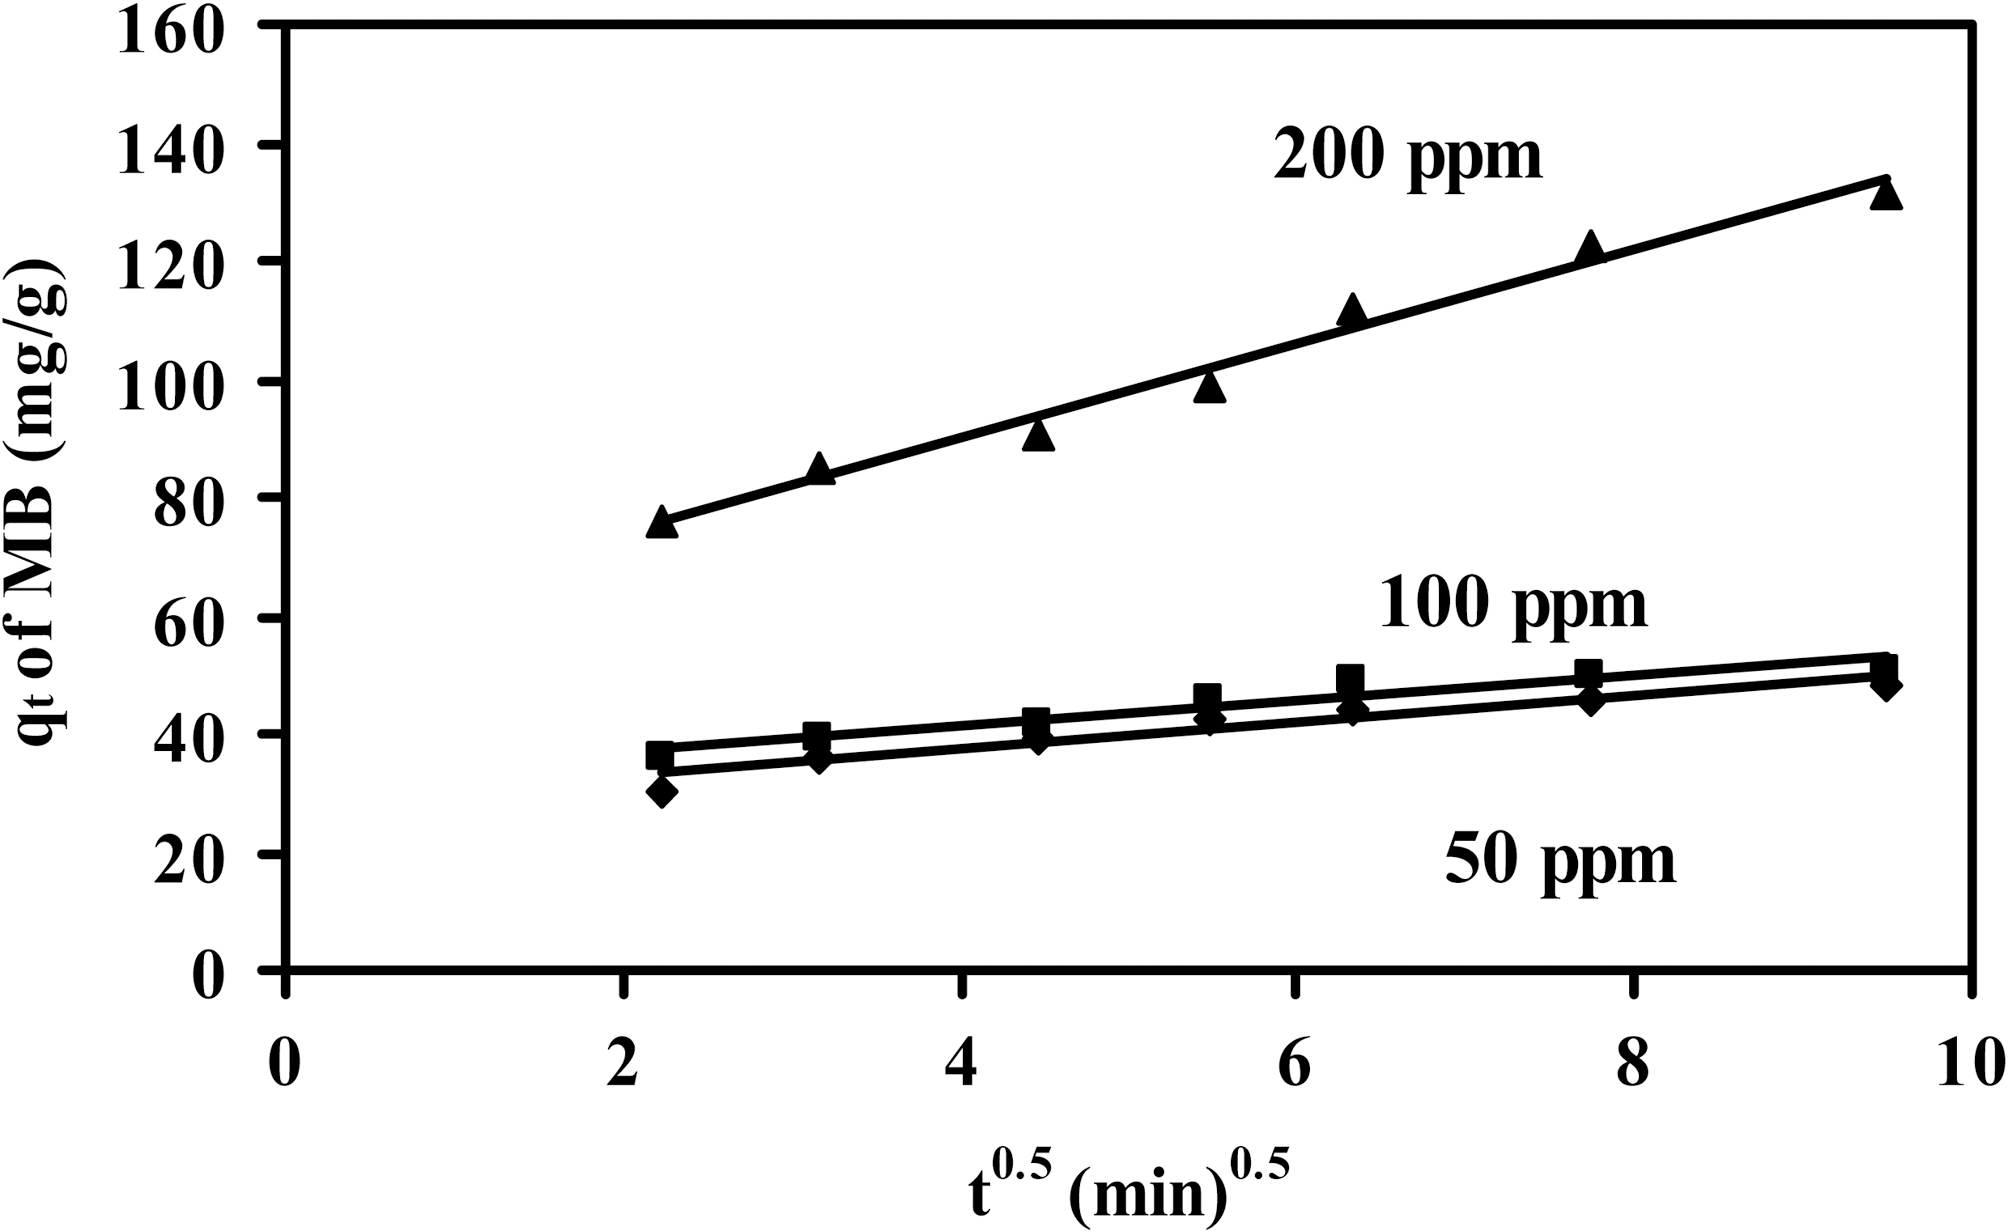
The kinetic adsorption results were further analyzed by the
intra-particle diffusion model to elucidate the diffusion mechanism [45], and given by the expression:

where,
Activated carbons derived from pre-semi-carbonization followed by KOH activation of cotton stalks, with different activation temperatures and chemical ratios of KOH, proved to be good-quality carbon adsorbents. Increased activation temperature enhanced surface area and pore volume up to 950 m2/g and to 0.423 cm3/g, respectively. Good adsorption capacity for methylene blue (MB) appears, under equilibrium conditions, attaining values of 222 mg/g associated with the texture properties (surface area and pore volume). Langmuir isotherm model adequately fits to the adsorption data. Within kinetic experiments, the pseudo-second-order model better explained the adsorption kinetics as compared to the pseudofirst-order model. The results of this study indicate that such laboratory carbons derived from cotton stalks could be employed as low cost alternative to commercial carbons in wastewater treatment.