Color has always been very important in nature and environment and it continues to play a very significant role in imparting interesting hues to plants, animals and in the lives of mankind. After the dyeing process the residual and unspent substances are usually discharged into the environment. Amongst the different industrial wastewaters with different types of color-causing substances, synthetic textile organic dye wastes occupy a prominent position [1]. The colloidal matter can often be carcinogenic; show allergic reactions; interfere with photosynthesis; clog the pores of the soil; be a breading ground for bacteria and viruses. It is important to remove these pollutants from the waste waters before their final disposal [2-4]. Adsorption of organics from solutions on activated carbon is one of the oldest and widespread applications of this material. Earlier studies of activated carbon adsorption were carried out on fatty acids and later extended to a large number of dyes [5].
Nevine Kamal Amin [6] investigated the use of activated carbons prepared from pomegranate peel for the removal of direct blue dye from aqueous solution. Azza Khaled
Abhiti Purai
The present work forms a part of continuing study to compare the adsorptive capacity of different samples of activated carbon and low cost adsorbents.
Samples of Granular Activated Carbon C1 and C2 used were obtained from Brillex Chemical Ltd. Punjab and Industrial Carbon Pvt. Ltd., Gujarat. Surface area of GAC C1 used in the study was 950 m2/g and that of GAC C2 was 600 m2/g. Bulk density of the two was 500~550 and 600~650 g/L respectively. The ash content was 6% in C1 and 5% in C2. From the stock solution of the dyes dilutions were made with distilled water to make different concentrations. Optical density of all the solutions was measured on a spectrophotometer (ELICO make, wavelength range 200~
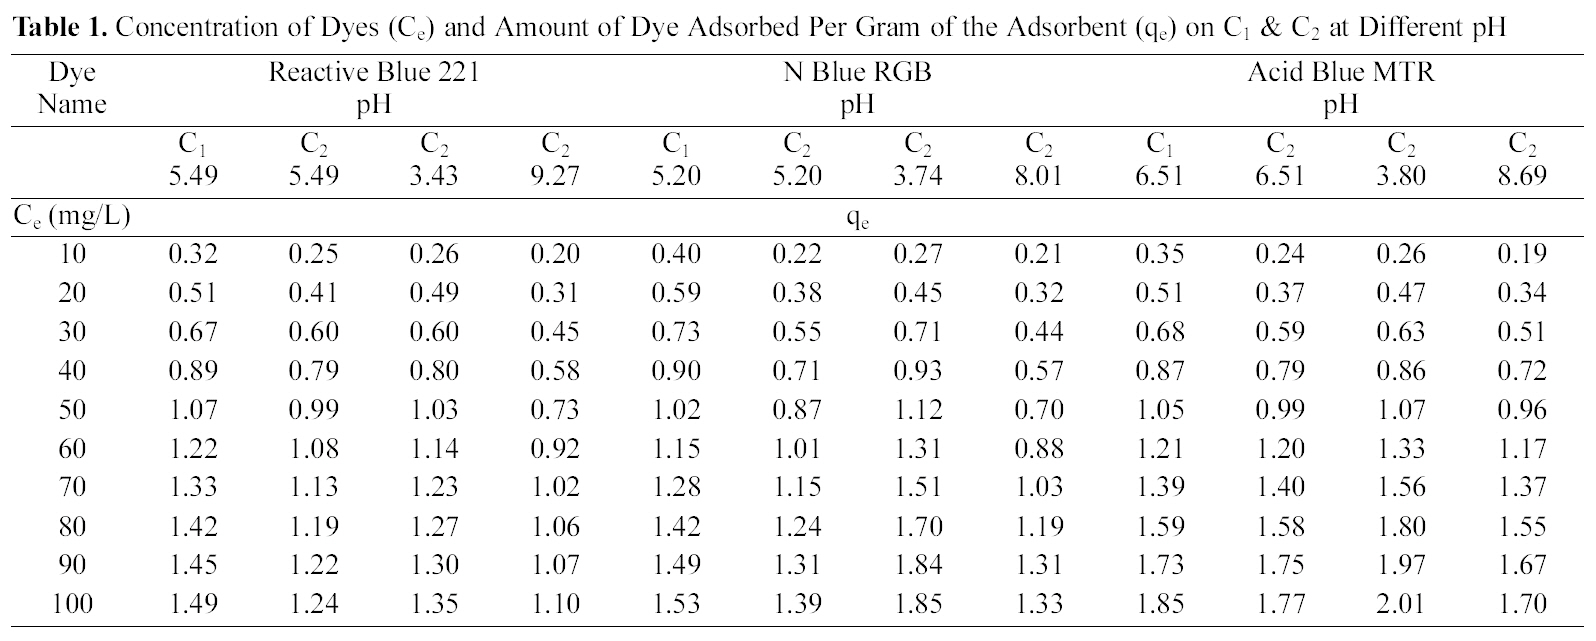
Concentration of Dyes (Ce) and Amount of Dye Adsorbed Per Gram of the Adsorbent (qe) on C1 & C2 at Different pH
900 nm). One gram of activated carbon was placed in each 50 mL solution of 10 to 100 ppm. The solutions were shaken and kept in a thermostat for 24 h. The samples were then filtered and analyzed spectrophotometrically.
3.1. Effect of initial dye concentration
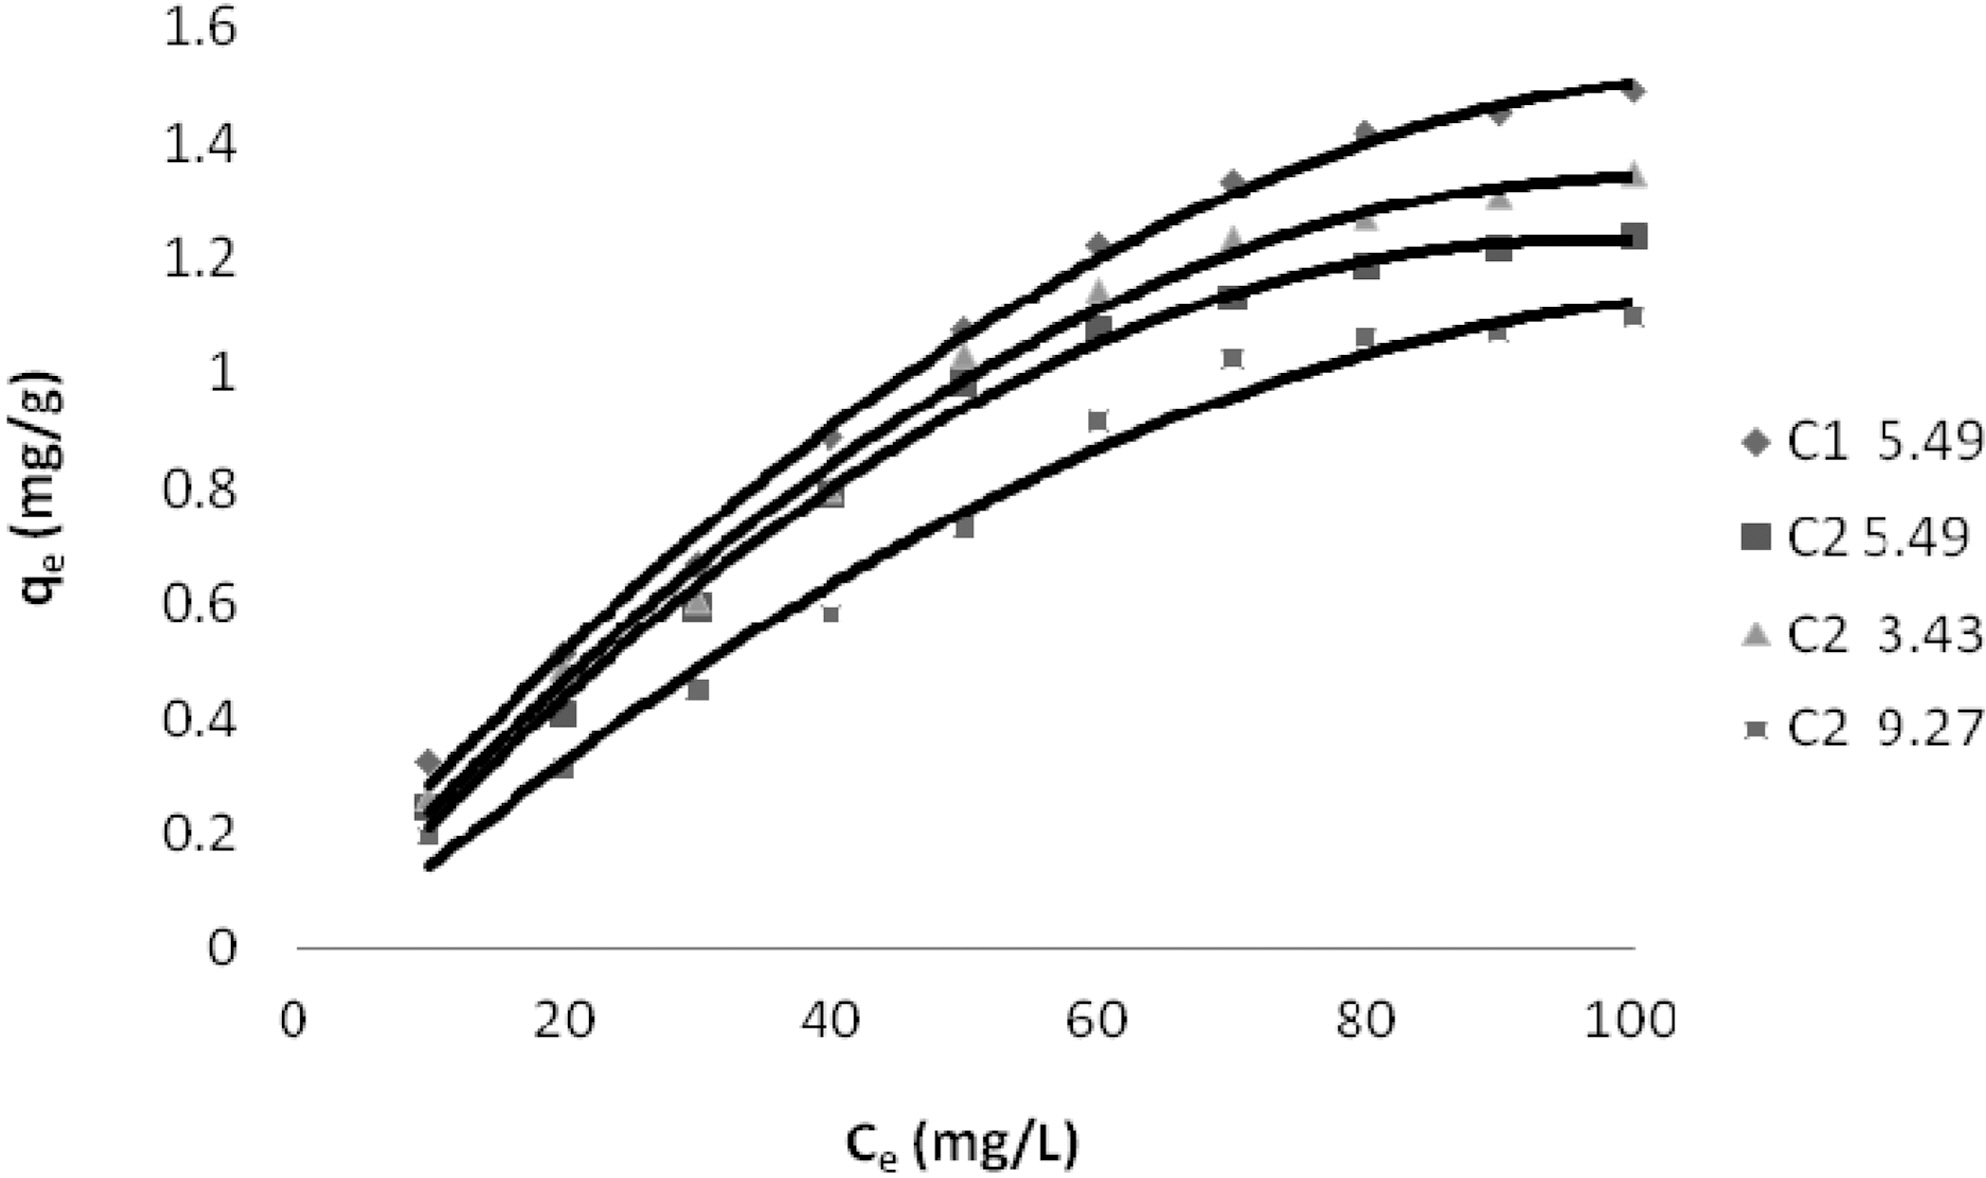
Table 1 and Figs. 1~3 show the amount qe of Reactive Dye Blue 221, N Blue RGB and Acid Blue MTR adsorbed by C1 and C2 samples of granulated activated carbon at various pH values and various ppm concentrations. It can be seen that qe on GAC C1 and C2 was higher at lower ppm concentration as compared to the adsorption at higher ppm concentration with the adsorbent dose being kept constant for all the three dyes. At 10 ppm concentration and initial (slightly acidic) pH of 5.49 C1 adsorbed 0.645 mg/g of the dye Reactive Blue 221 and C2 adsorbed 0.495 mg/g. At 100 ppm concentration the adsorption of Reactive Blue 221 was 2.978 mg/g, 2.470 mg/g, on C1 and C2 respectively at the same pH. This pattern of higher adsorption on lower ppm concentrations was observed for all the three reactive dyes. C1 showed better adsorption as compared to adsorption on C2.
[Table 2.] Values of Different Constants for Polynomial Fit Data
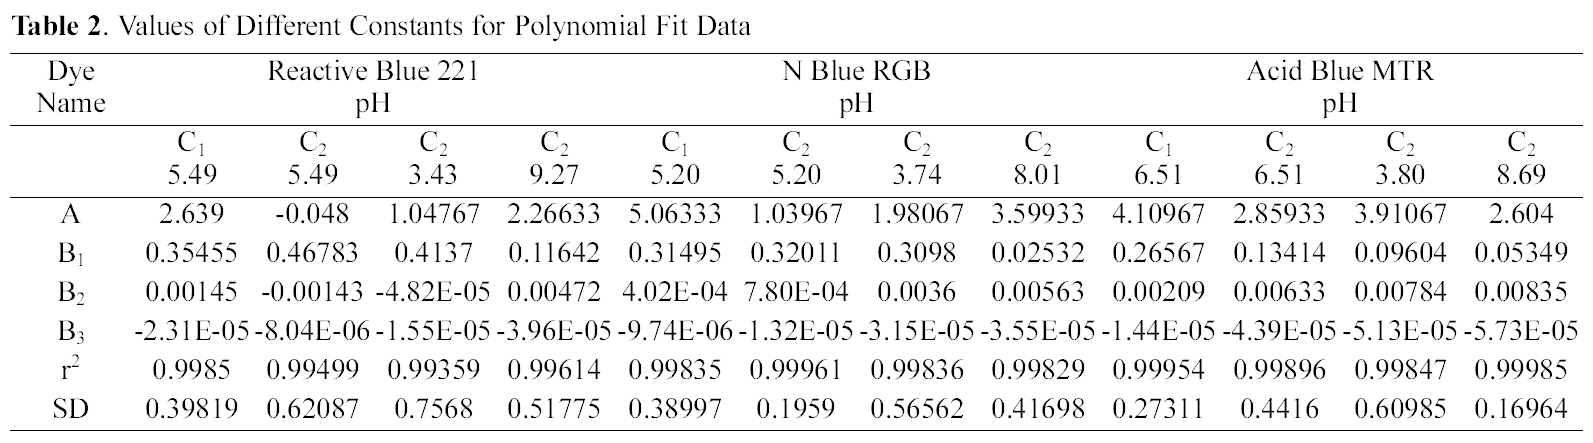
Values of Different Constants for Polynomial Fit Data
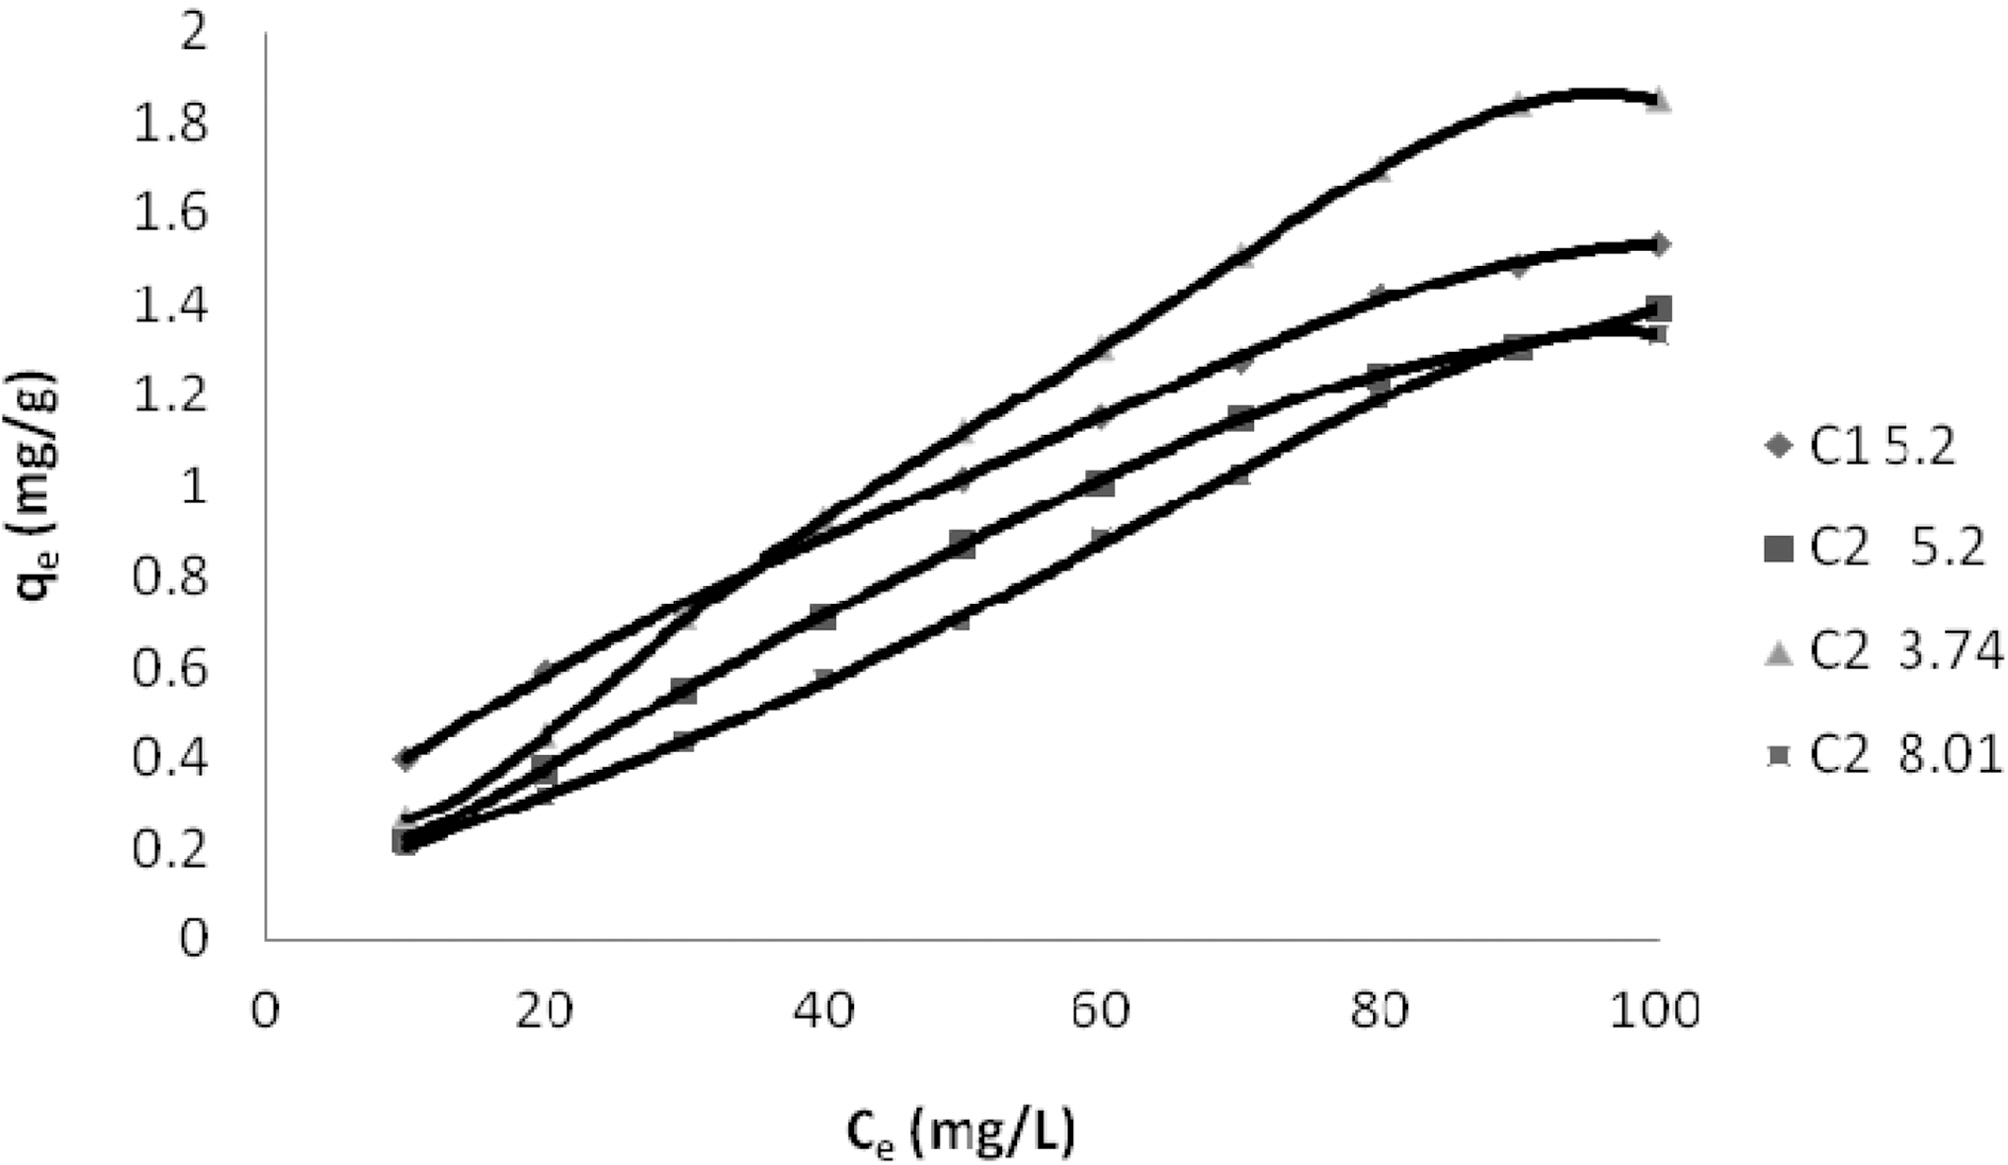
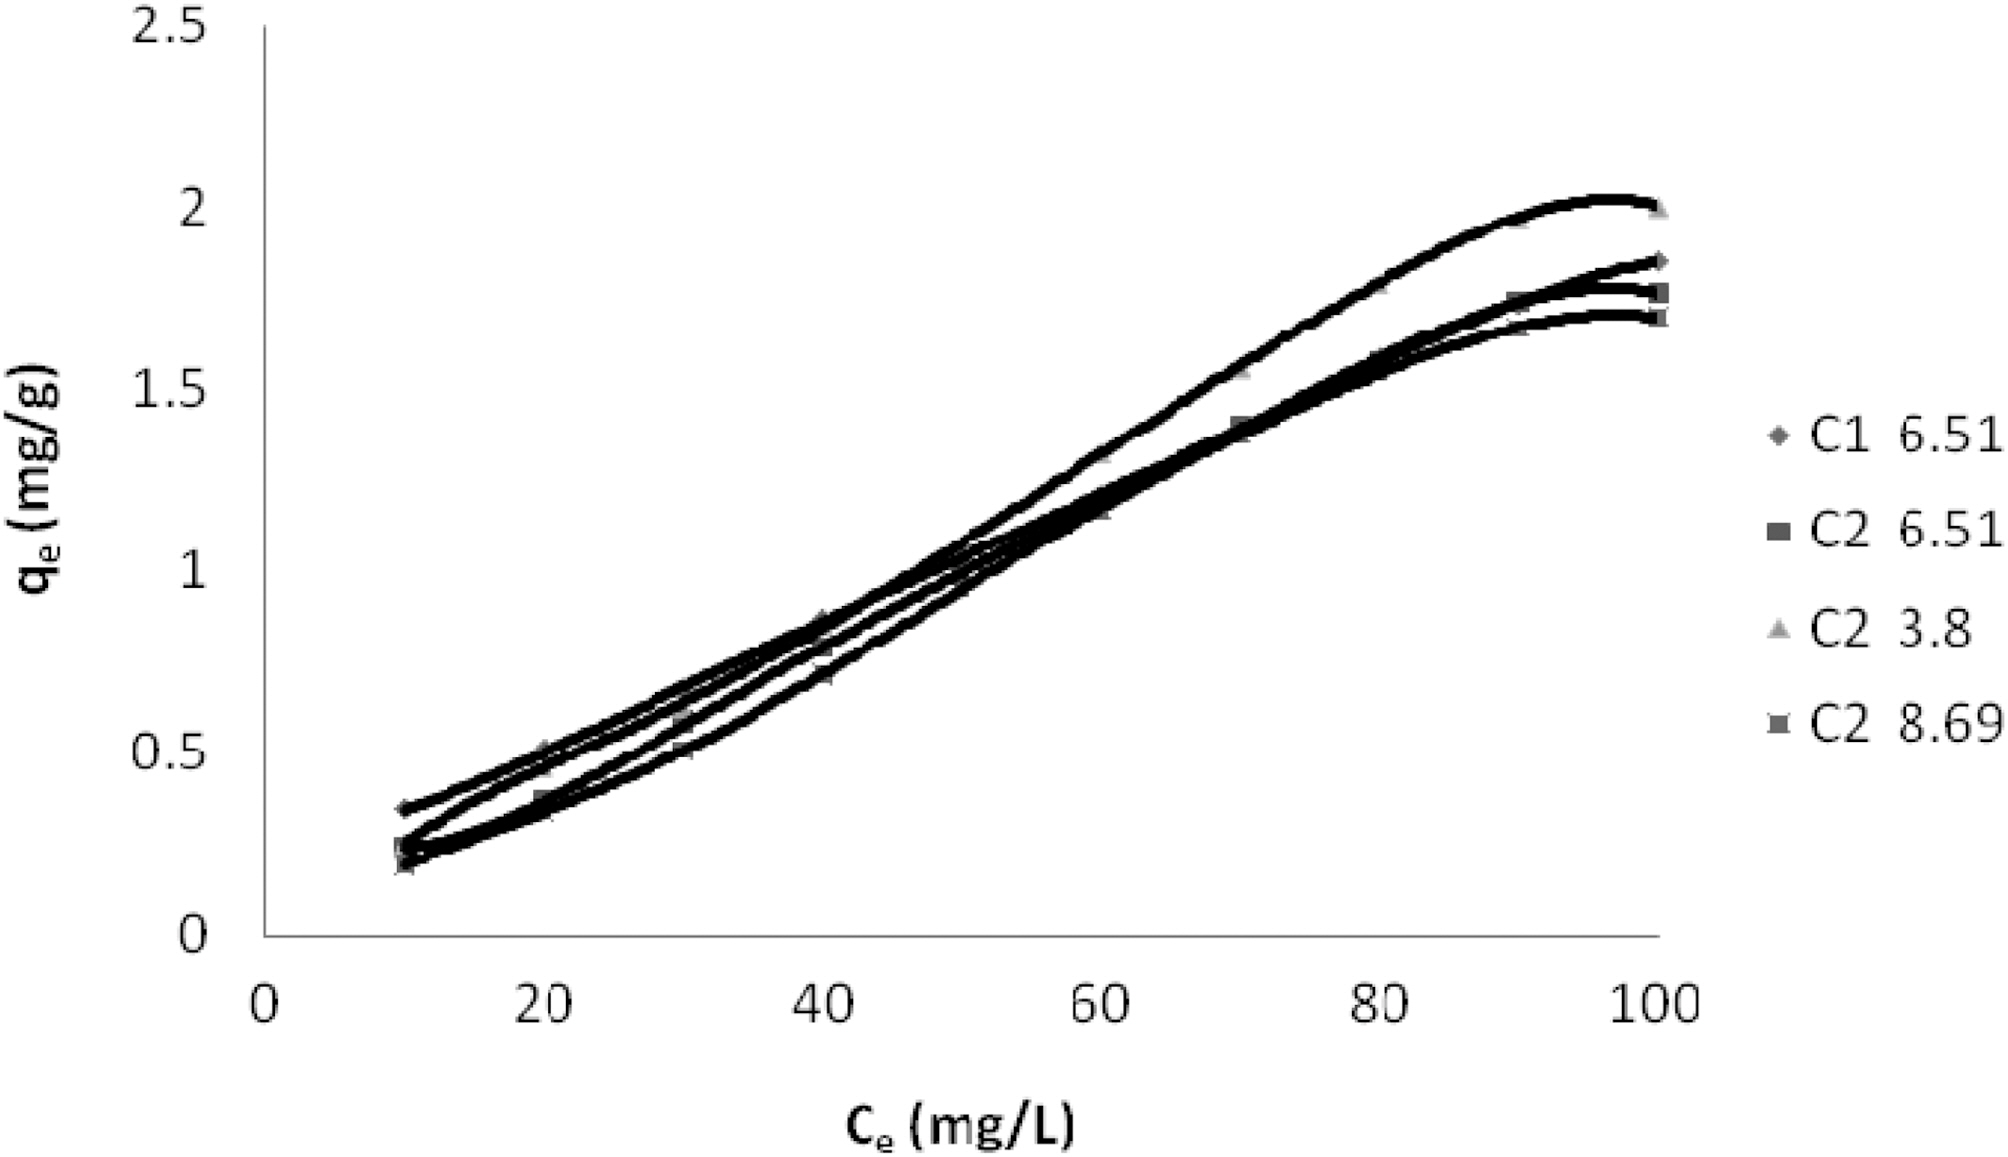
Adsorption of the three dyes has been studied at different pH for carbon sample C2 and at one pH for C1. C2 was greatly effected by change in pH of the aqueous solution as can be seen in Table. 1 and Figs. 1~3. Amount of dye adsorbed qe on C2 in acidic pH is higher at all ppm concentrations as compared to adsorption in a lesser acidic and an alkaline environment. At an acidic pH of 3.43 at 10 ppm concentration C2 adsorbed 5.21 mg/g of the dye Reactive Blue 221. In an alkaline pH of 9.27 the same C2 adsorbed only 3.90 mg/g leaving behind a good number of free adsorption sites on the adsorbent. The same pattern could be observed on N Blue RGB and Acid Blue MTR. At 10 ppm concentration C2 adsorbed 5.40 mg/g and 5.10 mg/g of N Blue RGB and Acid Blue MTR at acidic pH. At alkaline pH the adsorption was only 4.10 mg/g and 3.80 mg/g respectively at the same 10 ppm concentration of N Blue RGB and Acid Blue MTR.
C1 as compared to C2 shows higher adsorption at initial pH .It also shows better adsorption than C2 did in acidic environment.
3.3. Data fit for Simple isotherms
It can be seen from Figs. 1~3 that the experimental data fitted well to polynomial equation of the type:
qe=A+B1Ce+B2Ce2+B3Ce3
The constants and standard deviation are given in Table 2. Comparative adsorption of all the dyes on C1 & C2 at various pH values is shown in Figs. 1~3. Maximum dye removal of N Blue RGB was observed on C1 at acidic pH 5.2. Least adsorption efficiency of all the three dyes was shown by C2 at alkaline pH values. On the whole C1 exhibited most favourable adsorption at initial pH values as compare to C2. C2 showed maximum adsorption at acidic pH.
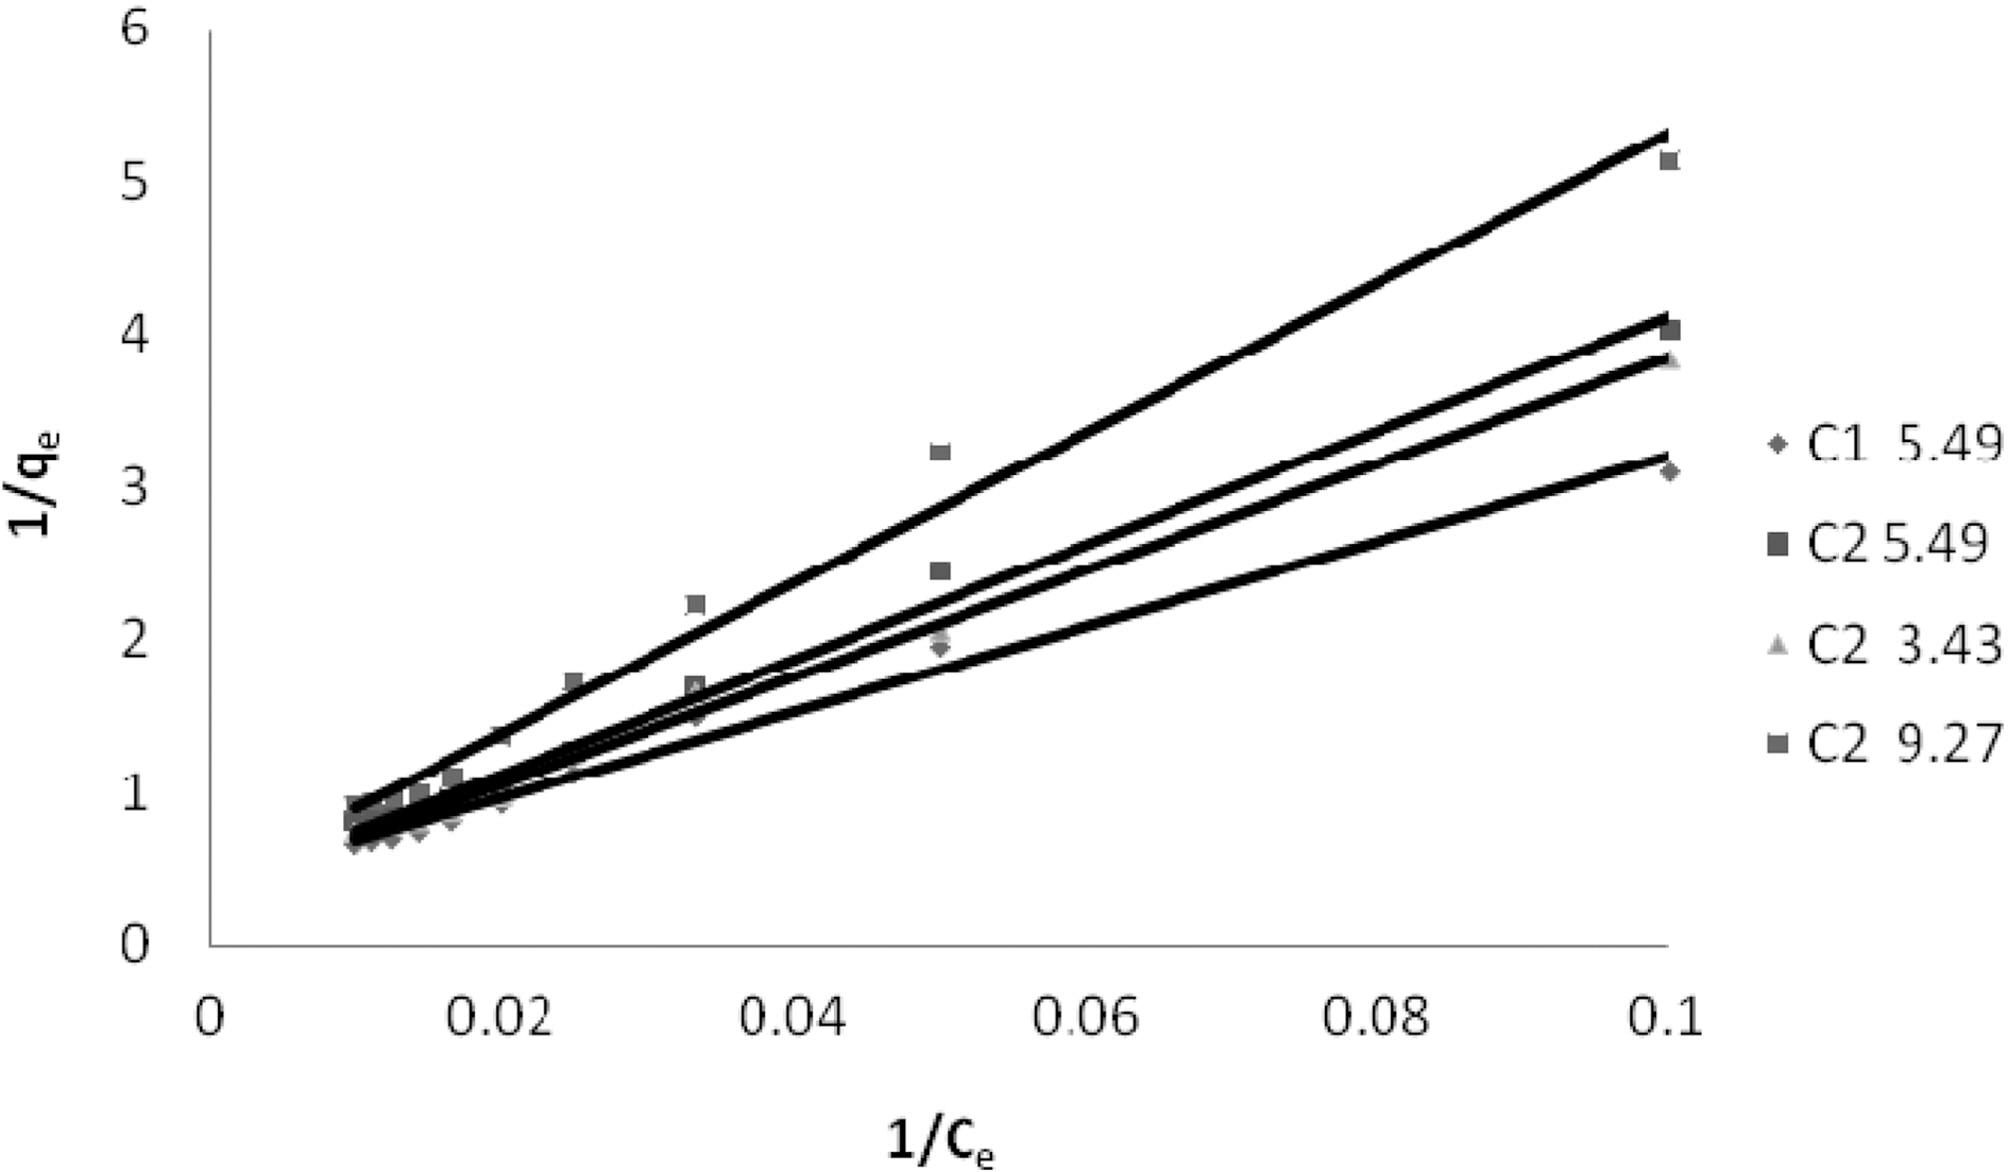
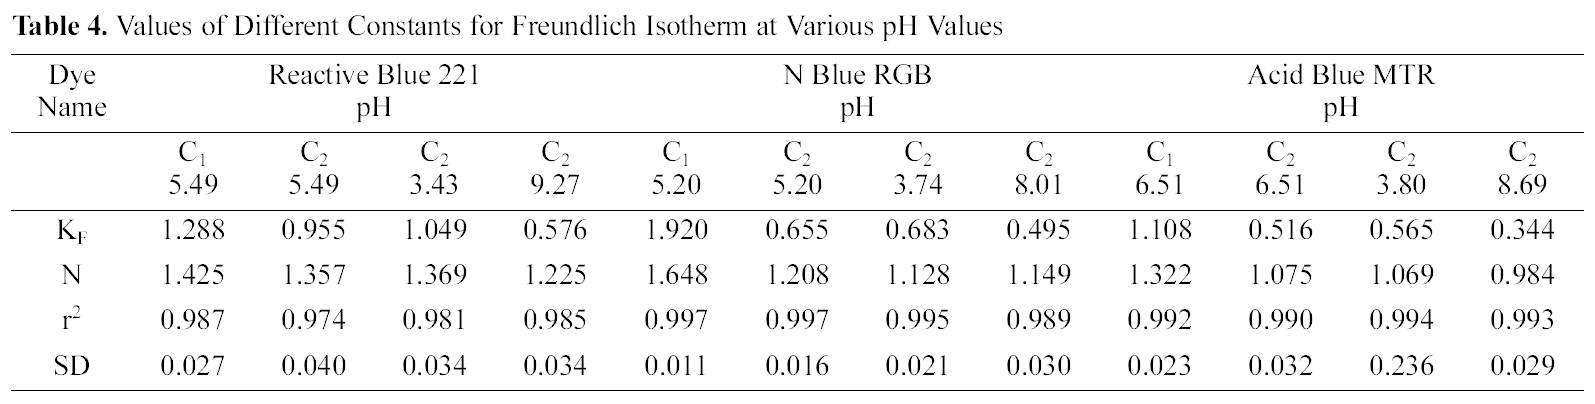
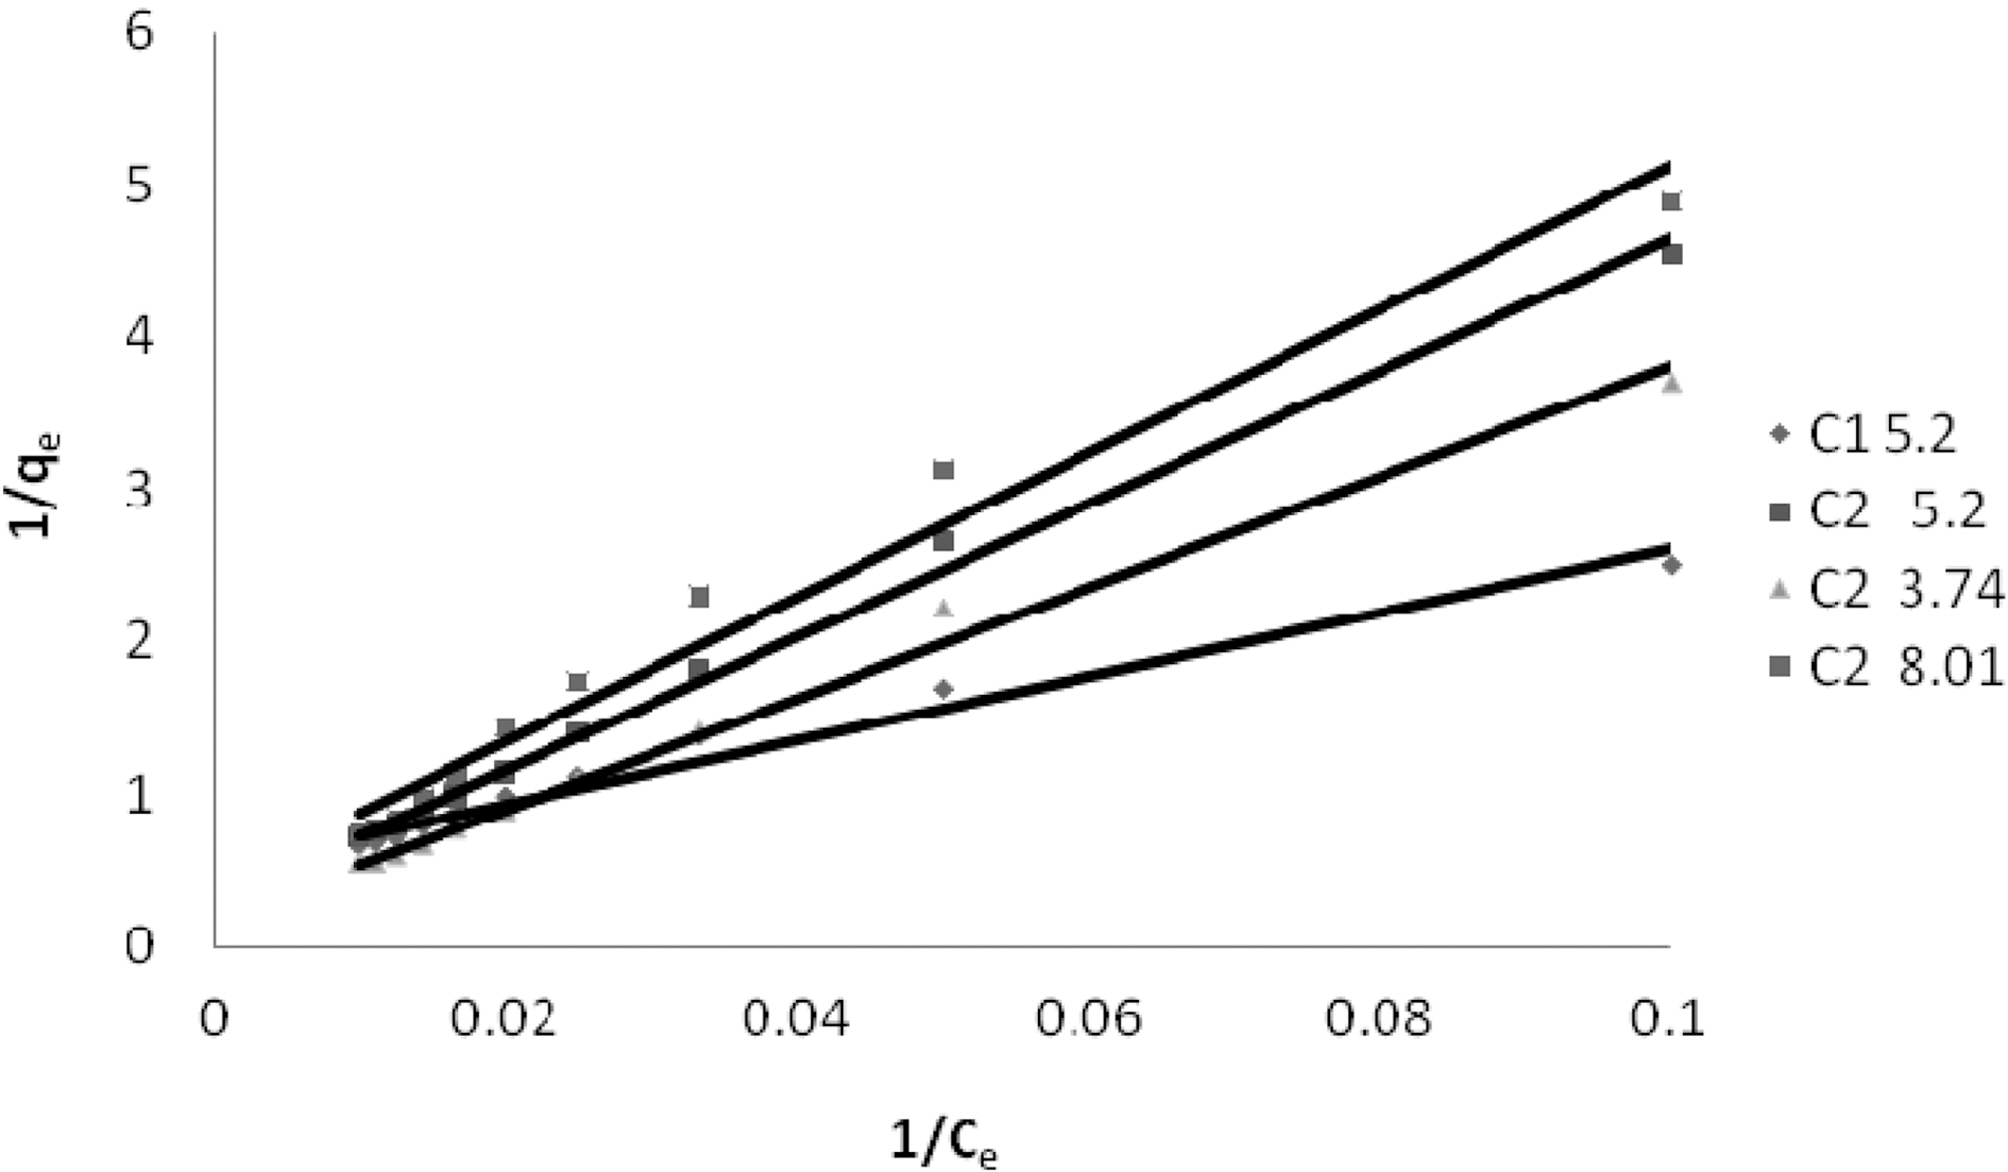
3.4. Langmuir isotherm at various pH
The experimental data was fitted to linear form of
Langmuir isotherm for all the pH values of the three dyes and for the two samples of GAC.
Q and b the Langmuir constants were calculated from the straight line slope and intercept of linear plot between 1/qe and 1/Ce as shown in Fig. 4 to 6.
Table 3 gives the values of Langmuir constants Q and b along with the values of r2 and SD for all the three dyes and their varied pH values and for the two samples of GAC, C1 and C2. Value of constants Q b signify good adsorption of all
[Table 3.] Values of Different Constants for Langmuir Isotherm at Various pH Values
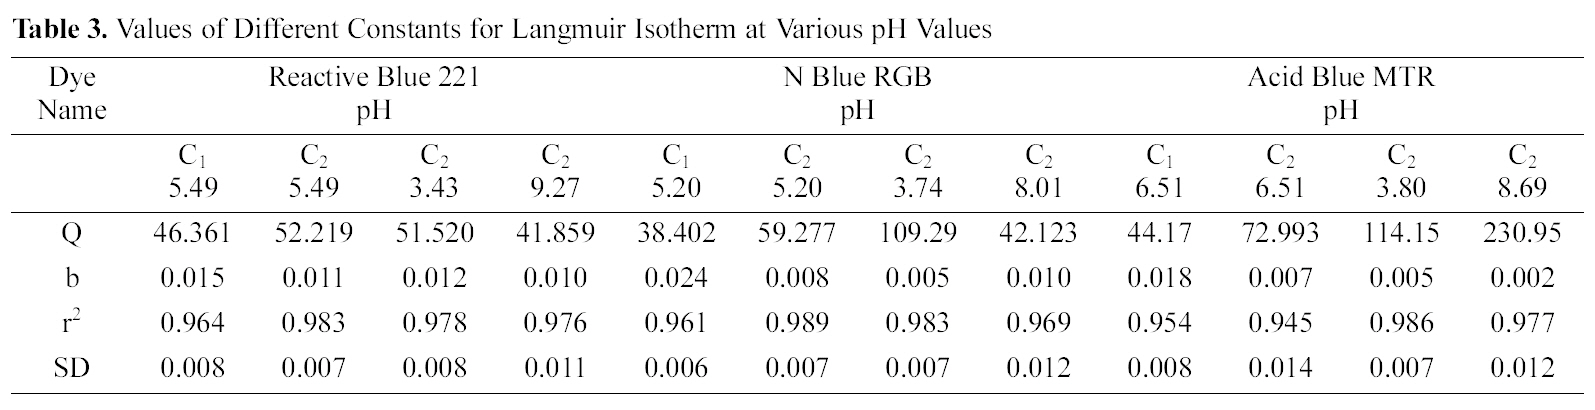
Values of Different Constants for Langmuir Isotherm at Various pH Values
[Table 4.] Values of Different Constants for Freundlich Isotherm at Various pH Values

Values of Different Constants for Freundlich Isotherm at Various pH Values
the three dyes on C1 as compared to C2 at initial pH. It also indicates a better adsorption at acidic pH on C2.
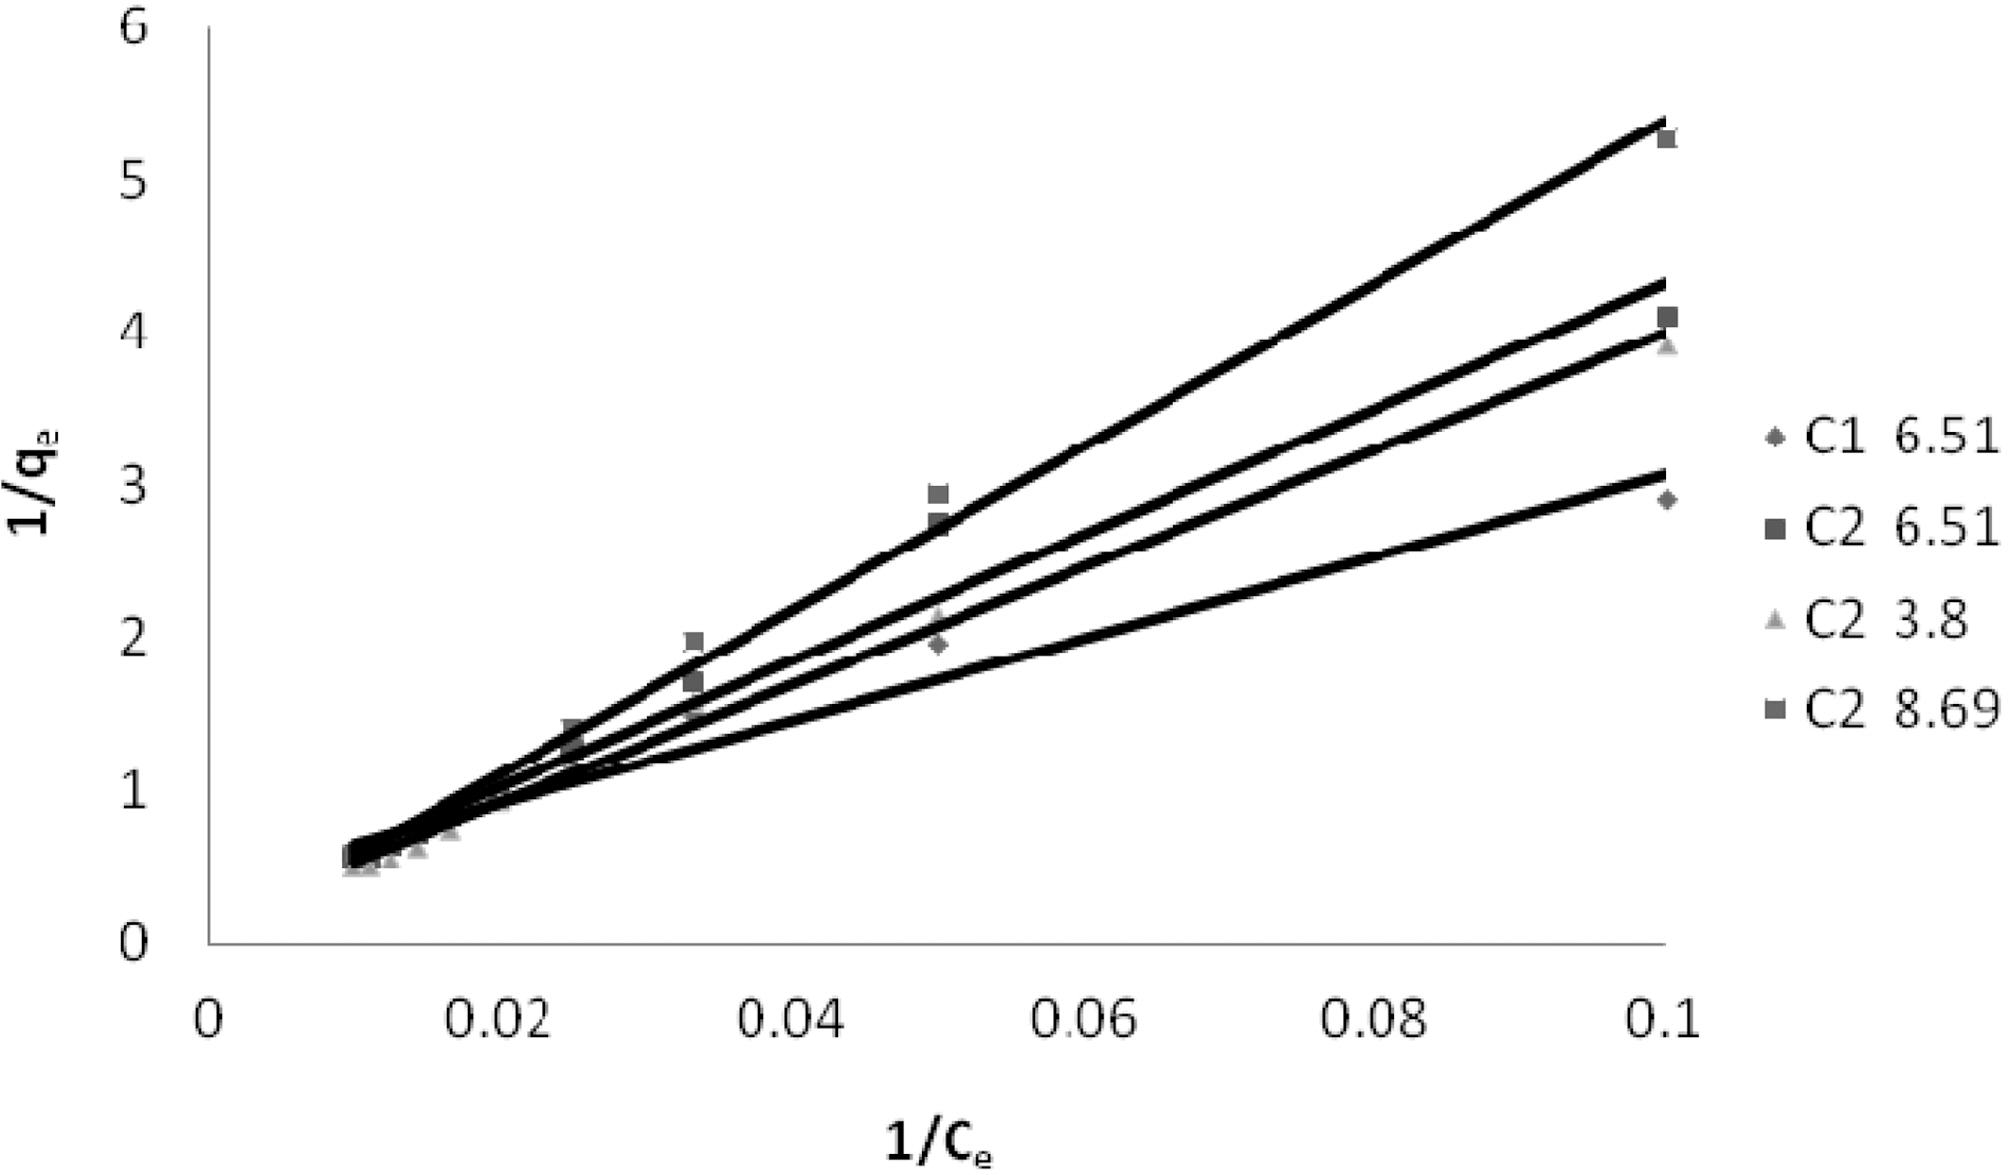
3.5. Freundlich isotherm at various pH
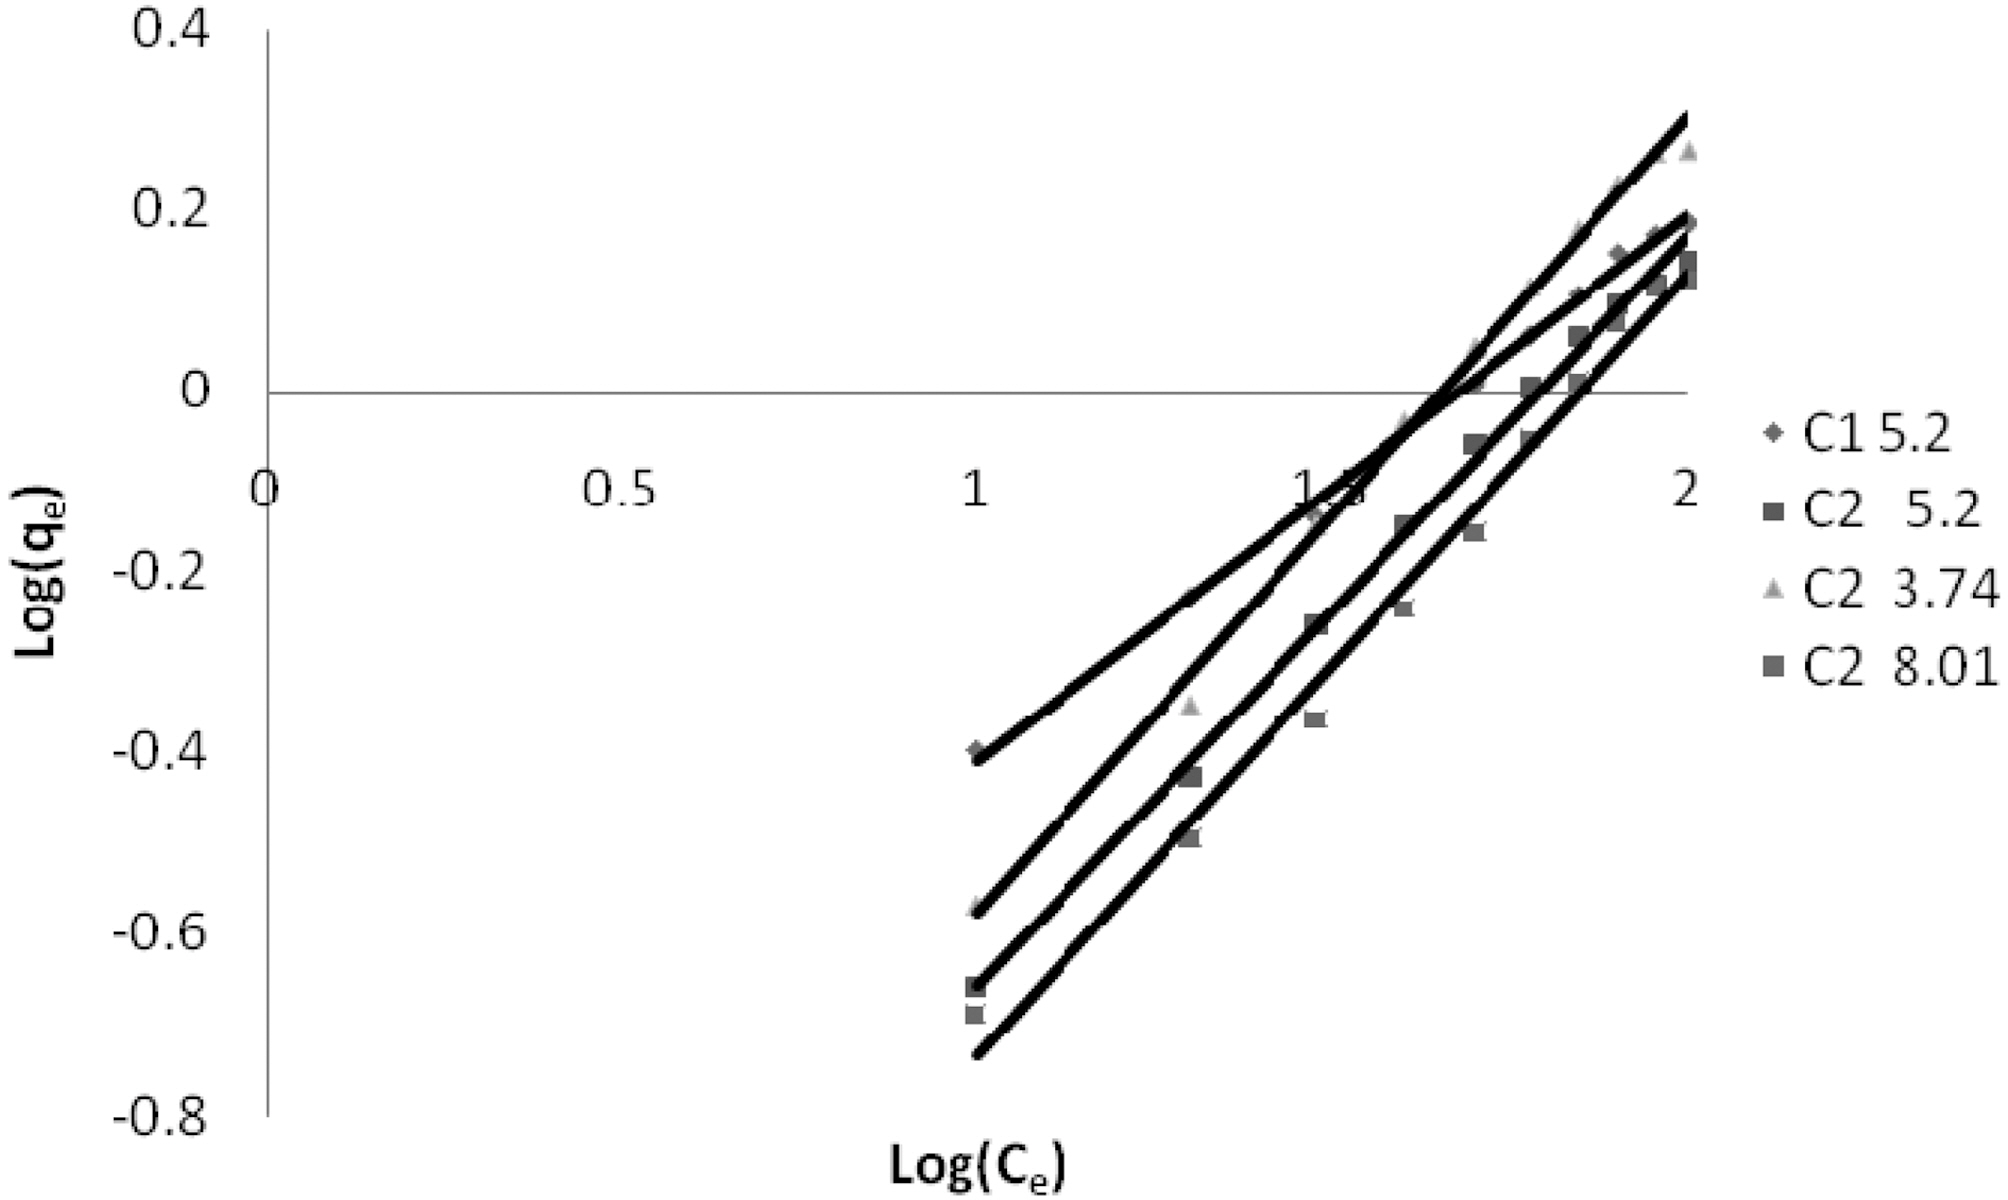
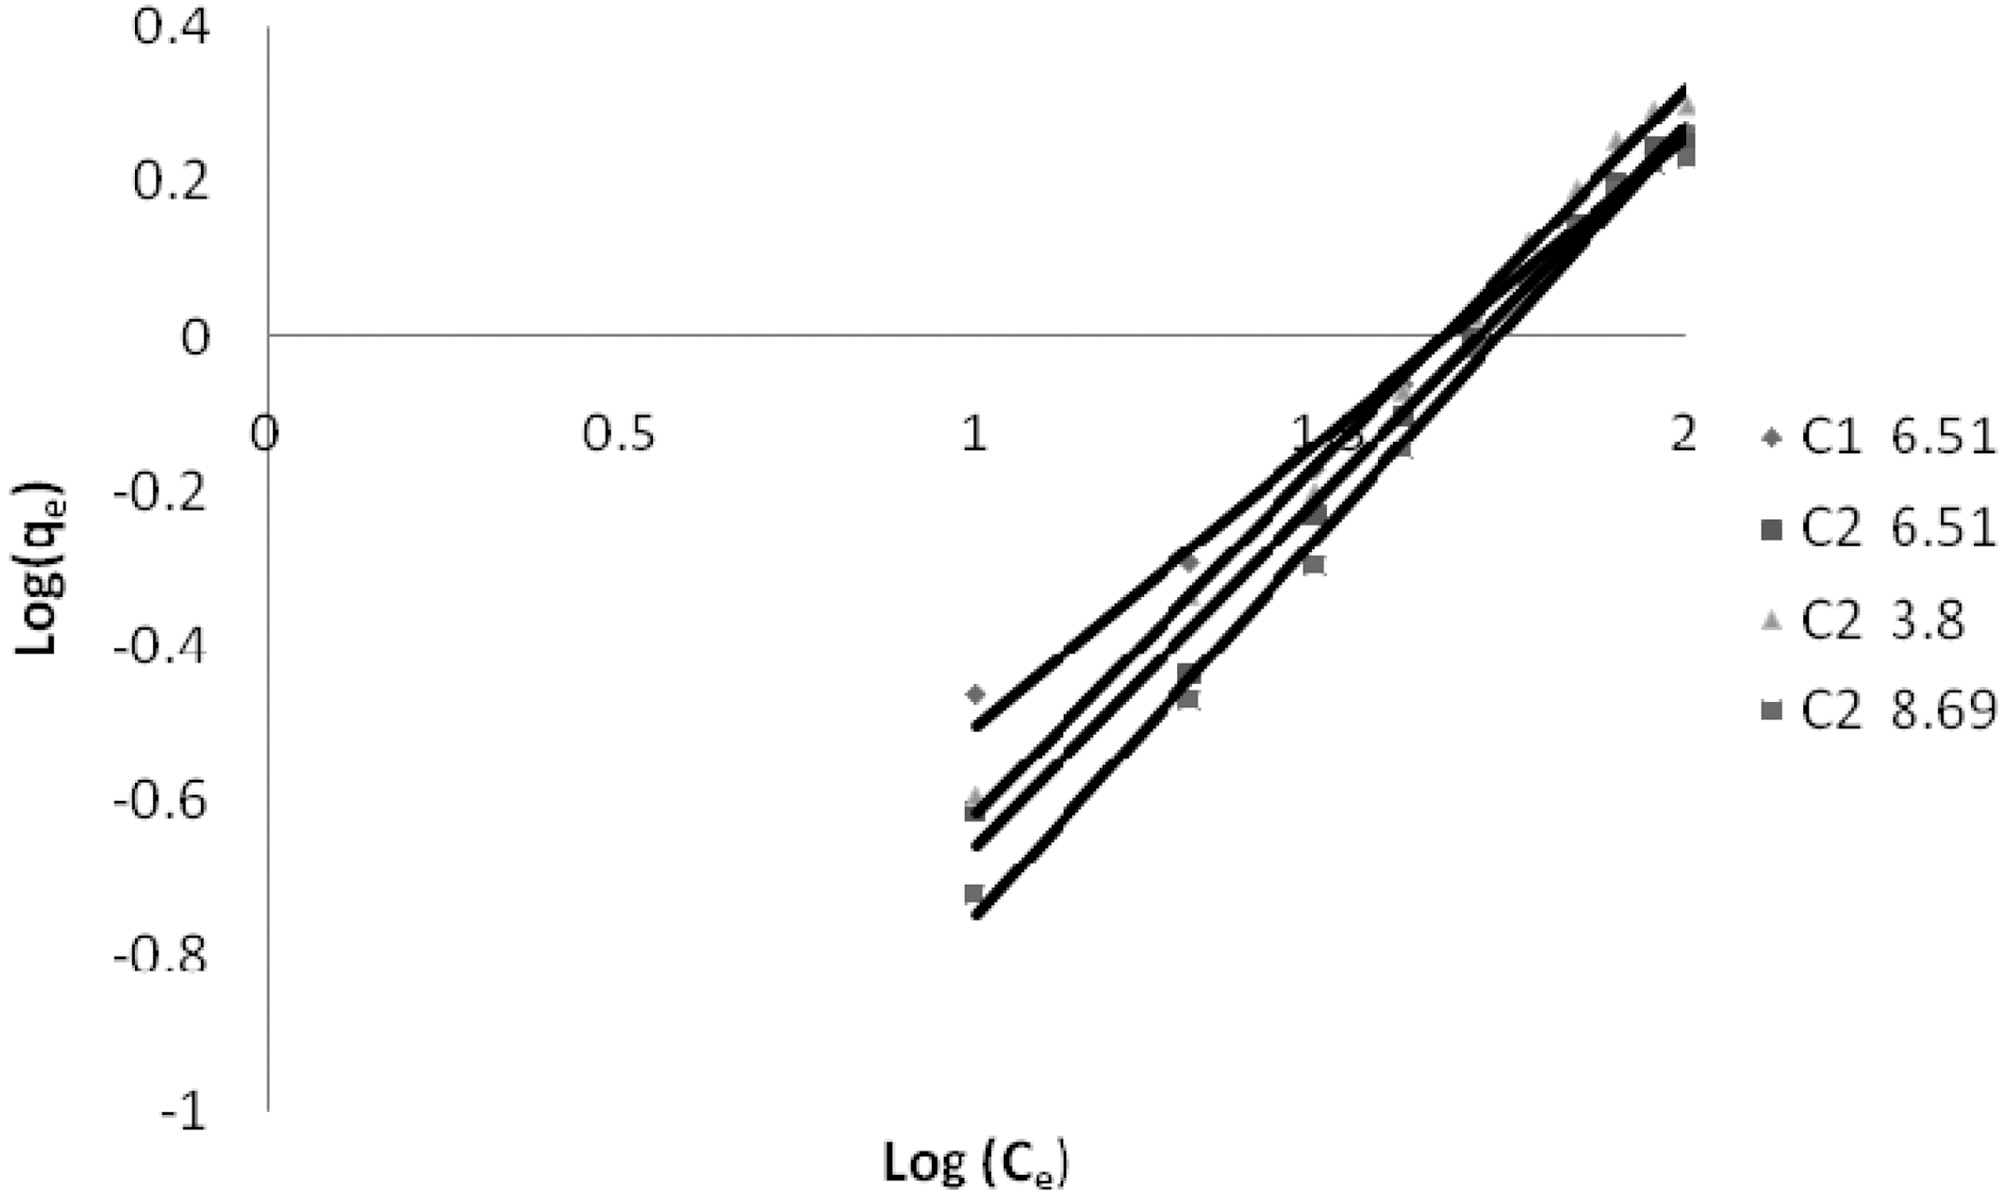
The linear plots of log qe and log Ce for Freundlich isotherm are shown in Figs. 7~9. Table 4 shows the Freundlich constants KF and n calculated from the slope and intercept of log qe and log Ce along with R2 and SD. KF (parameter relative to adsorption capacity) and n (process intensity) were calculated. Values of constant KF indicate higher adsorption capacity on Carbon sample C1 as compared to C2.
Granulated Activated Carbon sample C1 and C2 can be effectively used for the removal of dyes from wastewater by adsorption. The present study shows that there is a decrease in percentage removal of dye of carbon per gram with increase in ppm concentration of the dye. Change in pH values showed higher adsorption at acidic pH. The three dyes obeyed Langmuir and Freundlich isotherms. Langmuir isotherm gave a better fit. Carbon sample C1 showed high adsorption for all the three dyes.