Used in wide range of application sectors, porous carbons including activated carbons in particular are among the most important types of industrial carbons. They are used in various areas such as environmental protection against both gaseous and liquid pollutants, pharmaceuticals, energy production, and domestic appliances, as well as in other consumer-based industries. Each application requires activated carbons of specific characteristics such as surface area, porosity, and pore size distribution. Many novel approaches have been proposed to prepare activated carbons with tailormade porosity. With the polymer blend technique, neither an inorganic catalyst nor an inorganic template is used. The prepared activated carbon is consequently of high purity [1-4] while easy processing conditions simultaneously provide good control over shape and size of the pores.
Among various pollutants present in industrial wastewater, colour is considered to be very important from an asthetic point of view and is recognized as a visible pollutant. Dyes are used as a coloring material by most industries to beautify products. The coloured wastewater arising from such industries, however, poses a serious problem for environmental management. Notably, coloured wastewater can have severe chronic effects on the exposed organisms depending on the exposure time and dye concentration [5]. Dyes absorb and reflect sunlight entering water and can thus interfere with the growth of bacteria and hinder photosynthesis in aquatic plants [6]. Therefore, decolourisation of dyes is an important aspect of wastewater treatment prior to discharge into a water system. Removal of dyes from coloured wastewater is a challenging task, because dyes are not easily degradable and are generally not removed from wastewater by conventional wastewater treatment systems [7]. Some of the notable adsorbent materials used for treatment of coloured wastewater, including wastewater related to dye production, are baggase [8], activated carbon [9-12], biosolids [13], coal fly ash [14], bentonite clay, and neem leaf powder
This is an Open Access article distributed under the terms of the Creative Commons Attribution Non-Commercial License (http://creativecommons.org/licenses/by-nc/3.0/) which permits unrestricted non-commercial use, distribution, and reproduction in any medium, provided the original work is properly cited.
2.1 Preparation of microporous activated carbons
Three microporous activated carbons were used in the present study. Among these, two samples, AC-1 and AC-2, were synthesized by a polymer blend technique. The polymer blend technique involves two polymer components, a carbon precursor polymer component and a pore former polymer component. In this technique, the pore former polymer component is dispersed and stabilized into the matrix of carbon precursor polymer component. Upon subsequent heat treatment, the pore former polymer component is completely decomposed, leaving behind pores and carbon from the carbon precursor polymer component. In the present study, Novolac type phenolic resin was used as the carbon precursor polymer component and polymethyl methacrylate (PMMA) was used as the pore former polymer component. Both polymer components were mixed intimately through a solution route and then dried to a powdered form using a laboratory scale spray drier. Use of a spray drying technique facilitates encapsulation of the phenolic resin with the PMMA component. This technique also provides very good dispersion of the pore former polymer component into the matrix of the carbon precursor polymer component. The spray dried polymer blend sample was then stabilized in an acid solution, neutralized with an aqueous solution of ammonia, and finally washed with distilled water to render it PH neutral. Carbonization of the stabilized samples was carried out at 800℃ under an inert atmosphere at a prescribed heating rate. The carbonized samples were then steam activated to enhance the porosity of the samples.
The third sample, ARY-3, was prepared from viscose rayon yarn by a chemical-physical activation method. Here, viscose rayon yarn was first treated with phosphoric acid at 60℃ and washed with distilled water to make its PH neutral and then carbonized at 800℃ under an inert atmosphere. Finally, the sample was also steam activated to enhance its generated porosity.
Differential scanning calorimetric (DSC) analysis of the spray dried polymer blend samples and stabilized polymer blend samples was carried out using a Mettler DSC 20 (Mettler, Uster,Switzerland) at a heating rate of 10℃/min. to 300℃ in an inert atmosphere. Thermogravimetric analysis of the stabilized polymer blend samples and each polymer component used in the polymer blend technique was carried out using a Mettler TG 50 thermal system (Mettler, Uster, Switzerland) at a heating rate of 10℃/min. in an inert atmosphere to 800℃. Brunauer-Emmett-Teller (BET) surface area of the activated carbon samples was measured by a Micromeritics Gemini 2375 surface area analyzer (Micromeritics, Norcross, GA, USA). The samples were cleaned prior to analysis by heating at 100℃ for 1-2 h and at 300℃ overnight under a continuous flow of argon.
2.3 Adsorption of methylene blue dye on microporous activated carbons
2.3.1 Preparation of methylene blue solution
Methylene blue was chosen for the present study because of its known strong adsorption onto the solids. The dye is not regarded as being acutely toxic but it can have various harmful effects on living organisms. Methylene blue was dried in an oven at 100℃ for 2-3 h before its use. Initially, 500 ppm methylene blue solution was prepared and stored in a dark bottle to prevent degradation of methylene blue in the presence of sunlight and different solutions were prepared from this surrogate solution on requirement.
2.3.2 Batch adsorption experiments
Batch adsorption experiments were carried out by taking a prefixed amount of the activated carbon sample with the methylene blue solution in a 100 mL conical flask and shaking the flask using a rotary shaker for a specific time interval. The concentration of methylene blue both before and after the adsorption study was measured using a UV-visible spectrophotometer (Shimadzu UV-1601; Shimadzu, Kyoto, Japan) at 663 nm wavelength. The effects of contact time, activated carbon dosage, and methylene blue solution concentration on the adsorption of methylene blue on microporous activated carbon were studied.
2.3.3 Effect of contact time
To study the effect of contact time on the adsorption of the methylene blue solution on activated carbon, 25 mL of a 100 ppm dye solution was examined. The activated carbon dosages taken were 2.5, 0.4, and 3.2 mg/L and are designated as AC-1, AC-2, and ARY-3, respectively. Samples were shaken for a predetermined time interval starting from 10 min. until equilibrium was reached.
2.3.4 Effect of activated carbon dosage
The effect of adsorbent dosage for complete decolourisation of 25 mL of 100 ppm methylene blue solution was studied for all three samples, AC-1, AC-2, and ARY-3, by maintaining an optimized contact time of 60 min, 10 min, and 360 min, respectively.
2.3.5 Effect of methylene blue solution concentration
Initially, the adsorption experiments were carried out with 100 ppm methylene blue solution concentration. After optimizing the contact time and activated carbon dosage, additional adsorption experiments were carried out using 25 mL of methylene blue solution with concentration of 200, 300, 400, and 500 ppm, respectively.
3.1 Differential scanning calorimetric analysis
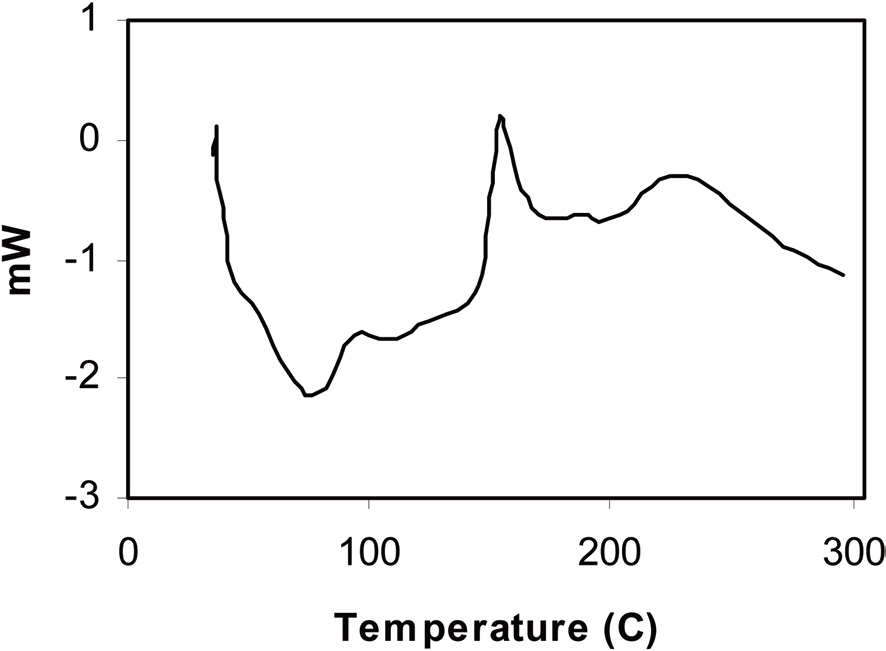
The DSC graph of spray dried polymer blend sample is presented in Fig. 1, which shows two different endothermic peaks at 75℃ and 104C, proving that both polymer components remain phase separated after blending. Complete stabilization of the polymer
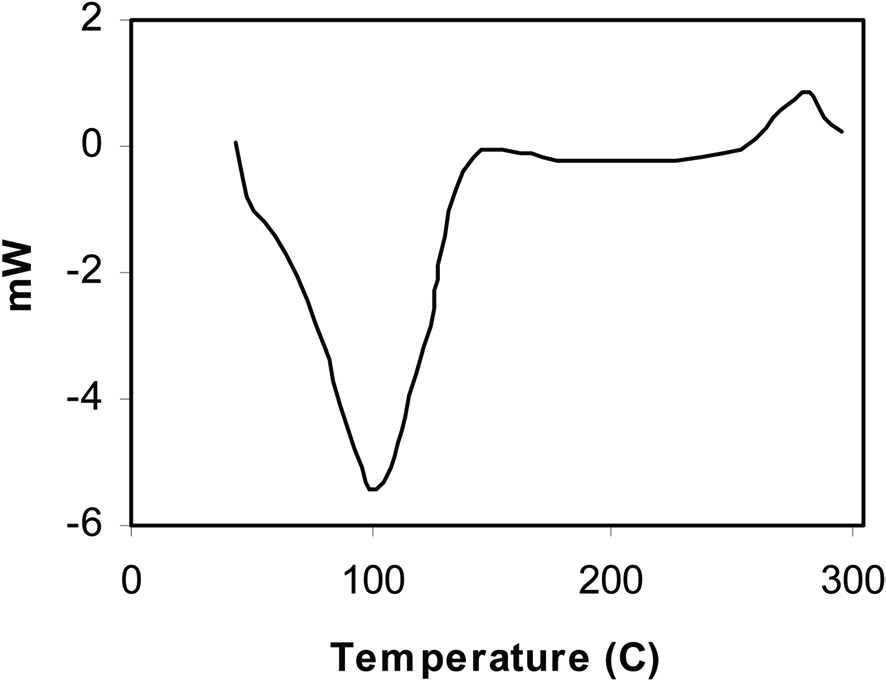
blend sample was also supported by this technique. Here, stabilization only entails curing of the carbon precursor polymer component, which is thermoset in nature. After the thermoset polymer is cured, it does not show any glass transition. The DSC graph of the stabilized polymer blend sample (Fig. 2) shows only a single glass transition peak at 100C, which is the glass transition temperature of the pore former polymer component i.e. PMMA. Hence, we can
[Table 1.] Surface properties of microporous activated carbons samples
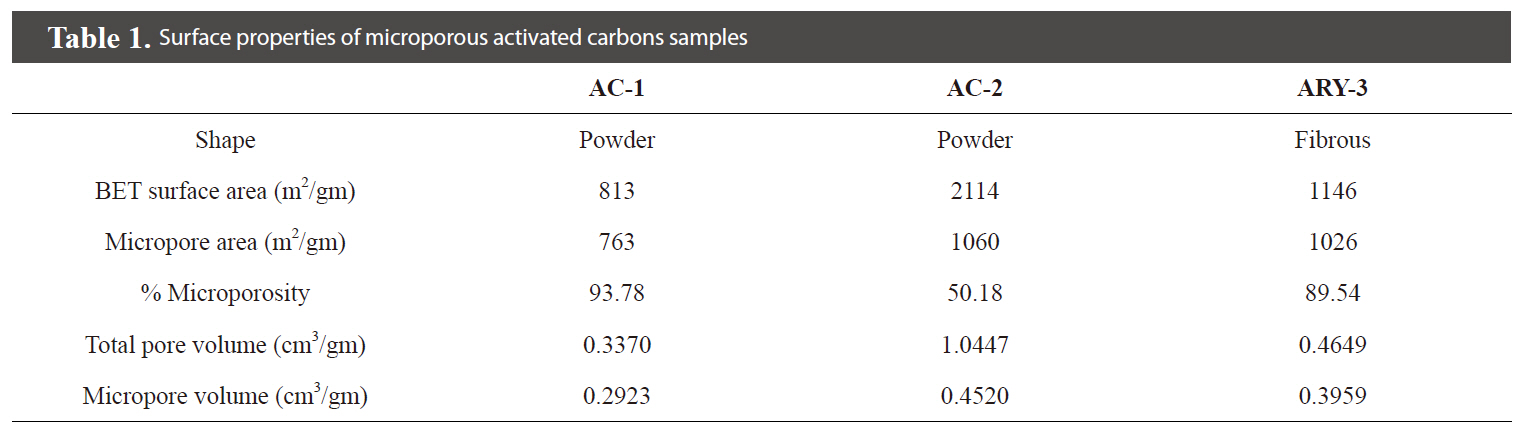
Surface properties of microporous activated carbons samples
conclude that after stabilization, PMMA remains as an individual phase in the matrix of the carbon precursor polymer component.
3.2 Thermogravimetric analysis
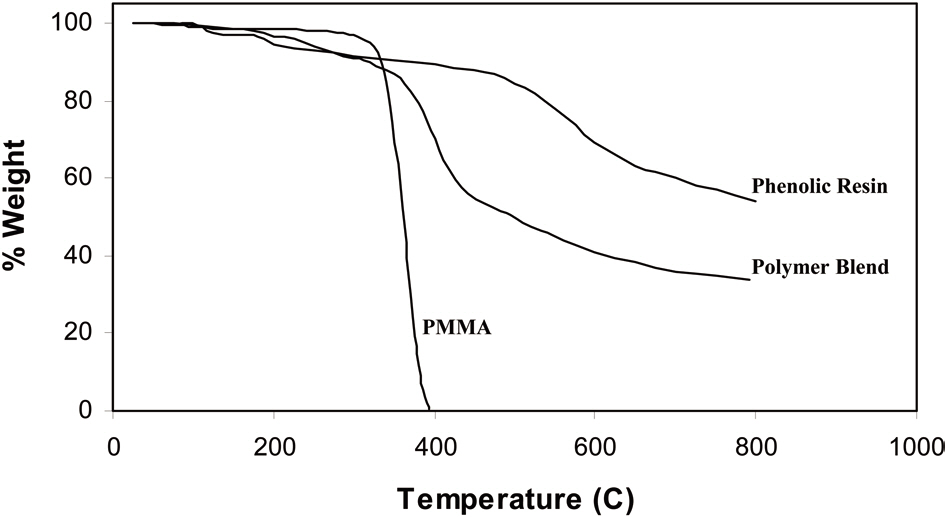
Fig. 3 shows thermograms of PMMA, stabilized phenolic resin, and stabilized polymer blend sample. From the curves, we can conclude that the pore former polymer component PMMA is completely decomposed at 400℃ and the thermogram of phenolic resin indicates that it provides roughly a 52% carbon yield at 800℃. In the thermogram of the stabilized polymer blend sample the steep decrease within a temperature range of 390℃ to 410℃ indicates removal of the lower thermally decomposable component PMMA from the polymer blend sample.
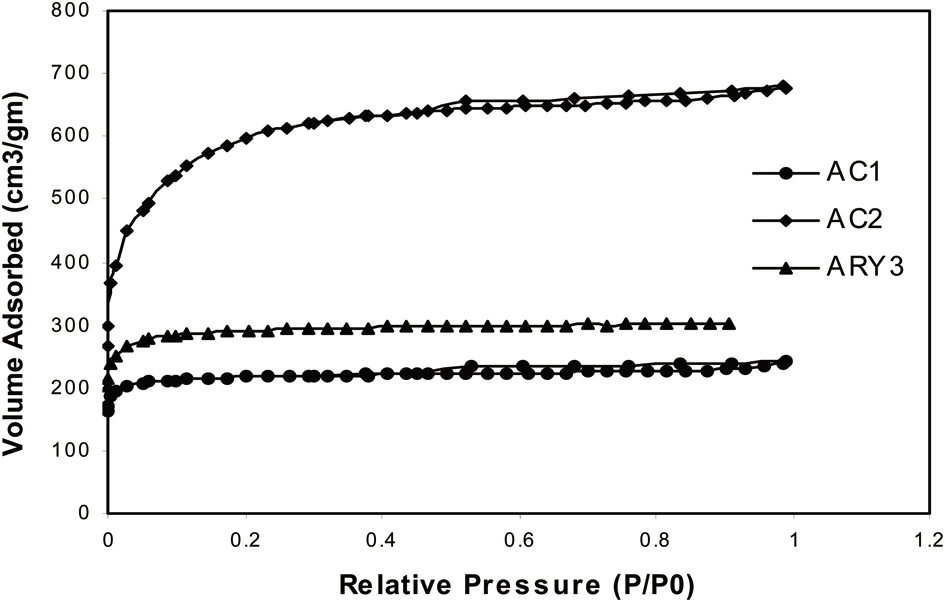
The surface properties of all activated carbon samples are given in Table 1. Fig. 4 shows the nitrogen adsorption isotherm of the prepared activated carbon samples measured at 77 K. The isotherm shows that samples AC-1 and ARY-3 are completely microporous in nature while sample AC-2 shows a hysteresis loop, which indicates that the sample has mixed micro- and mesoporous characteristics.
3.4 Adsorption of methylene blue dye on microporous activated carbons
3.4.1 Effects of contact time and activated carbon dosage

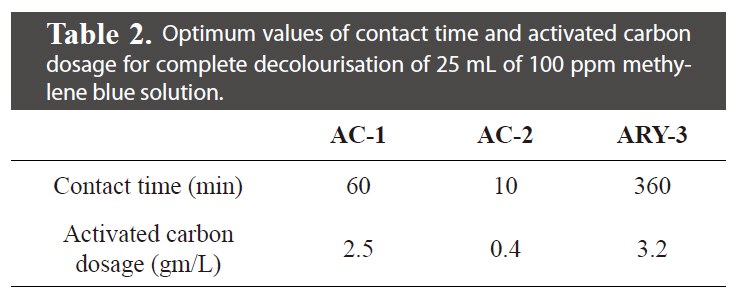
Optimum values of contact time and activated carbon dosage for complete decolourisation of 25 mL of 100 ppm methylene blue solution.
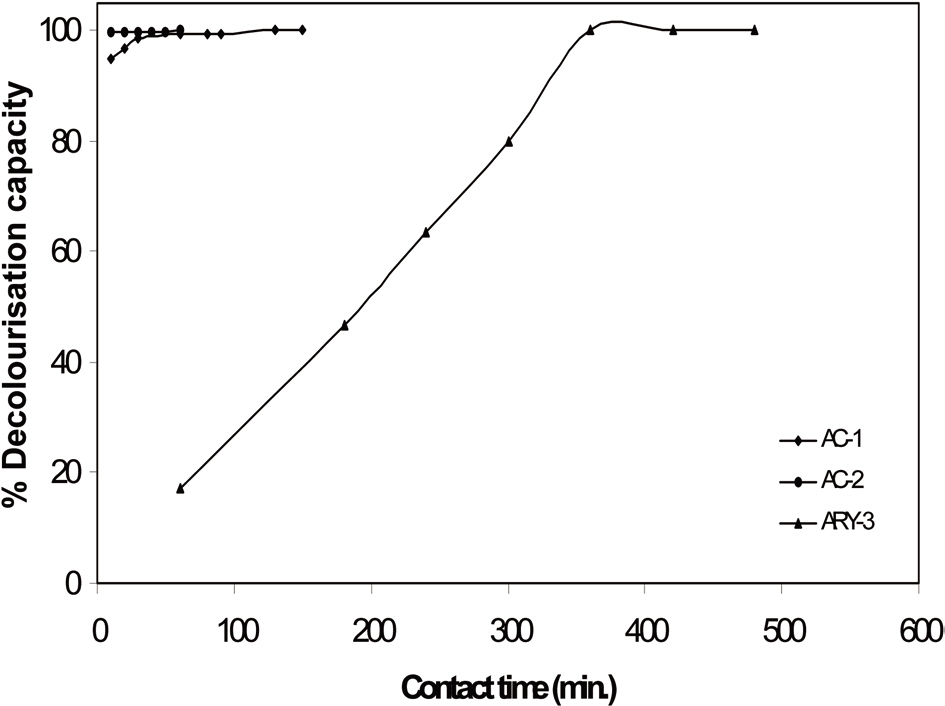
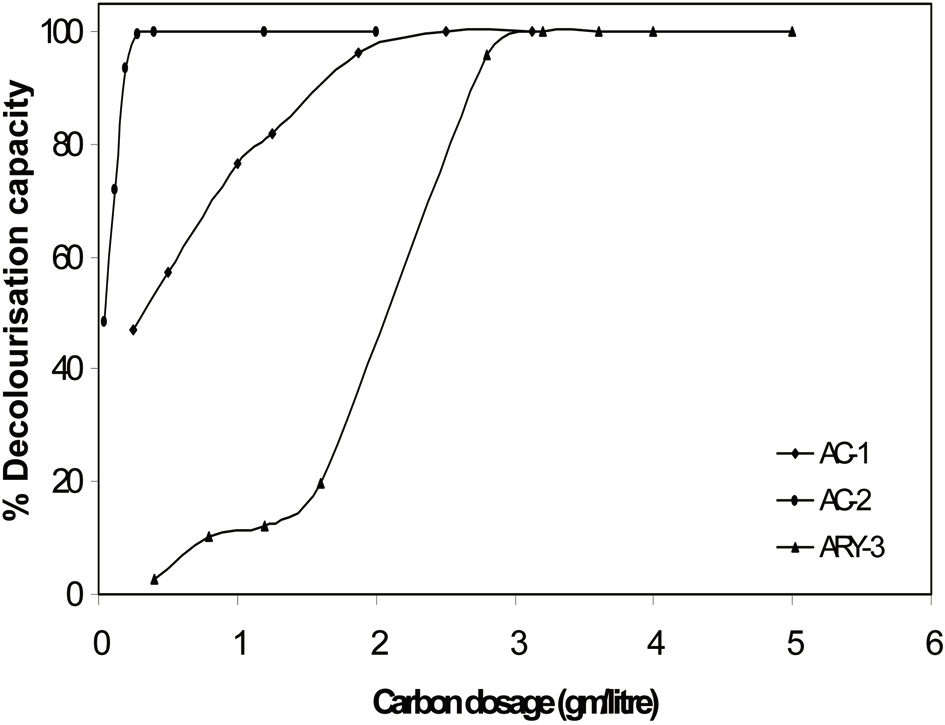
The effect of contact time and activated carbon dosage was investigated with initial 25 mL of 100 ppm methylene blue dye solution. The results of contact time and activated carbon dosage for all three samples are given in Table 2 and graphically represented in Figs. 5 and 6. It can be seen that the extent of decolourisation of methylene blue solution increases with increased contact time and the activated carbon dosage until equilibrium is attained.
3.4.2 Effect of methylene blue solution concentration
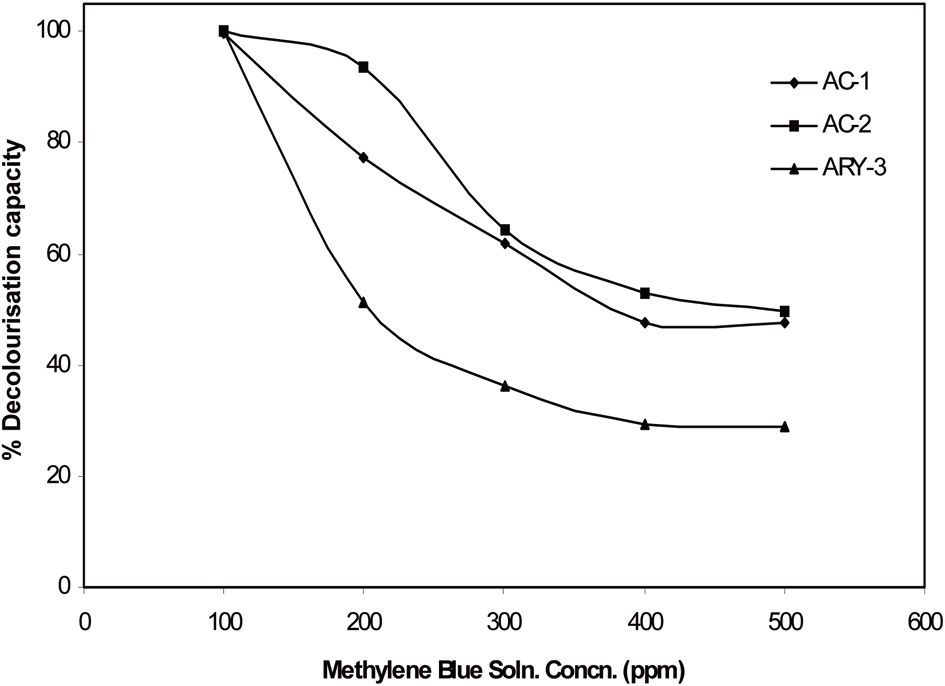
Experiments were carried out with methylene blue solutions of different concentrations of 200, 300, 400, and 500 ppm concentration. For each experiment, 25 mL of methylene blue solution was used. The results are given in Fig. 7. With
an increase of the methylene blue solution concentration, the% decolourisation capacity of activated carbon sample is reduced. The 500 ppm solution concentration samples AC-1 and AC-2 show ~50% decolourisation capacity while the activated rayon yarn sample shows only 29% decolourisation capacity.
3.4.3 Effect of shape and size of the pores
The sample AC-2 having a BET surface area of 2,114 m2/gm and with 50% microporosity shows remarkable decolourisation capacity for methylene blue solution: 0.4 gm/L of activated carbon dosage required only 10 min of contact time for complete decolourisation of 25 mL of 100 ppm methylene blue solution. Sample ARY-3, which is fibrous in shape and has BET surface area of 1146 m2/gm and ~89% microporosity, requires 3.2 gm/L activated carbon dosage and 360 min.contact time for decolourisation of 25 mL of 100 ppm methylene blue solution. Sample AC-1, having BET surface area of 813 m2/gm and 93% microporosity, shows good decolourisation capacity with 60 min contact time and 2.5 gm/L activated carbon dosage.
The pore and pore size distribution are very important in adsorption science. In the present study, two samples AC-1 and ARY-3 have similar microporosity of ~90%. One of the samples is activated rayon yarn (ARY-3), which has slit shaped pores, while the powdered activated carbon sample (AC-1) has channel-like porosity. It appears that methylene blue molecules having molecular dimensions of 1.43 nm ×0.61 nm × 0.4 nm [9] cannot diffuse freely in the ARY-3 sample as compared to the powder sample AC-1. Samples AC-1 and AC-2 have 93% and 50% microporosity, respectively. Thus, sample AC-2 has only 50% microporosity and the remaining porosity is mesoporosity. The presence of mesopores in this sample also contributes to the decolourisation capacity for methylene blue.
The microporous activated carbon can be considered to be a very good adsorbing material for decolourisation of methylene blue dye aqueous solutions. Activated carbon samples prepared by a polymer blend technique show comparatively good decolourisation capacity for methylene blue dye solutions than activated rayon yarn prepared by a chemical activation method. It appears that activated carbon having mixed micro- and mesoporosity show tremendous decolourisation capacity for methylene blue. In the case of the activated rayon yarn sample, the decolourisation capacity can be increased by incorporation of mesopores along with the micropores. For higher concentrations of methylene blue dye solution, the decolourisation capacity of all three activated carbon samples can be increased by increasing either the contact time or the activated carbon dosage.