Due to their high porous nature and adsorption capabilities, activated carbon fibers (ACFs) are widely used in catalytic purification and separation processes [1-3]. They are usually prepared from general purpose CFs, especially from isotropic pitches, and they typically undergo an activation process to utilize the pores of their isotropically connected network [4-8].
CFs are mostly produced by conventional spinning methods such as melt-blown [9] and melt-spinning [10] process, both of which result in a relatively thick fiber diameter of 10-15 ㎛ with low compressive strength. ACFs prepared from such conventional CFs are inadequate for quick adsorption-desorption purposes due to the long channels of deep pores on their surfaces. When they are used as an electrode on an electrical double-layer capacitor, the surface that forms in the thick fiber of the electrode is limited in terms of efficient use due to the long transfer distance of the ions at a high current rate.
Recently, an electrospinning technique was applied for the production of a nonwoven web consisting of fibers with a reduced fiber diameter in the micro to nano range, resulting in a high specific surface [11-19]. Park et al. [15] reported the preparation method of pitch-based CFs through electrospinning in a study that represented the initiation of pitch-based electrospun fibers. In a continuation of this work, Yang et al.[19] reported the properties of pitch-based carbon fibers created from an electrospinning process.
The present study investigates the effects of the molecular structure of two different types of pitches on the electrospinning, stabilization, carbonization and activation characteristics.
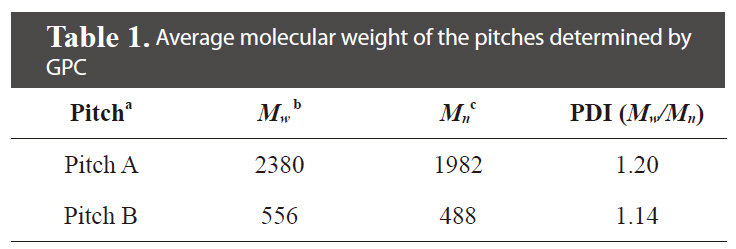
The pitch precursors (PPs) were provided through condensation of pyrolyzed fuel oil (PFO) with Cl2 by Hanwha Chemical Co. Korea (Pitch A) and Anshan East Asia Carbon Fiber Co., China (Pitch B). The PFO used as the raw material is a heavy residual oil produced as a by-product from naphtha cracking. The properties of the Pitch A and B precursors used here are summarized in Table 1. The average molecular weight of the tetrahydrofuran (THF)-soluble fraction of Pitch A was Mw 2380 (as determined by gel permeation chromatography), which was 4 times larger than that of Pitch B.
[Table 1.] Average molecular weight of the pitches determined by GPC

Average molecular weight of the pitches determined by GPC
PP solutions were prepared by dissolving specific concentrations of pitches in THF. The degree of spinnability was evaluated by means of the electrical conductivity and the viscosity of the precursor solutions. The solution conductivity was measured by the ino-LAB analyzer, and the viscosity of the solutions was measured using a viscometer by Brookfield (LVDVII+, Stoughton, MA, USA).
The solutions selected were successfully electrospun into fiber webs using an electrospinning apparatus equipped with a power supply (NT-PS-35K, NTSEE Co., Korea). A positive electrode was connected to the spinneret of a syringe needle(inside diameter = 0.88 mm), and a negative electrode was connected to the drum winder to collect the web that was produced.The spinning was performed at a rate of 3 mlh-1 as regulated by a syringe pump (KDS 100; Cole-Parmer, USA), with a tipto-collector distance of 10 cm, a power level of 25 kV and at a temperature of about 10℃.
2.4 Carbonization and activation
The electrospun (E-spun) fibers from Pitch A and Pitch B with 40 wt% pitch in THF solutions were stabilized in air and then carbonized in an inert atmosphere of N2 gas. The as electrospun fiber webs were oxidatively stabilized in air by heating them to 300℃ at a heating rate of 1℃/min and a holding time of 1 h. The stabilized fiber webs were carbonized by heating them to 1000℃ at 5℃/min and holding them at this temperature for 1 h under an N2 inert atmosphere, with subsequent activation in steam/N2 mixtures (4:6) at 700, 800, and 900℃ for 1 h (heating rate: 10℃/min-1) using an electrical furnace. The activated fibers obtained under the different conditions are designated as Pitch A-ACFs and Pitch B-ACFs.
The solubility levels of both pitch types were determined from solvent extractions in solvents obtained by Soxhlet extraction in an order of increasing solvent power, in this case hexane, toluene and pyridine. The hexane-insoluble, toluene-soluble, toluene-insoluble pyridine-soluble and pyridine-insoluble portions of the PP were calculated from the weight differences before and after dissolving out each soluble fraction in each solvent.
The functional groups of both pitches were characterized using a Fourier transform infrared (FT-IR) spectrometer (Nicolet 520P; USA) with samples dispersed in KBr pellets. The contents of C, H and N in a sample were determined using an elemental analyzer (EA 1110; CE Instruments, Italy), and the O content was calculated by subtracting the sum of C, H, and N (%) from 100. 13C MAS NMR (magic-angle spinning nuclear magnetic resonance) spectra were recorded on an FT-NMR spectrometer (Varian, Unity Solid Inova WB 200 MHz System) at a spinning rate of 5 kHz. The operating 13C frequency was 50.369 MHz with a 90° pulse length of 3 μs. Chemical shifts of 13C were referenced to tetramethylsilane. 1H MAS NMR spectra were recorded in 4 mm rotors at 400 MHz on a Bruker DRX-400 spectrometer fitted with a MAS probe at 14 kHz.
Thermogravimetric analysis (TGA 1640; Santon Redcroft, Canada) was performed to determine the carbon yield or determine the optimum stabilization condition. The stabilized fiber webs were analyzed via differential scanning calorimetry (DSC) using a Mettler DSC-30 Model on 5-10 mg samples in aluminum pans at a heating rate of 10℃/min under nitrogen. The morphology of the E-spun pitch fiber webs were examined by Field emission scanning electron microscope (FE-SEM, S-4700; Hitachi, Japan). The electrical conductivities of the webs were measured by the four-point method (3387-11; Kotronix, Japan).
The carbonized fiber webs were activated in a steam/N2 mixture(4:6) at 700, 800, and 900℃ for 1 h at 10℃ min-1 using an electrical furnace. The percent burn-offs were calculated from careful measurement of the mass before and after the activation. The specific surface area and pore size distributions of the activated CFs were measured using an ASAP device (2010; Micromeritics,USA) through N2 adsorption at 77 K in a relative pressure (P/Po) range of 10-6 to 1. The samples were prepared by degassing at 300℃ for 2 h. The results were evaluated using the Brunauer-Emmett-Teller (BET) equations. The micro-pore (MP) and meso-pore volume distributions were calculated on the basis of the Horvath-Kawazoe and Barret-Joyner-Halenda (BJH) method and via MP plots, respectively.
3.1 Characteristics of the precursor pitches
Some of the properties of the two different types of pitches
[Table 2.] Some characteristics of the isotropic pitches
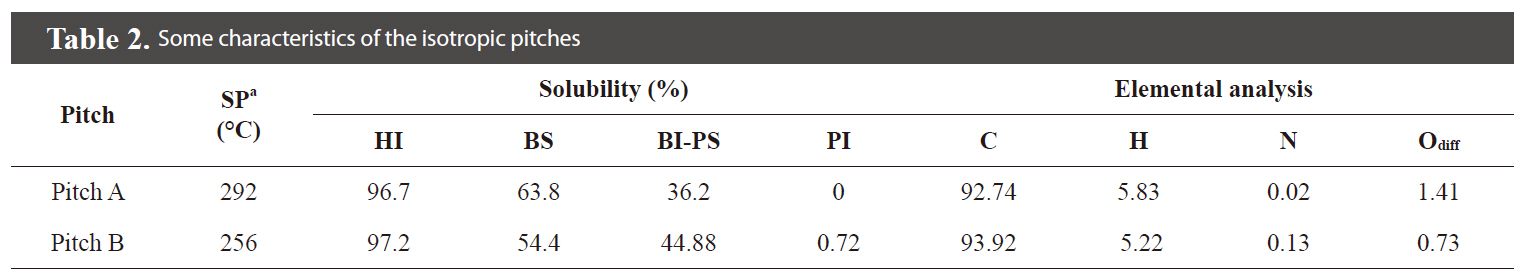
Some characteristics of the isotropic pitches
are summarized in Table 2. The data show that the solubility of the Pitch A was higher than that of Pitch B in spite of its higher molecular weight due to the higher content of hydrogen from the more aliphatic molecular structure.
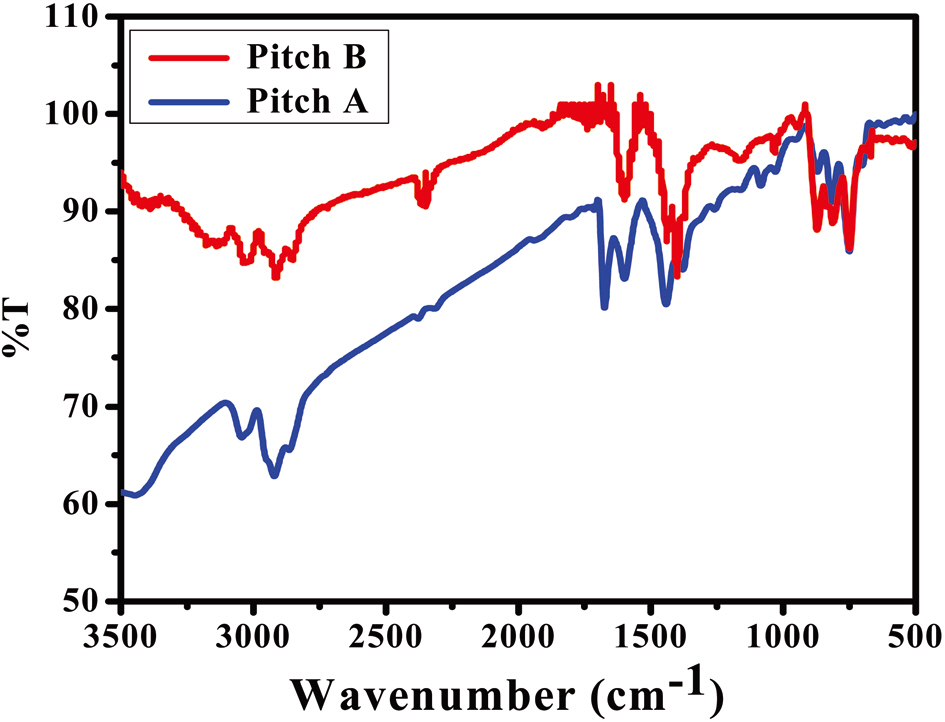
Fig. 1 shows the FT-IR spectra of Pitch A and Pitch B. The profiles of both sample precursors contain mostly the same functional
groups, as noted by observing the following regions of interest: the aromatic C-H stretching modes of 3100-3000 cm-1; the aliphatic C-H stretching modes of 3000-2700 cm-1; and the aromatic C-H out-of-plane bending bonds of 900-700 cm-1[20,21]. Some broad weak bands centered at 3400 cm-1 ascribe to the presence of hydrogen-bonded N-H groups as well as to the strong OH stretching modes of water [22]. The peaks shown in both PPs represent the same functional groups, with the only difference being the presence of more alkyl groups in Pitch A as compared to Pitch B, which can be further confirmed by a NMR analysis.
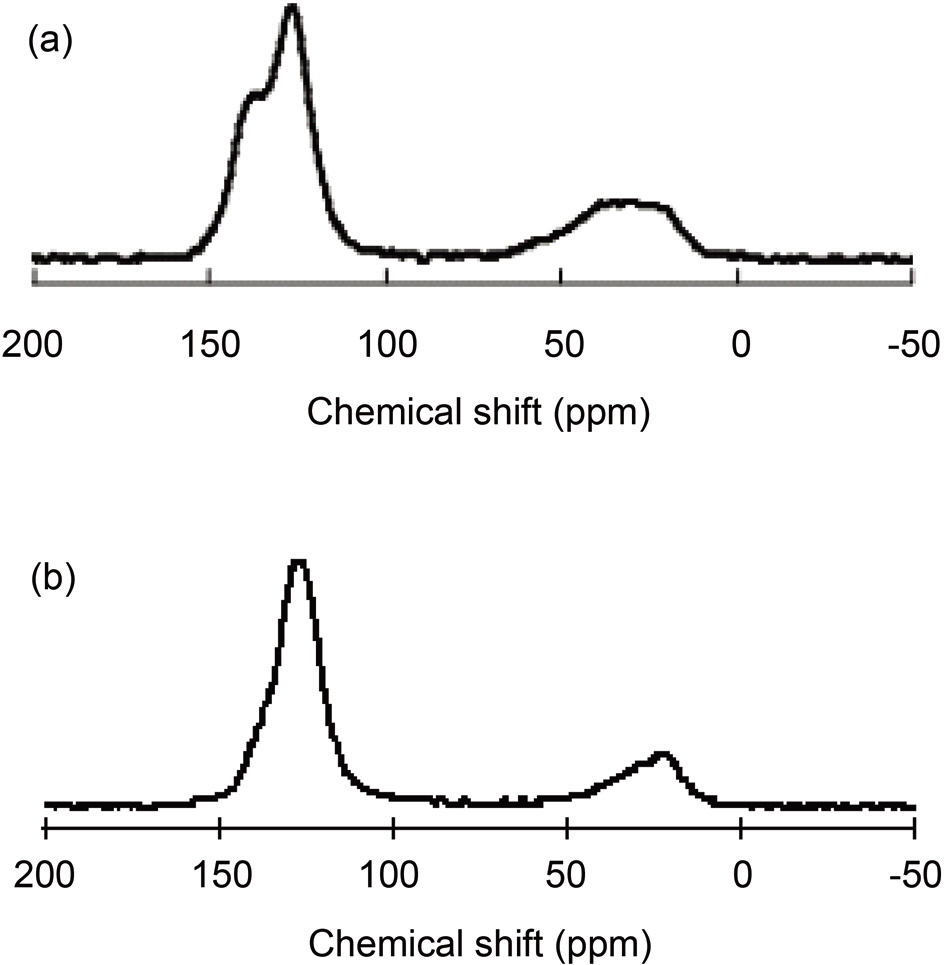
Pitches are complex mixtures of polycyclic aromatic hydrocarbons, and the heterocyclic analogues of their molecular weights range from 200 to more than 2000 [23,24]. Average structural parameters are obtained from 13C and 1H NMR spectroscopy together with elemental analyses [25]. The solid 13C NMR spectra of the PPs are shown in Figs. 2a and b. For both precursors, broad peaks were observed at 0~50 and 100~150 ppm, which were indicative in both cases of aliphatic and aromatic carbons, respectively [22,26]. The spectra represent the existence of quaternary carbon in the aromatic region and methyl carbon in the aliphatic region [27]. Pitch A shows two
separate peaks in aromatic range of 100-150 ppm, as opposed to Pitch B, which shows a single peak in this range. Fig. 2a shows the presence of carbonyl carbon in Pitch A at 155 ppm, which is clearly not present in the spectrum of Pitch B [27]. More aliphatic carbons exist in Pitch A than in Pitch B, as indicated by larger area in the range of 0-50 ppm for the spectrum in Fig. 2a as compared to the spectrum in Fig. 2b.
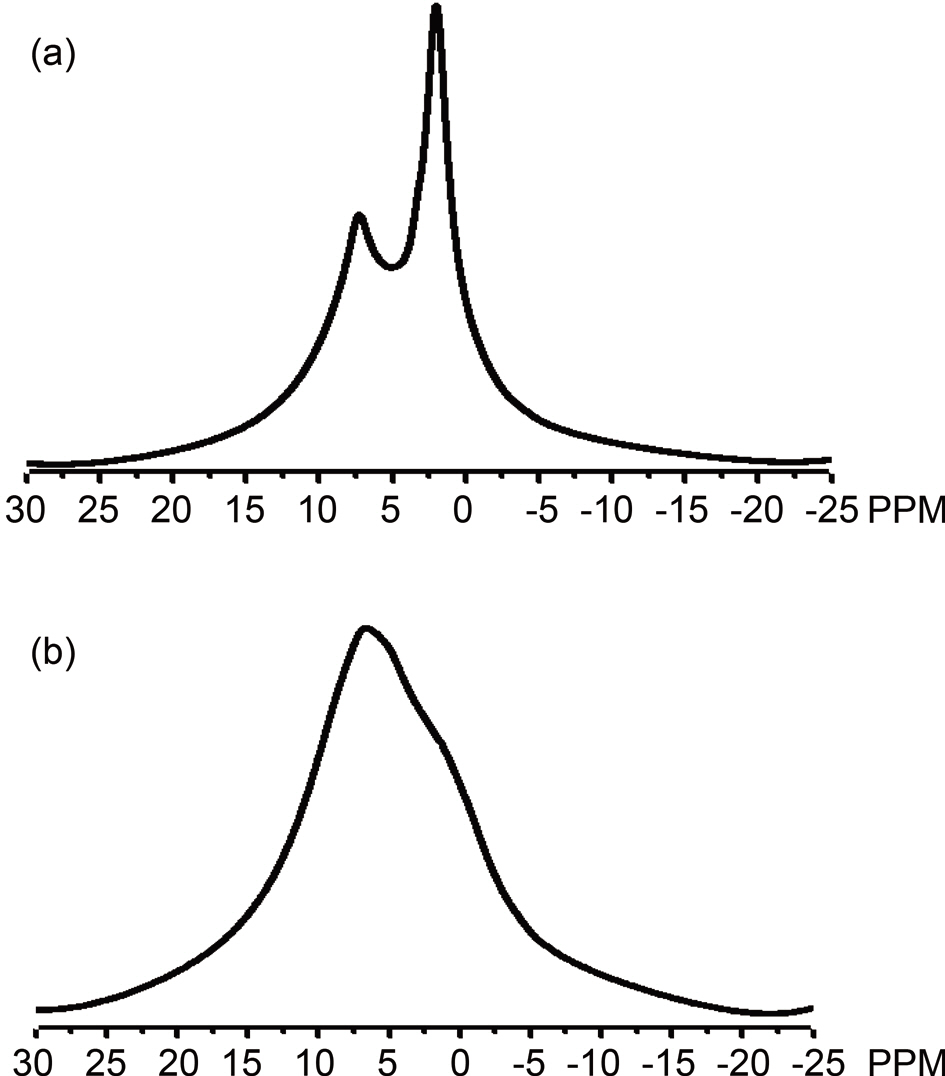
The 1H NMR spectroscopy (Fig. 3a) of Pitch A depicts two separate sharp bands; one for the aromatic portion (5~10 ppm) of lower intensity, and the other for the aliphatic methyl hydrogens (0-5 ppm) of higher intensity. In contrast, in Fig. 3b, the spectrum for Pitch B shows a very broad band overlapped at 0~10 ppm, representing an opposite shape compared to Pitch A,thus indicating higher aromaticity for Pitch B.
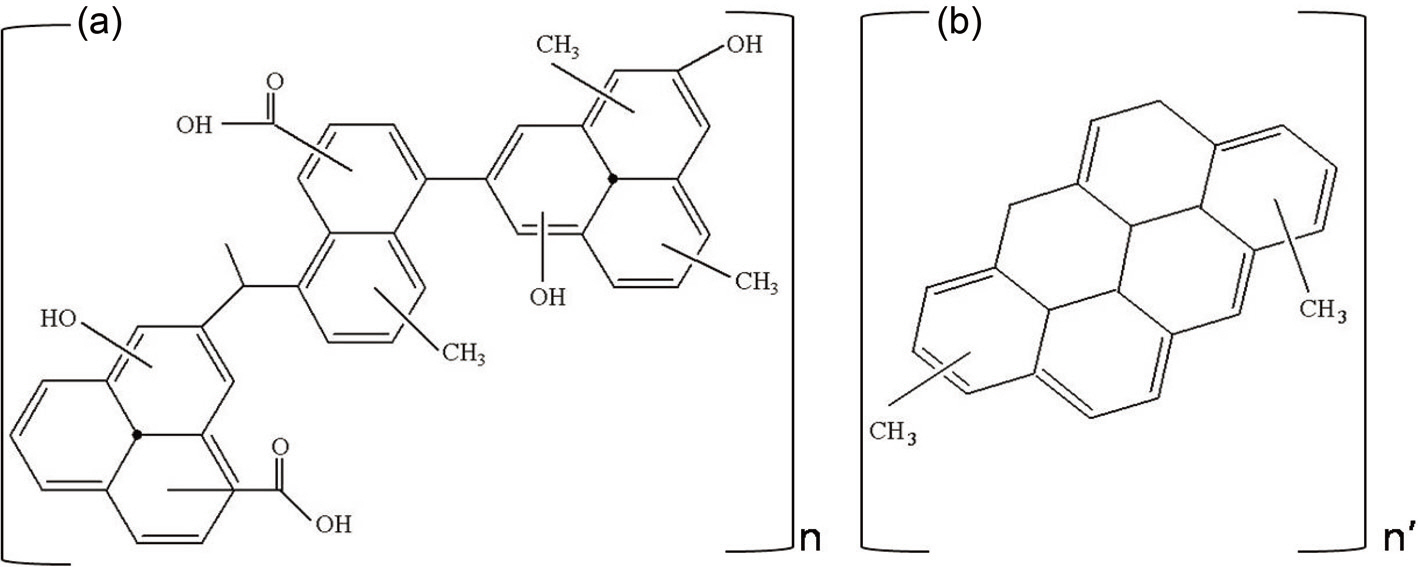
Based on the FT-IR and NMR data, possible representative average structures can be constructed for the two pitches, as shown in Fig. 4. The major differences between Pitch A and Pitch B are as follows: a much higher content of aliphatic methyl and hydroxyl groups present in Pitch A. Pitch A would have Ca. 3 repeating units of the average molecular structure on the basis of the molecular weight of 2380 of Pitch A, as shown in Table 1. On the other hand, only 2 repeating units of the molecular structure are apparent for the Pitch B due to its low molecular weight from the lower solubility in THF.
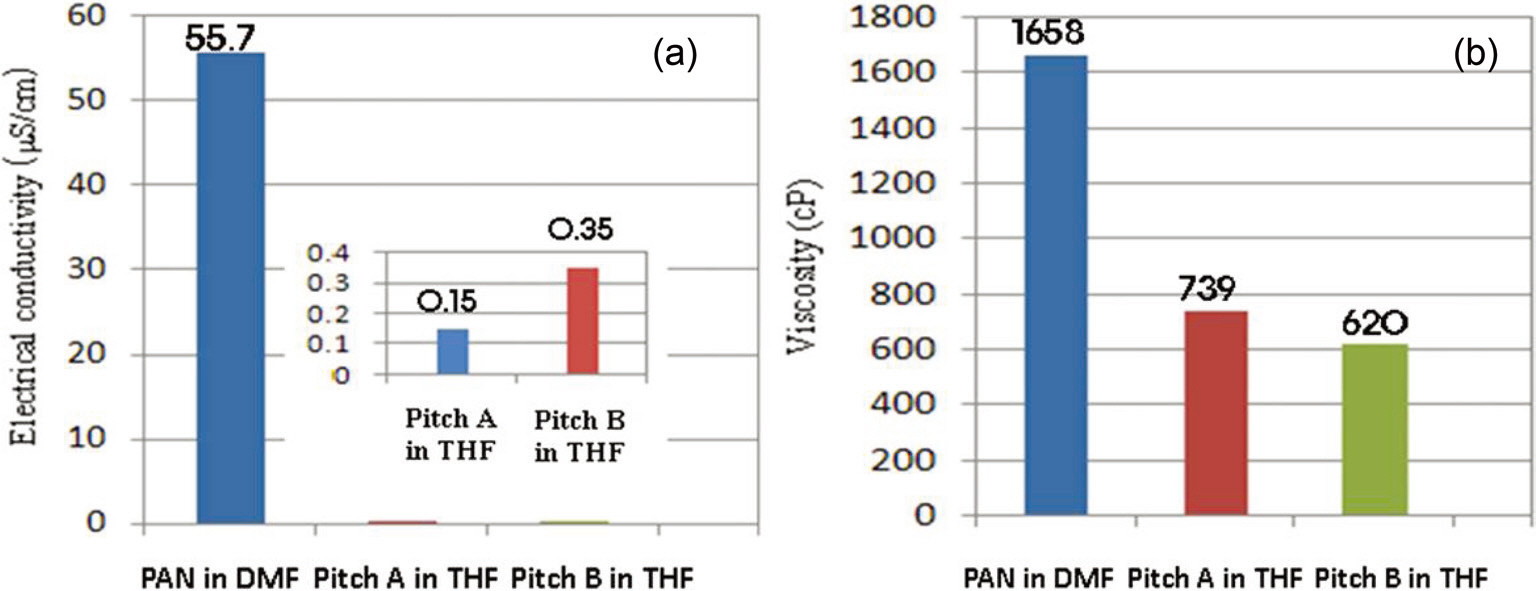
The solution properties are shown in Fig. 5. The electrical conductivity and viscosity of Pitch A are 0.15 μS/cm and 739 cP, respectively, while the respective values for Pitch B are 0.35 μS/cm and 629 cP. The higher viscosity value of Pitch A results in better spinnability for it compared to Pitch B. Previous research shows that an increase in the electrical conductivity of a solution would enhance the net charge density and thus decreases the fiber diameter [28]. 40 wt% of the pitches is considered to be a high enough concentration to result in sufficient spinnability. At less than 30 wt% of the PPs, the solution viscosity was too low to obtain good spinnability due to the relatively low value of the material parameters, i.e., the surface tension (σ) viscosity(η) [15].
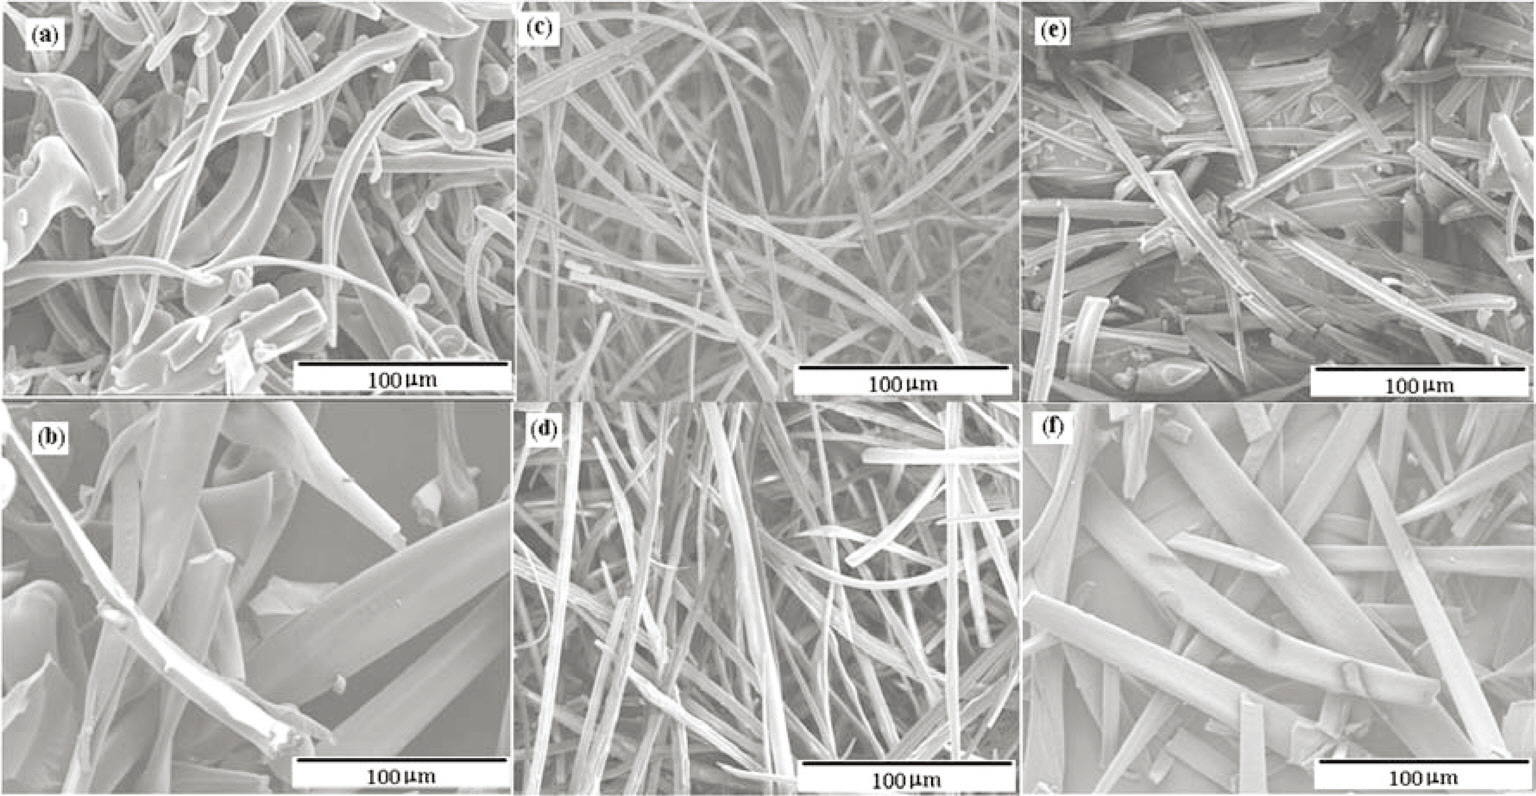
Thirty five, 40, and 45 wt% Pitch A and Pitch B solutions in THF were electrospun into pitch fibers by applying the same procedure reported by Park et al. [15,19]. At concentration of 35 wt%, the solutions were electrospun into non-uniform fibers, as shown in Figs. 6a and b; they were not viscous enough to be spun into fibers due to the high material parameters. The 40 wt% solutions improved in terms of uniformity, as shown in Figs. 6c and d; upon a further increase in the concentration to 45 wt%, the uniformity was reduced and the resulting fibers were thicker and shorter, as shown in Figs. 6e and f. It is known that the spinnability of a pitch solution with high surface tension can be enhanced by reducing the surface energy and increasing the viscosity of the solution [15].
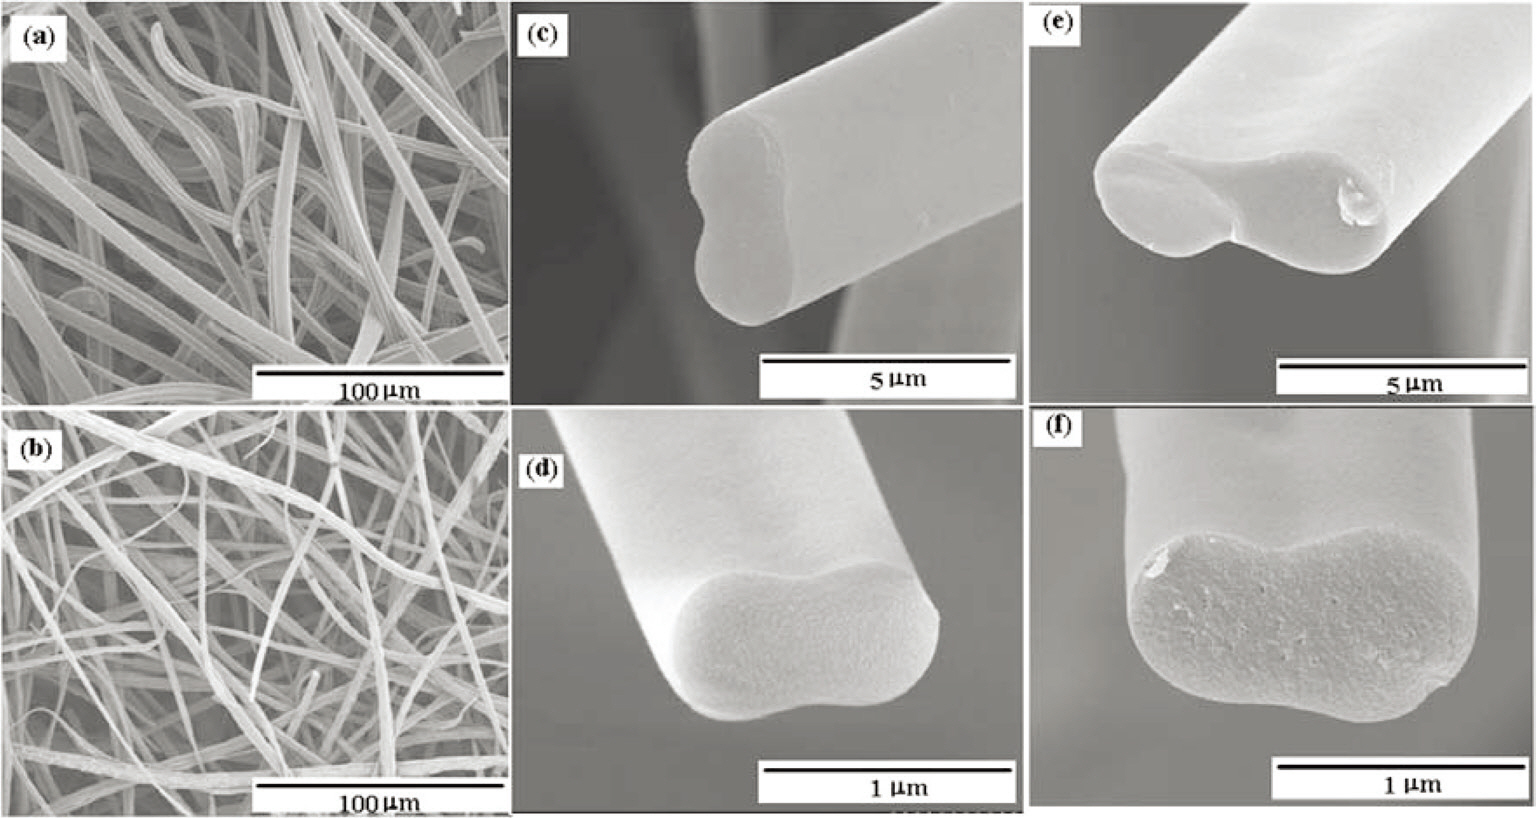
SEM photographs of the carbonized fibers are shown in Fig. 7. In this figure, fibers with diameters of 2-6 ㎛ and 3-7 ㎛ were randomly layered in the form of a web, as shown in Figs. 7a and b. The 45 wt% pitch in the THF solutions did not lead to uniform fibers due to its exceedingly high viscosity, which prevented it from being stretched into thin fibers.
The fibers are ribbon-like and their cross-sections have cocoon-like shapes, as shown in Figs. 7c-f. The 40 wt% pitch solutions were attenuated efficiently with the correct combinations of surface tension and viscosity under the spinning conditions [19]. They exhibited dumbbell like shapes due to the incomplete splitting of the jets under electrostatic force. Above a pitch concentration of 40 wt%, the attenuation of the jets was considered to be unfeasible due to the high solution viscosity, which is explained by the cohesive-brittle fracture mechanism [25], and the surface charge is considered to have much less energy than required to split the jets given their circular shape. Koombhongse et al. [14] also reported that these types of fibers could be formed by solvent evaporation followed by flattening.
Pitch A showed better spinnability in terms of the regular shape of the fibers as compared to Pitch B. The dumbbell shape of these fibers can be advantageous for reinforcing the composites by introducing a cramp effect in the matrix with reinforcing fibers along the direction of the cross sections.
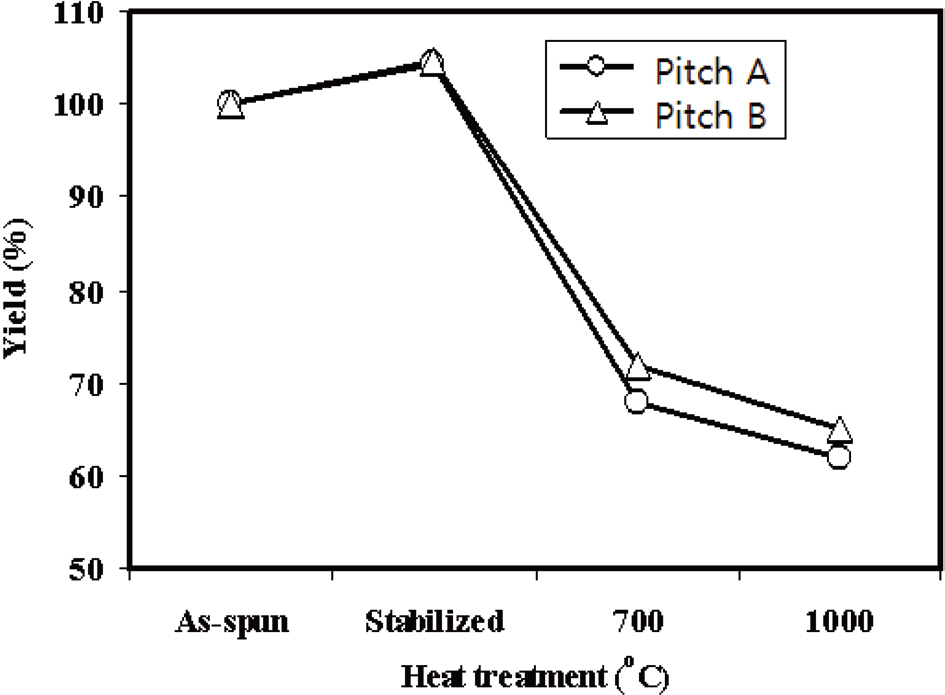
Fig. 8 shows the yield of the Pitch A and Pitch B E-spun fiber webs with the heat treatment temperatures used in the carbonization process. The weight increased by 4.3% and 4.5% for Pitch A and Pitch B, respectively, due to the uptake of oxygen during stabilization. It then rapidly decreased with the subsequent thermal treatments at higher temperatures due to the evolution of volatile matter and hetero-atoms. The carbon yield was slowly decreased above 700℃, reaching 62% and
65% at 1000℃ for the Pitch A and Pitch B fibers, respectively. Moreover, the yield of the Pitch A E-spun fibers was 3% less than that of the Pitch B E-spun fibers, resulting in a higher carbonization yield from the pitch with higher aromaticity.
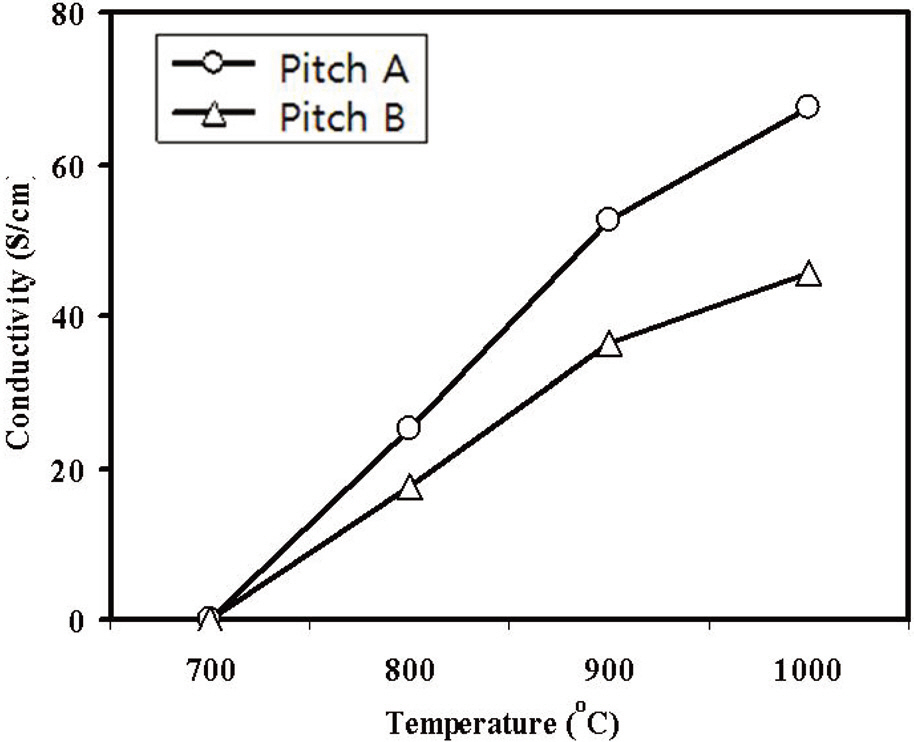
Fig. 9 shows the electrical conductivities of the carbonized webs with an increase in the carbonization temperature. The Pitch A carbonized fiber web had higher electrical conductivity than the Pitch B fiber.
3.4 Thermogravimetric analysis
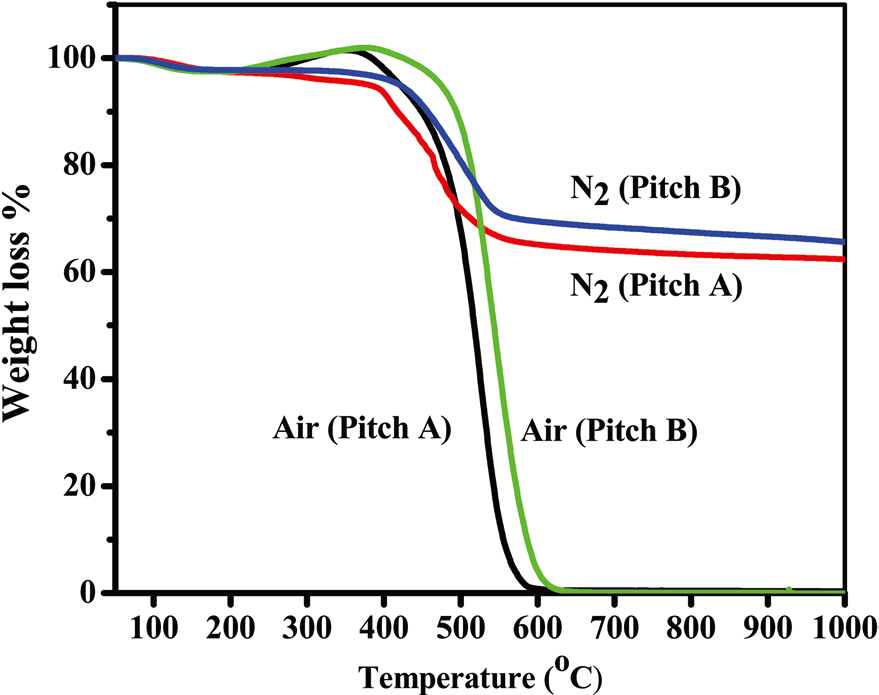
The thermal behaviors of both types of pitch fibers under air and nitrogen atmospheres are shown in Figs. 10a and b, which provide the desired processing conditions for stabilization and carbonization, respectively. For both of the precursors, oxygen uptake started at 220℃, with combustion starting at 450℃. Earlier combustion by 16℃ was observed in the Pitch A fiber compared to Pitch B fiber. Similarly, under a nitrogen atmosphere, Pitch A fibers started to lose weight at a lower temperature by
40℃, resulting in a lower carbonization yield of 62%, by 3%, compared to the Pitch B fibers above 600℃. The optimum stabilization temperature is considered to be 220-320℃. Under a nitrogen atmosphere, weight loss started at 200℃ and was nearly constant above 600℃, at 62% and 65% for Pitch A and Pitch B, respectively, which are higher carbon yields than polyacrylonitrile based fibers under the same conditions [18].
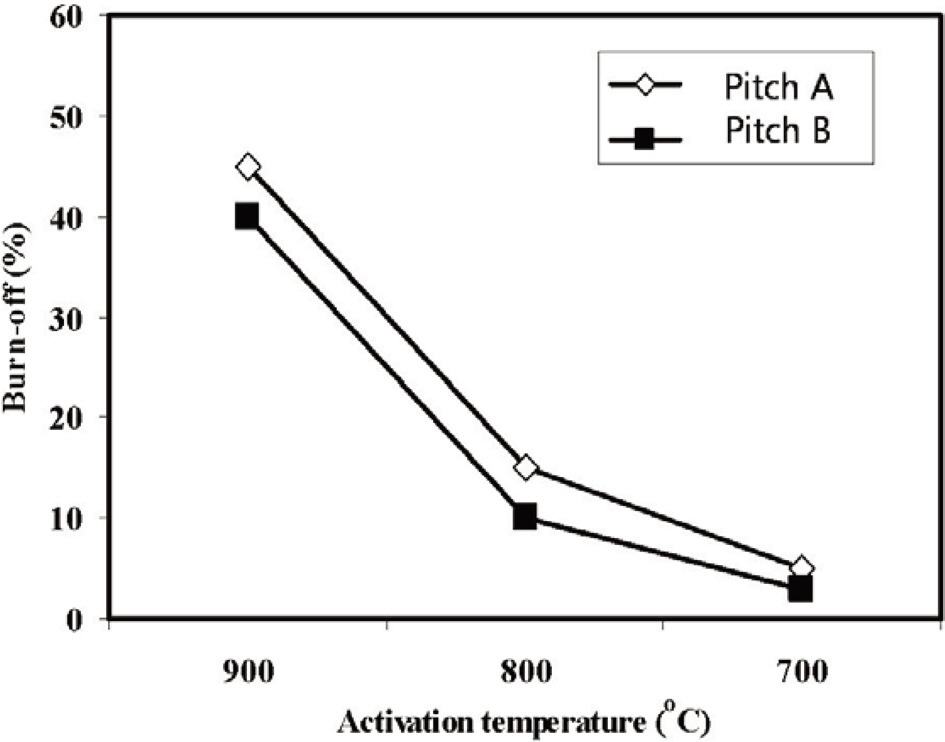
Fig. 11 shows the % burn-off of ACFs webs with the activation temperatures. The % burn-off increases linearly with increasing the activation temperature. Moreover, the ACFs based on Pitch A showed a higher % burn-off than the fibers based on Pitch B.
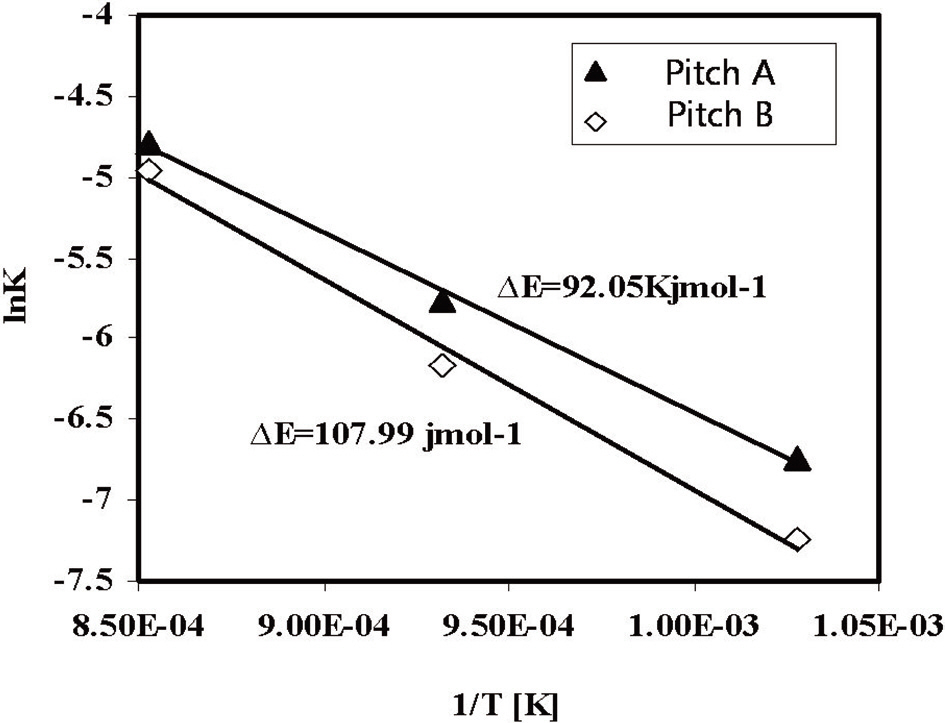
The activation energy levels of the fiber webs were calculated using the Arrhenius Eq. (1), shown graphically in Fig. 12. The results were 92.05 kJ/mol for Pitch A and 108 kJ/mol for Pitch B in the activation temperature range of 700-900℃.
Pitch A showed a lower ΔE value as compared to the Pitch B fiber web, which resulted from the faster diffusion of steam into the fibers through their smaller diameters and less ordered structures as compared with the E-spun fibers of Pitch B.
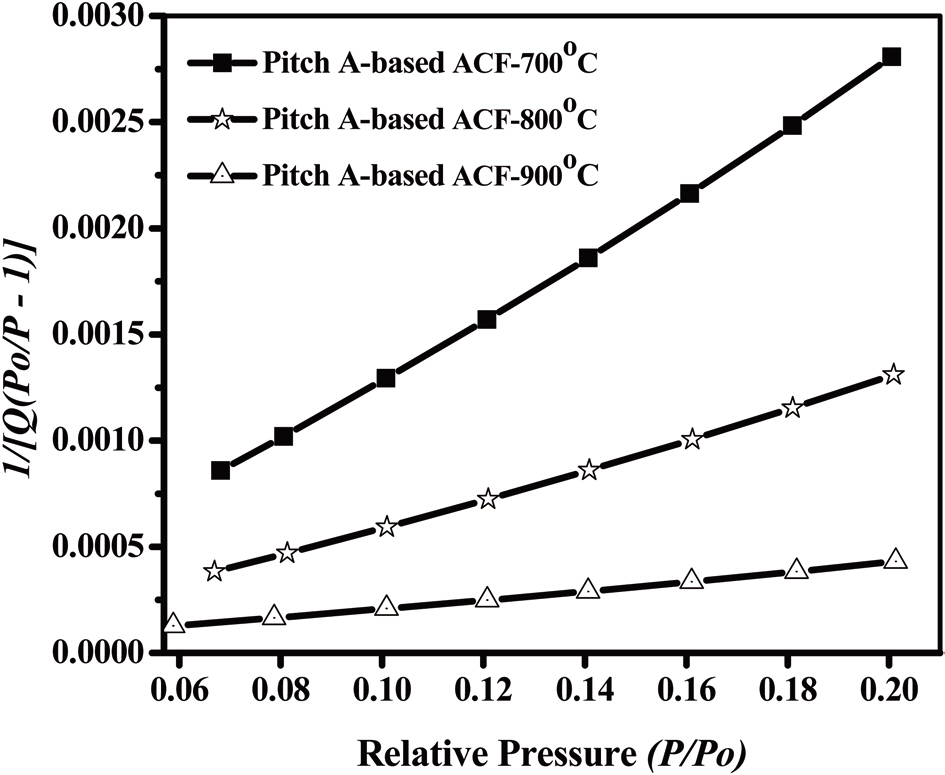
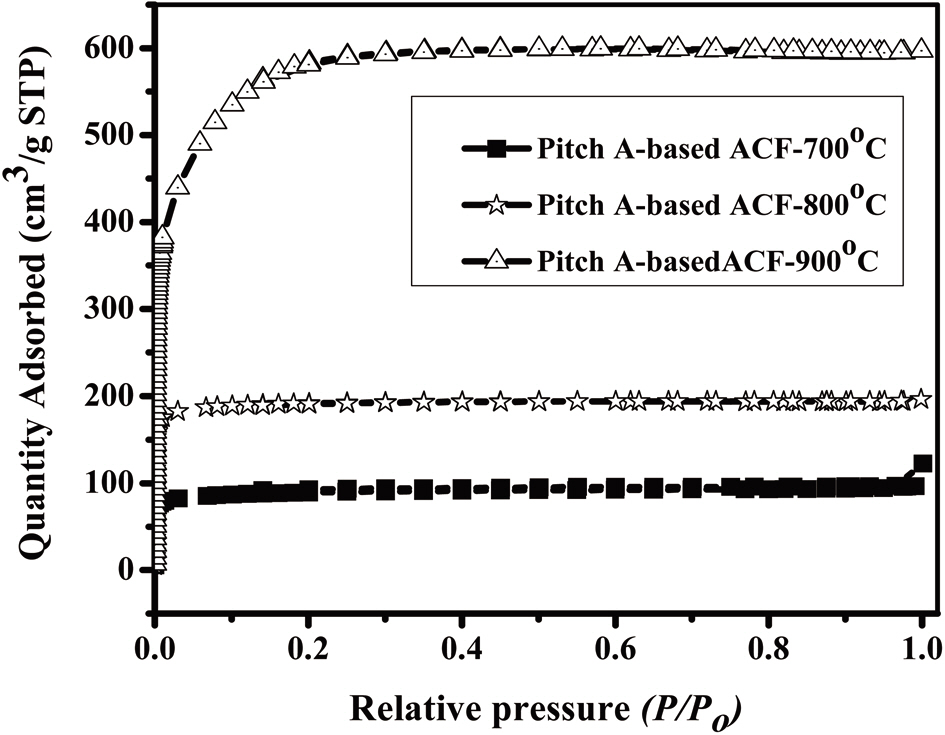
The N2 adsorption/desorption isotherms (77.4 K) of the Pitch-A-based ACFs were considered to be type 1 isotherms having a relatively small external surface area, as shown in Fig. 13 [29]. The detailed information pertaining to the textural properties of the samples is summarized in Table 3. The rapid uptake of N2 adsorption was found only in the low-pressure region due to monolayer adsorption on the MP walls. At a higher relative pressure, no further adsorption was observed, and the adsorption curve reached equilibrium. The volume of the adsorbed N2 increased with the activation temperature, representing the pore volume increase of the ACFs. These results suggest that the Pitch-A-based ACFs created considerable microporosity. The BET surface area plot is shown in Fig. 14, which clearly shows the increase in the specific surface area with the increased burnoff at various activation temperatures.
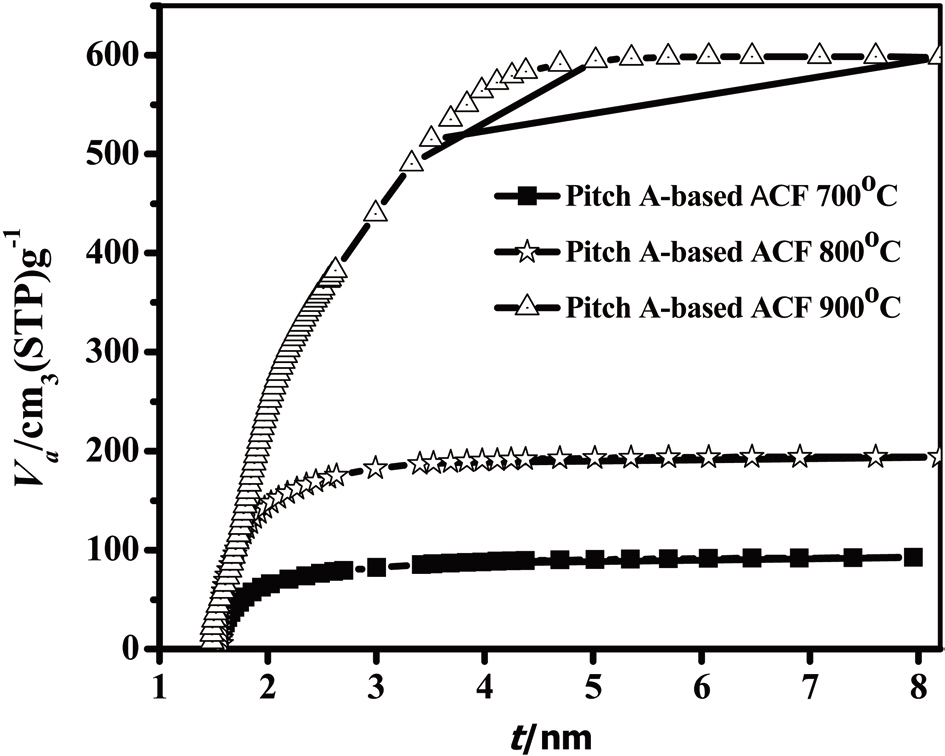
An analysis of the t-plots presented in Fig. 15 gives an evaluation of the pore size distribution and the amount of MPs [30]. All of the t-plots have a straight line indicating the presence of MPs. The initial slope of the curve represents the accurate surface area. The intercept and slope of the contact line with the
[Table 3.] Pore properties of the Pitch-A-based ACFs at various activation temperatures for 1 h
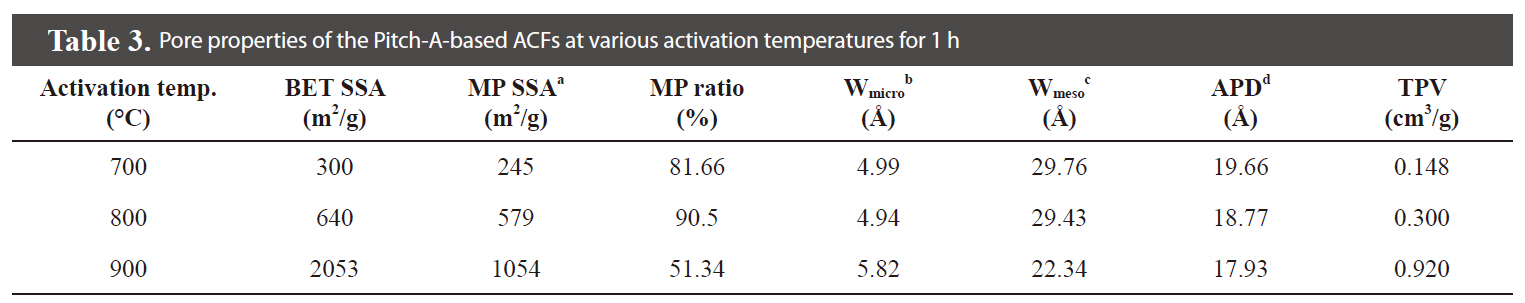
Pore properties of the Pitch-A-based ACFs at various activation temperatures for 1 h
curve in the plateau region gives the MP volume and external surface area, respectively. The type of t-plots indicates that all samples have mainly MPs and fairly similar external surface areas regardless of the degree of activation. With an increase
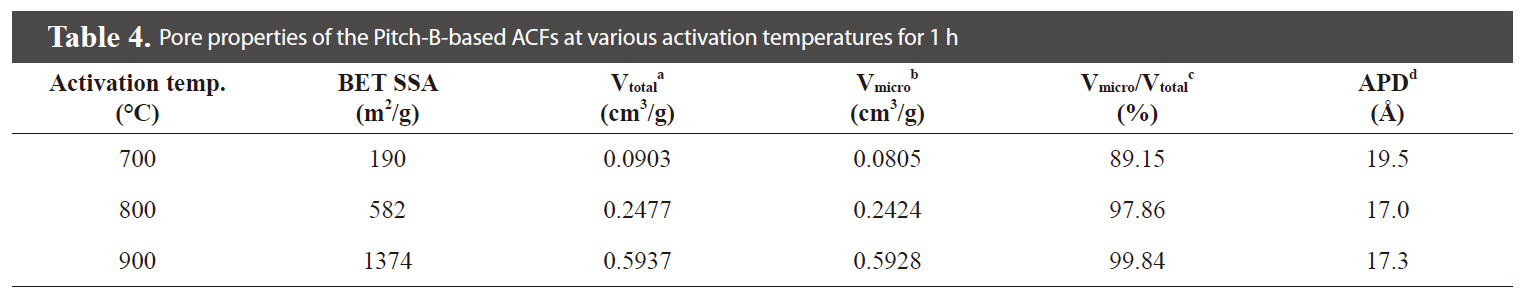
[Table 4.] Pore properties of the Pitch-B-based ACFs at various activation temperatures for 1 h

Pore properties of the Pitch-B-based ACFs at various activation temperatures for 1 h
in the activation degree, the initial slope of the curve increases,representing the increase in the MP surface area. Therefore, this result confirms that the Pitch-A-based ACFs have MPs with a narrow pore size distribution.
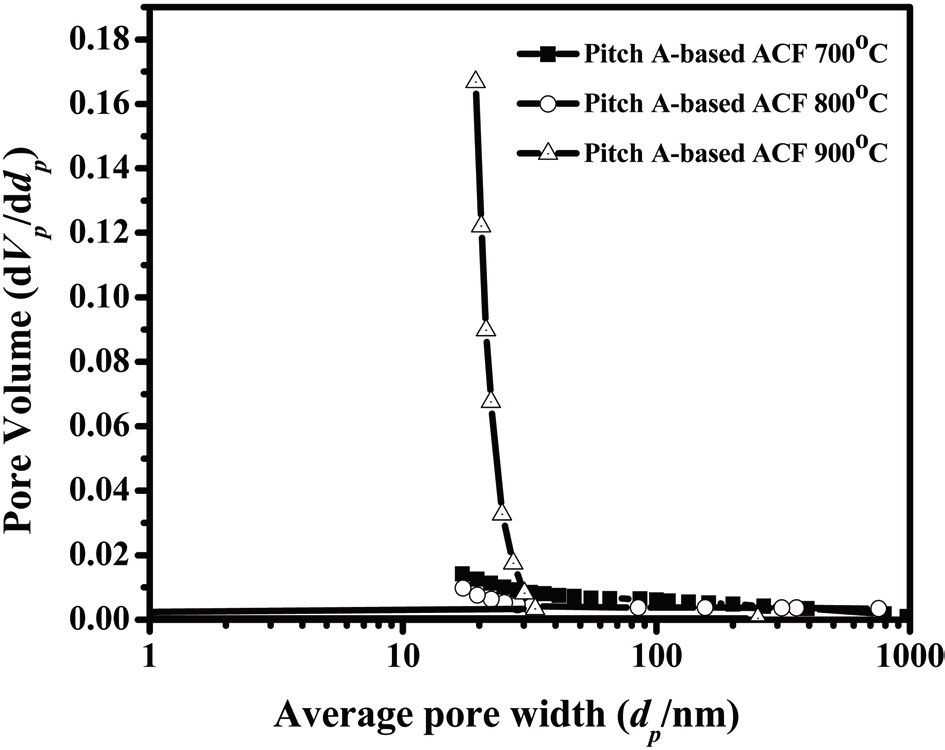
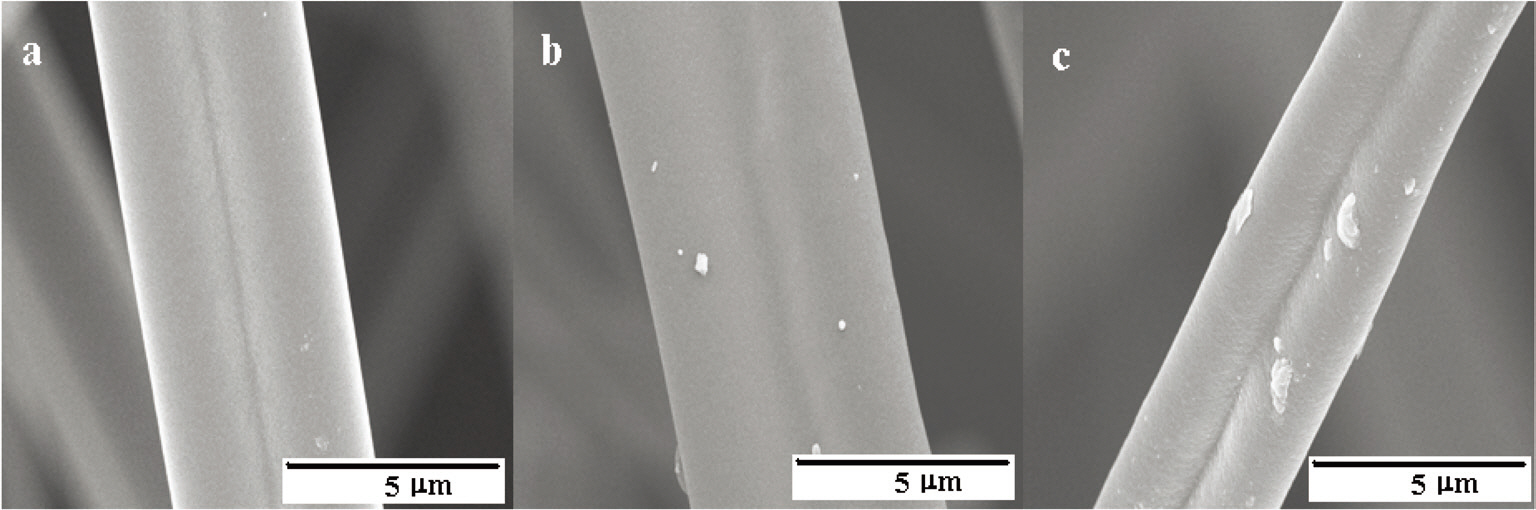
Fig. 16 shows the distribution of the mesopore size as determined by the BJH method, representing a narrow pore size distribution. The fiber surfaces are smooth without forming surface defects due to the high-temperature activation, as shown in Fig. 17.
The specific surface area and porous parameters of the Pitch
-B-based ACFs were calculated by the BET equation, MP-plot, and BJH method according to the N2 adsorption/desorption isotherms, as summarized in Table 4.
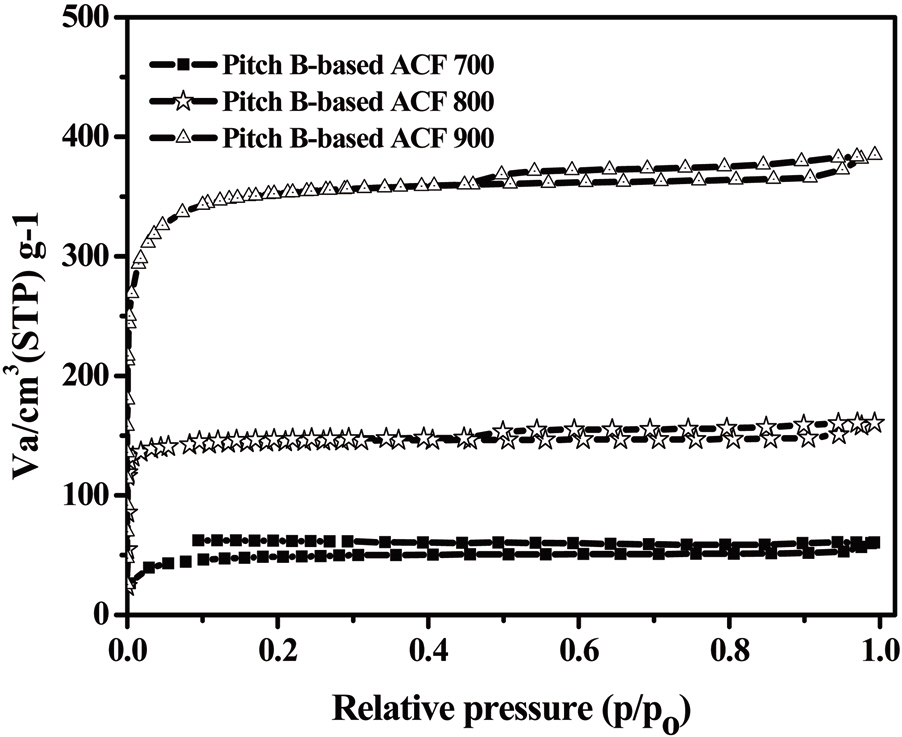
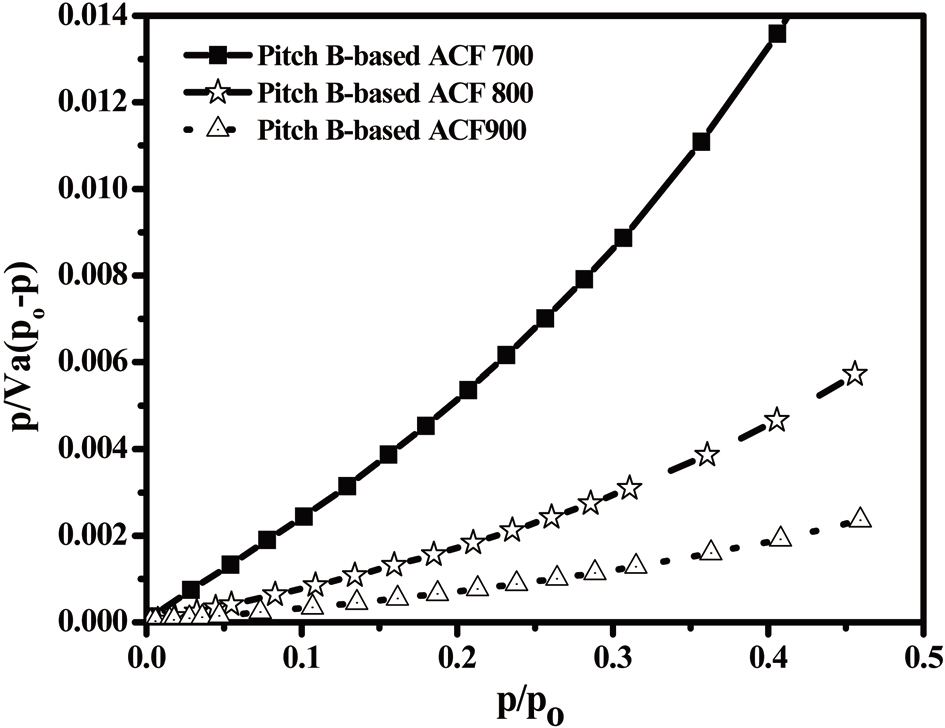
The N2 adsorption/desorption isotherms (77.4K) of the Pitch-B-based ACFs are presented in Fig. 18, which exhibits typical type I isotherms [29,31] according to the International Union of Pure and Applied Chemistry (IUPAC) classification. The major uptake of N2 adsorption was found in the low-pressure region,which is considered due to the monolayer adsorption on the MP
walls. At a higher relative pressure, no further adsorption was observed and the adsorption curve reached equilibrium. The volume of the adsorbed N2 gradually increased with an increase in the activation temperature, representing the pore volume increase of the ACFs. The nearly horizontal plateau at higher relative pressures indicates that the Pitch-B-based ACFs are highly microporous. The BET surface area plot is shown in Fig. 19, which shows the increase in the specific surface area with an increase in the burn-off at various activation temperatures for 1 h.
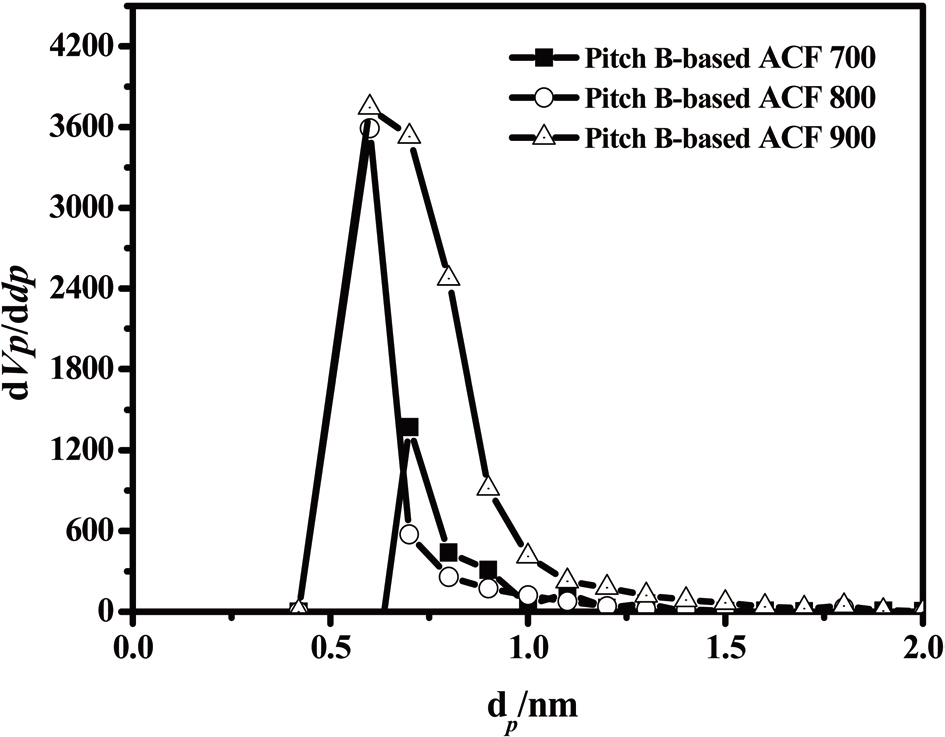
The results obtained by means of the MP method are shown in Fig. 20. In all three samples, the pore width distribution is narrow while the density of the pore size is high, at about 0.60 nm.
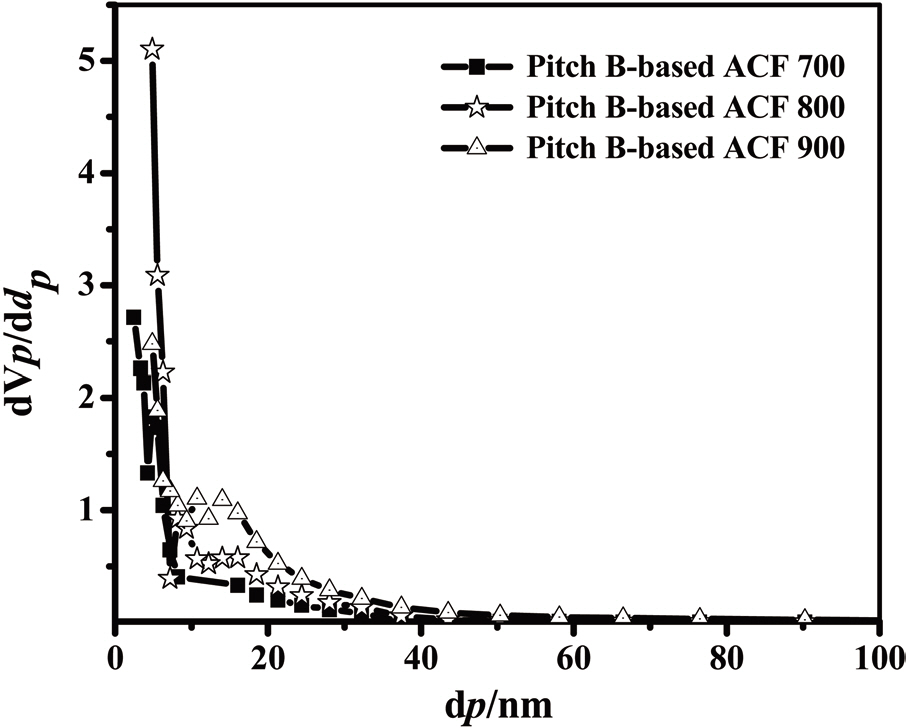
The distributions of the mesopores obtained by the BJH method are shown in Fig. 21. In this figure, the mesopore size distributions of all samples show a maximum intensity level at about 3.77 nm. With an increase in the activation temperature, the total pore volume increases rapidly, after which mesopores are introduced effectively into the Pitch-B-based ACFs through
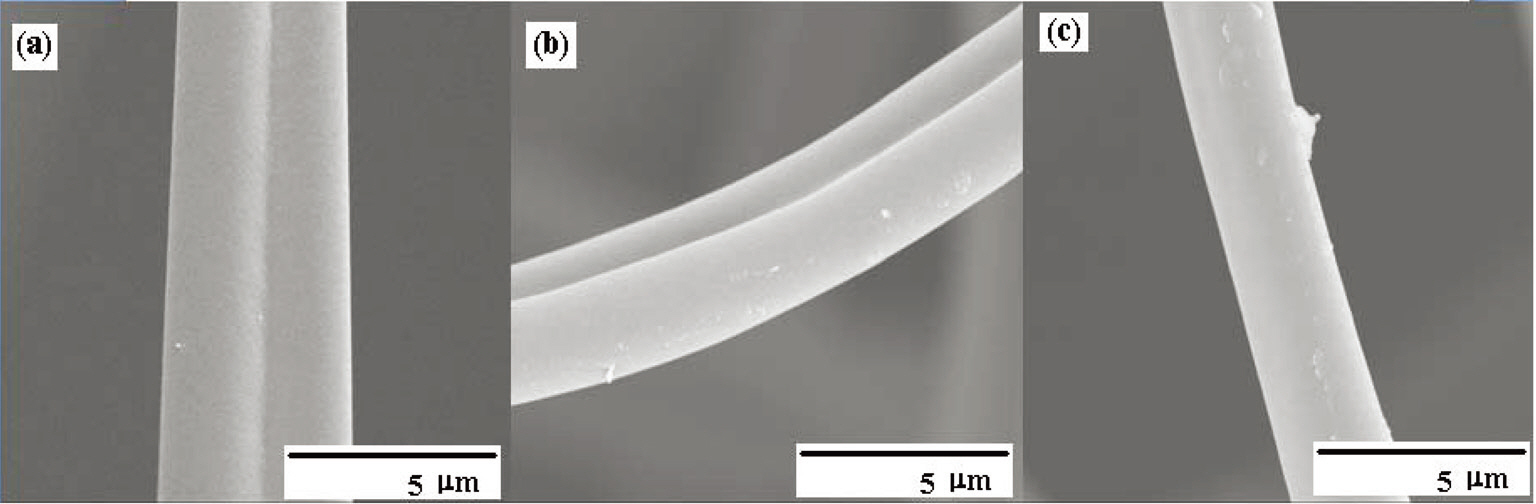
activation at 700-900℃. SEM microphotographs of the Pitch-B-based ACFs also show no hump formation on the surface, as shown in Fig. 22. The highest specific surface area was calculated to be 1,374 m2/g at an activation temperature of 900℃ for the Pitch-B-based ACFs.
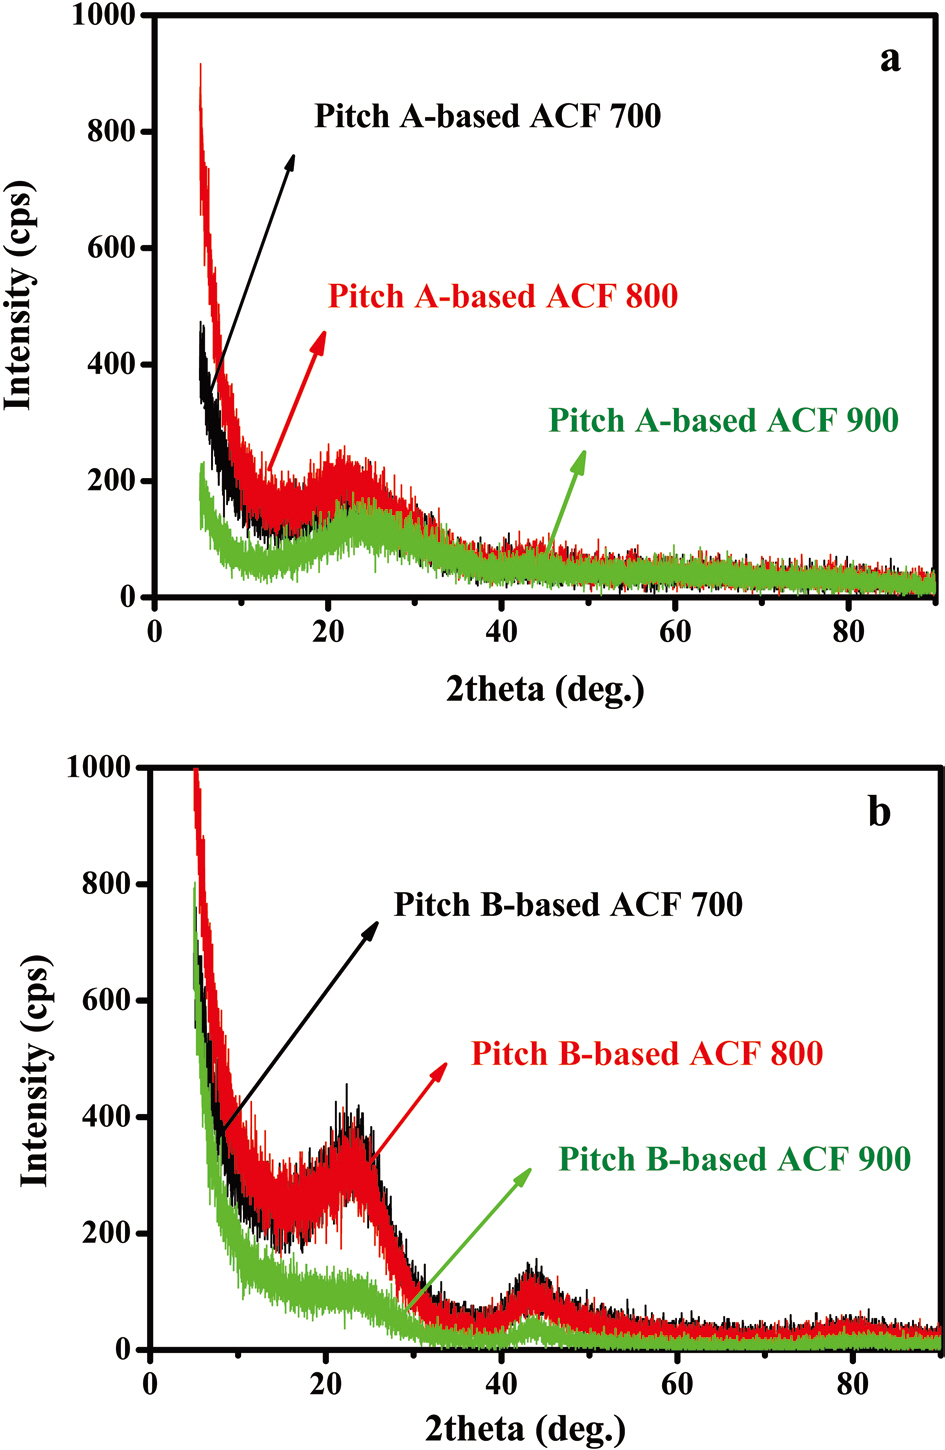
Comparatively, both the Pitch-A- and Pitch-B-based ACFs are microporous in nature, only differing in their respective surface areas, where the Pitch-A-based ACFs have a larger surface area than the Pitch-B-based ACFs. The difference may be described more precisely on the basis of their x-ray diffraction profiles.
X-ray diffraction patterns of both Pitch-A- and Pitch-B-based ACFs are shown in Figs. 23a and b. In all of the ACF samples, the diffraction bands are established at two different locations. The diffraction bands for both Pitch-A- and Pitch-B-based ACFs were established to 2θ at 23° and 45°, respectively. These diffraction bands are assigned to the disordered characteristic nature of the graphitic carbons as compared to the ordered graphitic carbon ranged to 2θ at 25°, as reported in the literature [32]. The lo-
cation and breadth of this band indicate that the activated carbon fibers have a coke-like property with a disordered carbonaceous interlayer [33]. The bands at 45° are ascribed to the presence of small domains of ordered graphene sheets in the ACF [34].
On the bases of these illustrated diffraction bands, it is confirmed that both of the samples are of a disordered nature, which is a characteristic property of ACFs [35,
Pitch A consists of molecules of a larger size containing more alkyl groups compared to Pitch B. The differences in the molecular structure led to differences in the solubility, which in turn led to a difference in the solution viscosity, resulting in better spinnability from Pitch A, which has a higher molecular weight. The greater alkyl group content in Pitch A shows less thermal stability in N2, resulting in a lower carbon yield and thus a lower activation energy. The characteristics of the Pitch-A-based activated carbon fibers were found to be less ordered with a higher specific surface area with a higher fraction of MPs when compared to the Pitch-B-based activated carbon fibers.