Nuclear graphite is a high purity synthetic graphite,usually known as electro-graphite, specifically manufactured for use as a fuel rod, moderator or reflector within nuclear reactors. Graphite as a moderator sustains the nuclear fission chain reaction and governs the operating life of the power plant. Graphite is an important material for the construction of nuclear reactors because of low absorption of neutrons,high thermal conductivity and high-temperature strength and stability. There are, in general, several requirements for nuclear graphite, including density (~1.8 g/cm3), crystallinity,thermal expansion coefficient (2.0~5.5×10⁻⁶K-1), strength(~20 MPa), high chemical purity, low reactivity in moisture(0.2~0.01 mg/g-h), and low absorption cross-section (4~5 mbarns). Among these properties, crystallinity is very important since it influences thermal conductivity, purity level, irradiation-induced modifications, dimension stability,and machinability [1-3].
Nuclear graphite is a polygranular graphite consisting of graphitic carbon of very high chemical purity. High purity is needed to avoid absorption of low-energy neutrons and the production of undesirable radioactive species. Modern reactor graphites are also characterized by a high degree of graphitization and no preferred bulk orientation. Such isotropic properties increase the dimensional stability of the nuclear graphite at high temperatures and in a high flux of neutrons. The basic criteria in the classification of synthetic graphites are the grain size and forming process. Graphite is not a self-sintering material since it has a low self-diffusion coefficient, even at processing temperatures in the range 2000~3000oC. A standard process for producing graphites includes the preparation of a filler and binder from raw materials, mixing, shaping, firing, and graphitization. The grain size of synthetic graphite is typically determined by the particle size of the filler [4,5].
Thermal emissivity of nuclear graphite is of great importance for rapid emission of heat, which is critical to cope effectively with the accident of nuclear reactor.Thermal emissivity varies with the nature of the material and its temperature as well as its physical condition, e.g.,roughness, cleanliness of surfaces, etc. Nonmetals, in general, have fairly high emissivities, although the values decrease with increasing temperature. The emissivity of graphite approaches unity at temperatures up to about 530oC,so that it approximates a black body. It is therefore a good emitter and absorber of thermal radiation [6]. Although thermal emissivity is an intrinsic physical property of materials, it is affected significantly by the surface conditions[7-10]. However Systematic and quantitative data on the relationship between the thermal emissivity and surface morphology and roughness have not yet been reported in the literature [8,11,12].
During service in a high-temperature reactor, graphite will be oxidized by impurities such as water vapor present in the helium coolant. Oxidation will affect the thermal conductivity of the graphite and hence the fuel temperature.The value of thermal conductivity at room temperature decreases with increasing weight loss, but not linearly, the decreases being most rapid at low weight losses. The percentage change in thermal conductivity is approximately linear with the increase in open porosity.
The graphite crystal has a hexagonal structure. C-C covalent bonds exist within the basal sheet structure, while the basal planes are held together in parallel by relatively weak Van der Waals forces. The space group is P63/mmc,and the lattice parameters are a=2.461 A and c=6.707 Afor a perfect graphite crystal [13]. It is well accepted that the interlayer spacing of graphite carbon (d002) decreases as the degree of cystallinity increases [14,15]. For example, SP-1, a commercially available well-crystallized graphite, has an interlayer spacing of 3.355 A, and a crystal size more than 1000 A [16]. SP-1 has been frequently referenced as a standard for well-crystallized graphite. A structure with crystallite size of
Recently we have reported the relationship between thermal emissivity and porosity changed by oxidation of various nuclear graphites. The overall emissivity of oxidized samples increased with increase of the oxidation degree. As oxidation degree increased, density decreased and porosity increased, respectively. Scanning electron microscope (SEM)observation showed that fine pores were developed and grown in the oxidized graphites. Investigation of factors affecting the emissivity revealed that increases in the surface porosity due to oxidation were responsible for the increase in emissivity after oxidation [18].
Also we have reported the correlations between emissivity and surface structure changed by oxidation of various nuclear graphites using Raman spectroscopy. The thermal emissivity increased depending on the decrease of the R (Id/Ig) value through Raman spectroscopy analysis. It was concluded that the crystallinity increase following oxidation degree of the nuclear graphite and the thermal emissivity increase would be similar tendency [19].
X-ray diffraction (XRD) has been well established as the most available and powerful technique to measure the crystal structure of graphite, such as interplanar spacing, lattice parameters and crystallite sizes (
Up to date, however, XRD technique has not yet been employed to analyze the thermal emissivity changes of nuclear graphites according to oxidation degree. In this study we expected that nuclear graphite could show the change of crystal structure in the surface of graphites, and tried to elucidate the relationship between thermal emissivity changes and crystal structure changes, as well as surface morphological changes using XRD and SEM. The objective of this paper is to correlate the thermal emissivity of isotropic nuclear graphites with its surface structural change in oxidation using SEM and XRD analysis.
The specimens used in this study are commercial nuclear graphites (IG-110, PCEA, IG-430, and NBG-18). Forming method, source coke, grain size and density of the specimens are different with graphite types [20-22]. The IG group graphites were manufactured by Toyo Tanso (Japan) with the iso-static molding method, and the grain size was about 10~20 ㎛. Petroleum coke was used for source coke of IG-110, and pitch coke was used for IG-430. NBG-18,manufactured by SGL, was molded by the vibration method with the grain size of 300 ㎛ that was larger than the IG group. Source coke for NBG-18 was the pitch coke. PCEA,manufactured by GrafTech, was molded by extrusion with the grain size of 360 ㎛ that was the largest grain in this study. Petroleum coke was used for source coke of PCEA.
The specimens were oxidized at 600oC in the air flow of 5 L/min within the tube furnace. The degrees of oxidation were set to 5% and 10% weight loss. Refer to the earlier report to get the detailed information on specimens,experimental methods for oxidation, and thermal emissivity measurement [18,19].
The emissivity values measured after oxidation is summarized in Table 1. The thermal emissivity showed an increasing tendency with increase of weight loss. The highest thermal emissivity was 0.890 which was measured at 100oC from the 10% oxidized NBG-18 specimen.
2.2. Microstructure observations
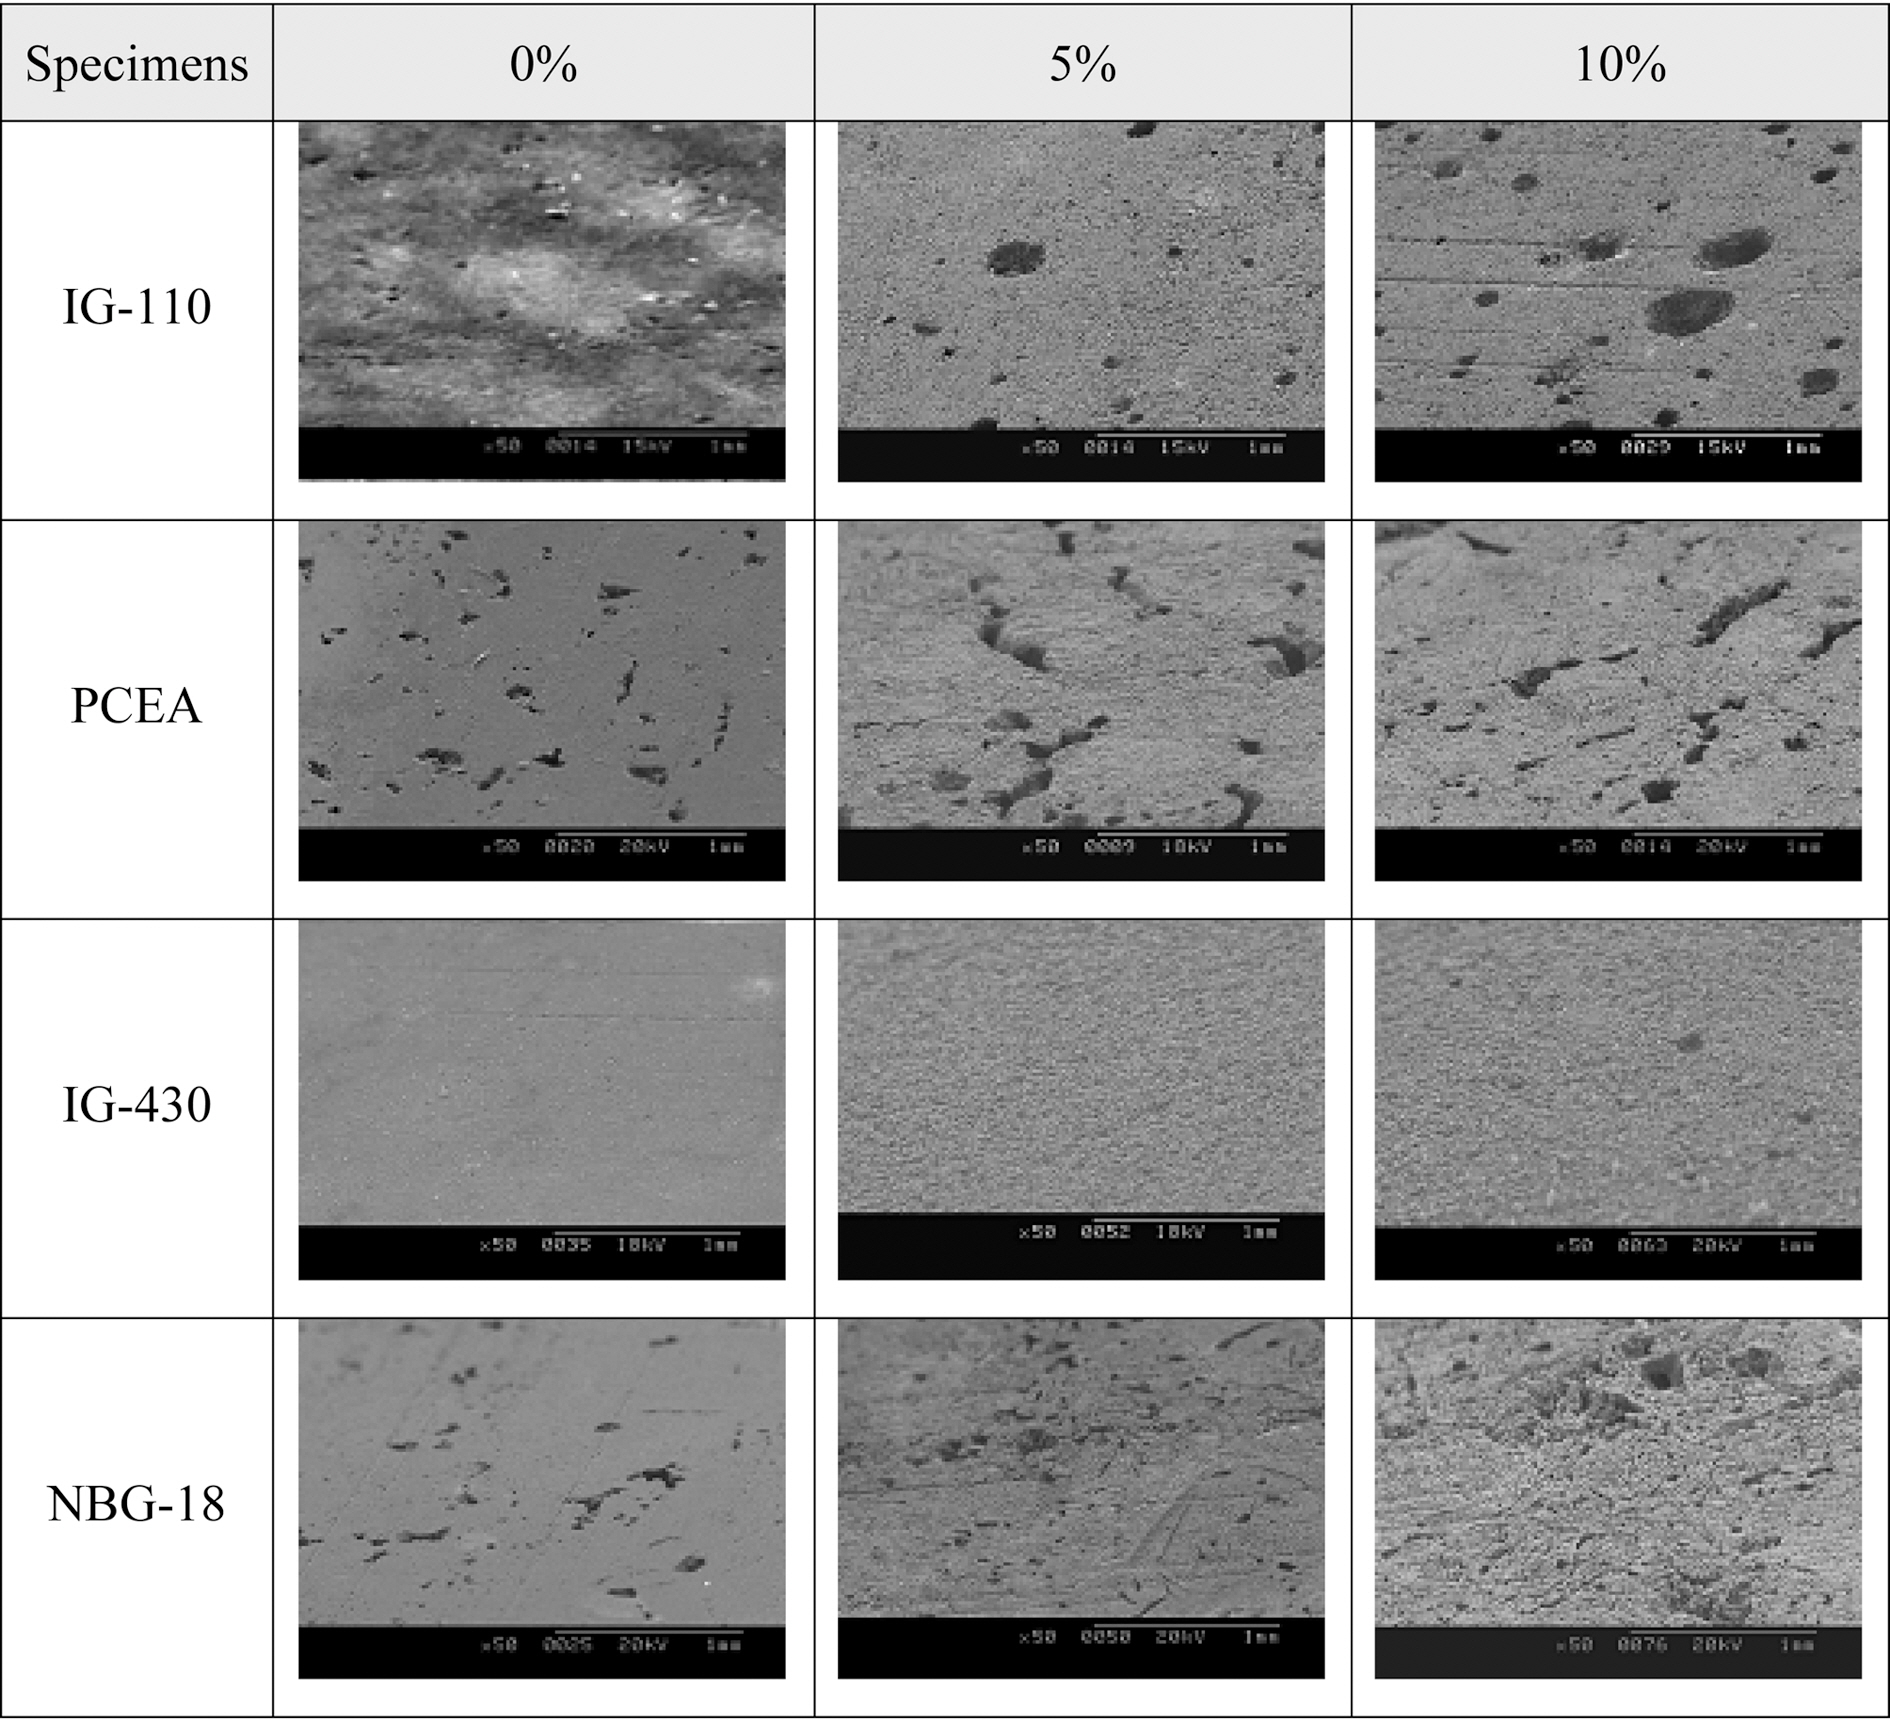
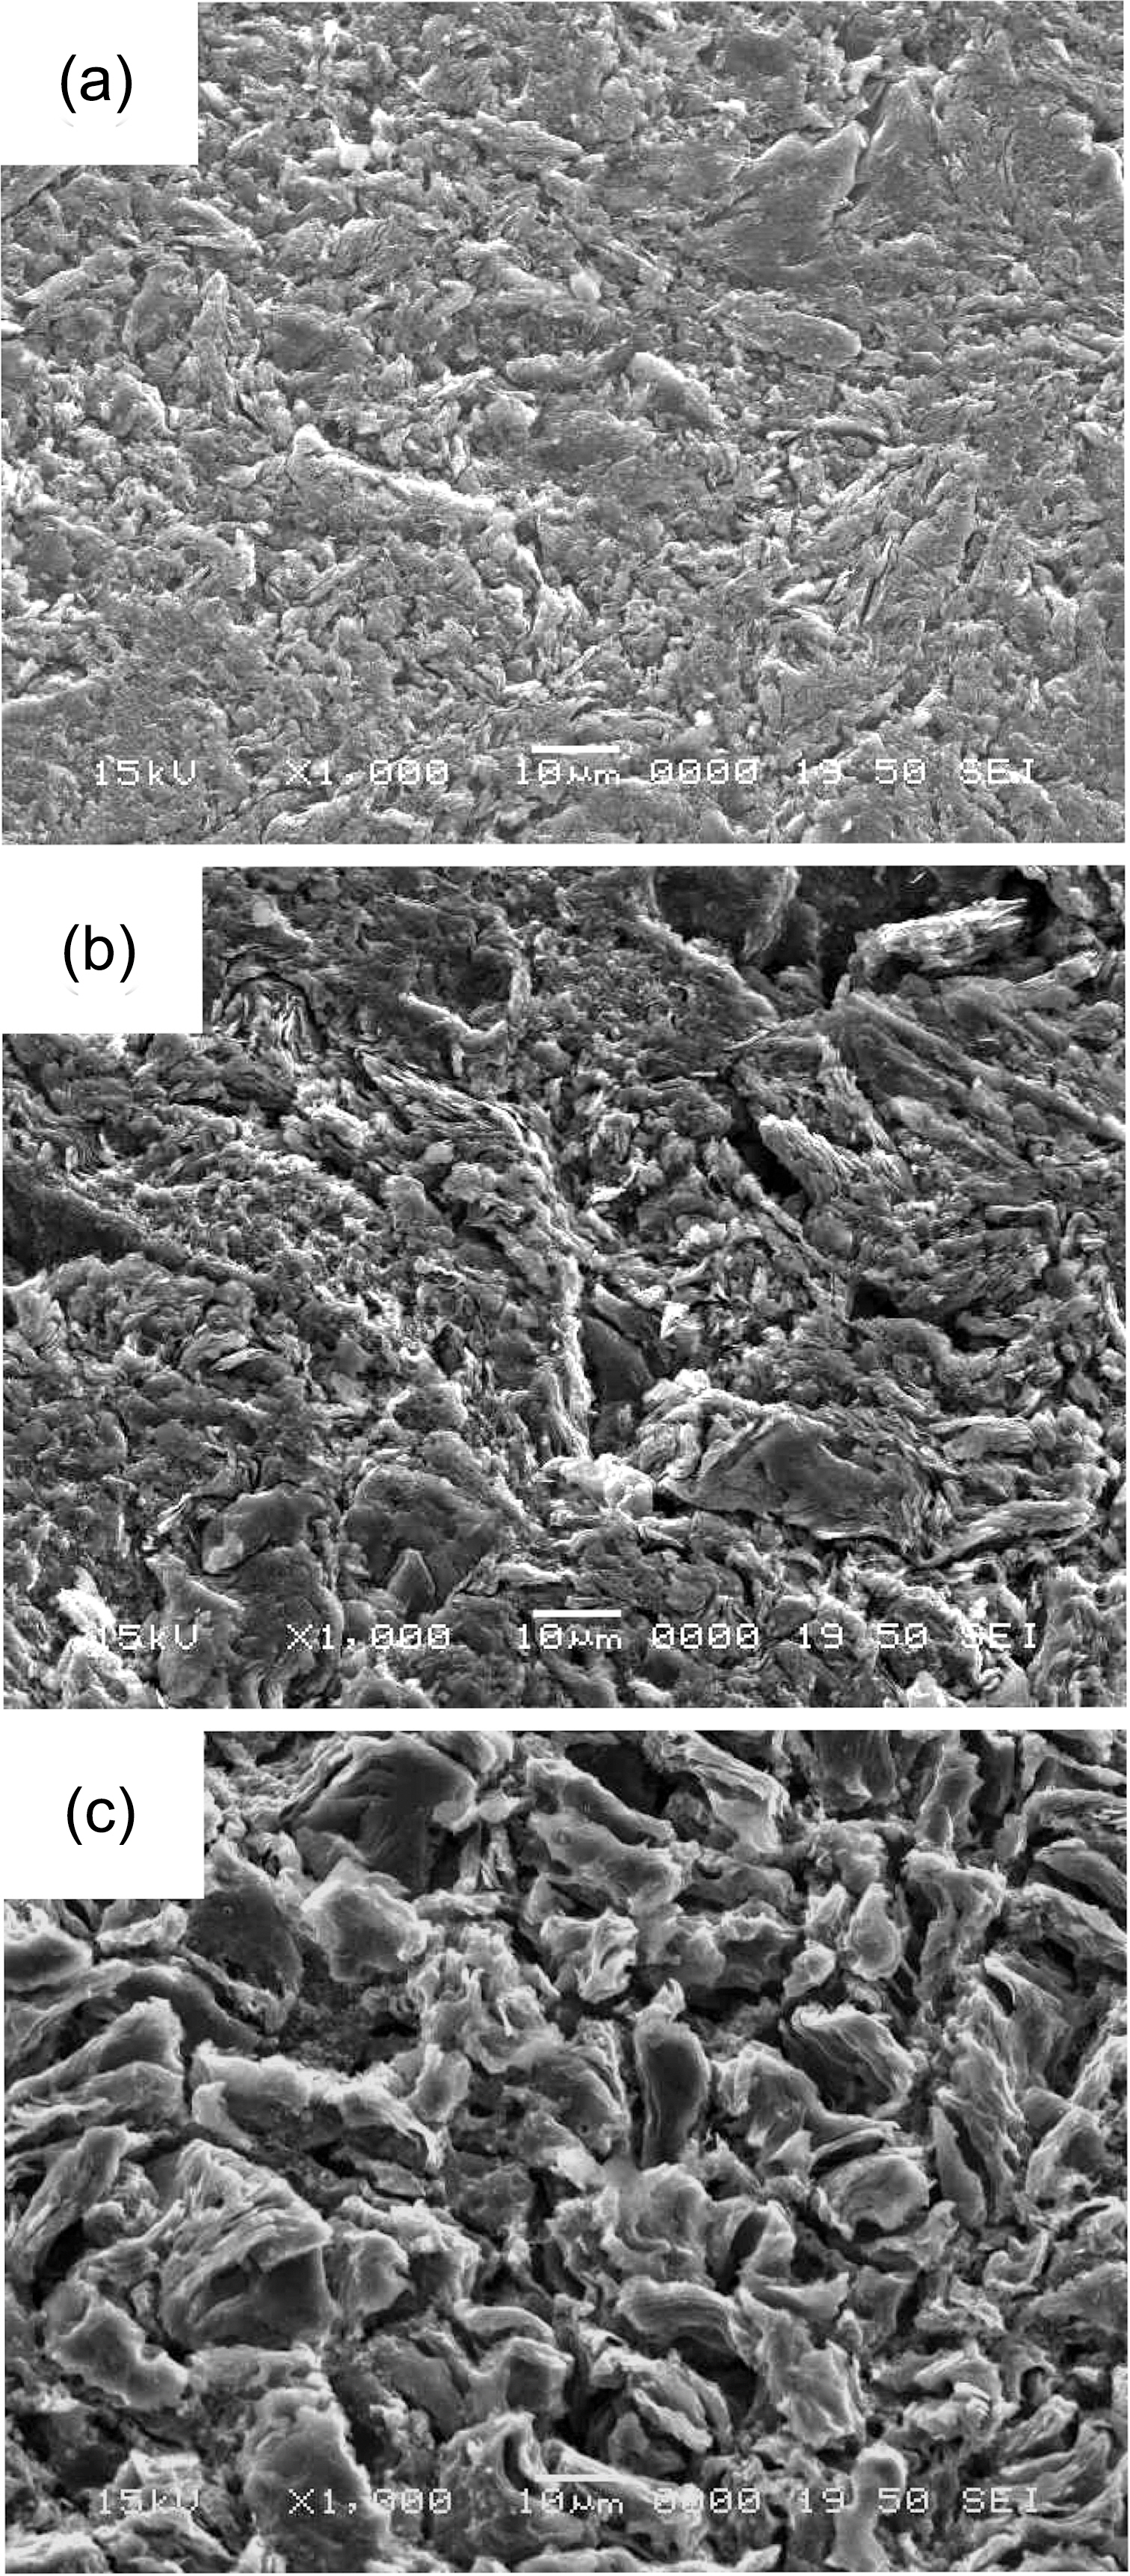
The surface microstructure of the oxidized specimen was studied using a SEM. Fig. 1 shows the SEM images taken at a magnification of ×50 from the various specimens with different degree of oxidation [18].
Higher magnification observations (×500 and ×1000) were also employed to investigate detailed phenomena before and after oxidation.
[Table 1.] Summary of Thermal Emissivity Data [1819]
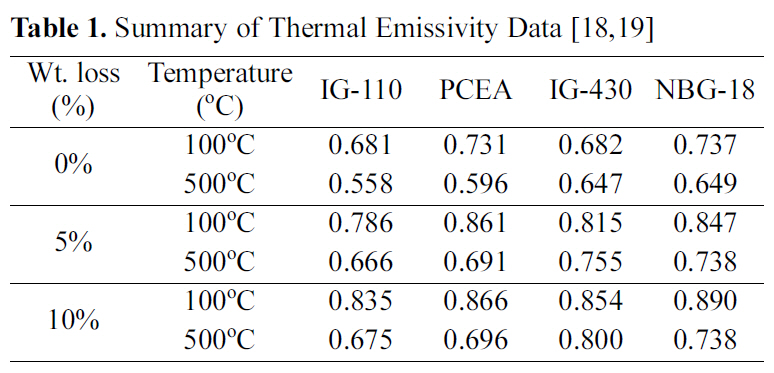
Summary of Thermal Emissivity Data [1819]
The XRD peaks were obtained by the continuous scanning with a scan speed of 1o/min in a 2θ range of 20~60o using a Cu-Kα1 target (λ=1.5406A). A Si standard sample was used for the correction of 2θ. Kα2 corrections were performed for the whole peaks. XRD analysis was carried out as follows. Interlayer spacings, d002 and d100 were calculated from the 2θ values using Bragg’s law which were measured from the highest peak position after the average smoothing of the diffraction peaks. The full width at half maximum (FWHM) was then obtained by Lorentzian fitting after elimination of a background by the line connection of base points of the smoothed peaks. Fitting correlation parameter was over 0.98 for a (002) peak and 0.97 for a (100) peak.
Grain sizes were determined from Scherrer's equation shown below where L is the average grain size, λ is the wavelength of the X-rays used, B is the FWHM in radian, θis the Bragg angle, and K is a constant [23].
L= Kλ/(Bcosθ)
Instrumental error which comes from the measurement of a FWHM was corrected by Warren equation, B2=Bmeas 2-Binstr 2.
As shown in Fig. 1 which was observed at low magni-
fication(×50), the overall surface roughness was increased as the oxidation degree increases. To investigate detailed surface microstructure change, higher magnification observations(×500 and ×1000) were employed. Both microstructures of IG-430, which has the smallest grain size of about 10 ㎛ in this study, and PCEA, which has the largest grain size of about 360 ㎛, were observed to know the grain size effect.
Large pores were formed in IG-110 as the oxidation degree increases, whereas pores were not observed in IG-430 as the oxidation degree increases. IG-430 has not developed even the prominences and depressions on the surface. In the case of PCEA and NBG-18, even the 0%specimens have pores. It is considered that the formation of
pores in 0% specimens of PCEA and NBG-18 are attributed to the large grain sizes (over 300 ㎛) which is larger than that of IG types (about 10 ㎛).
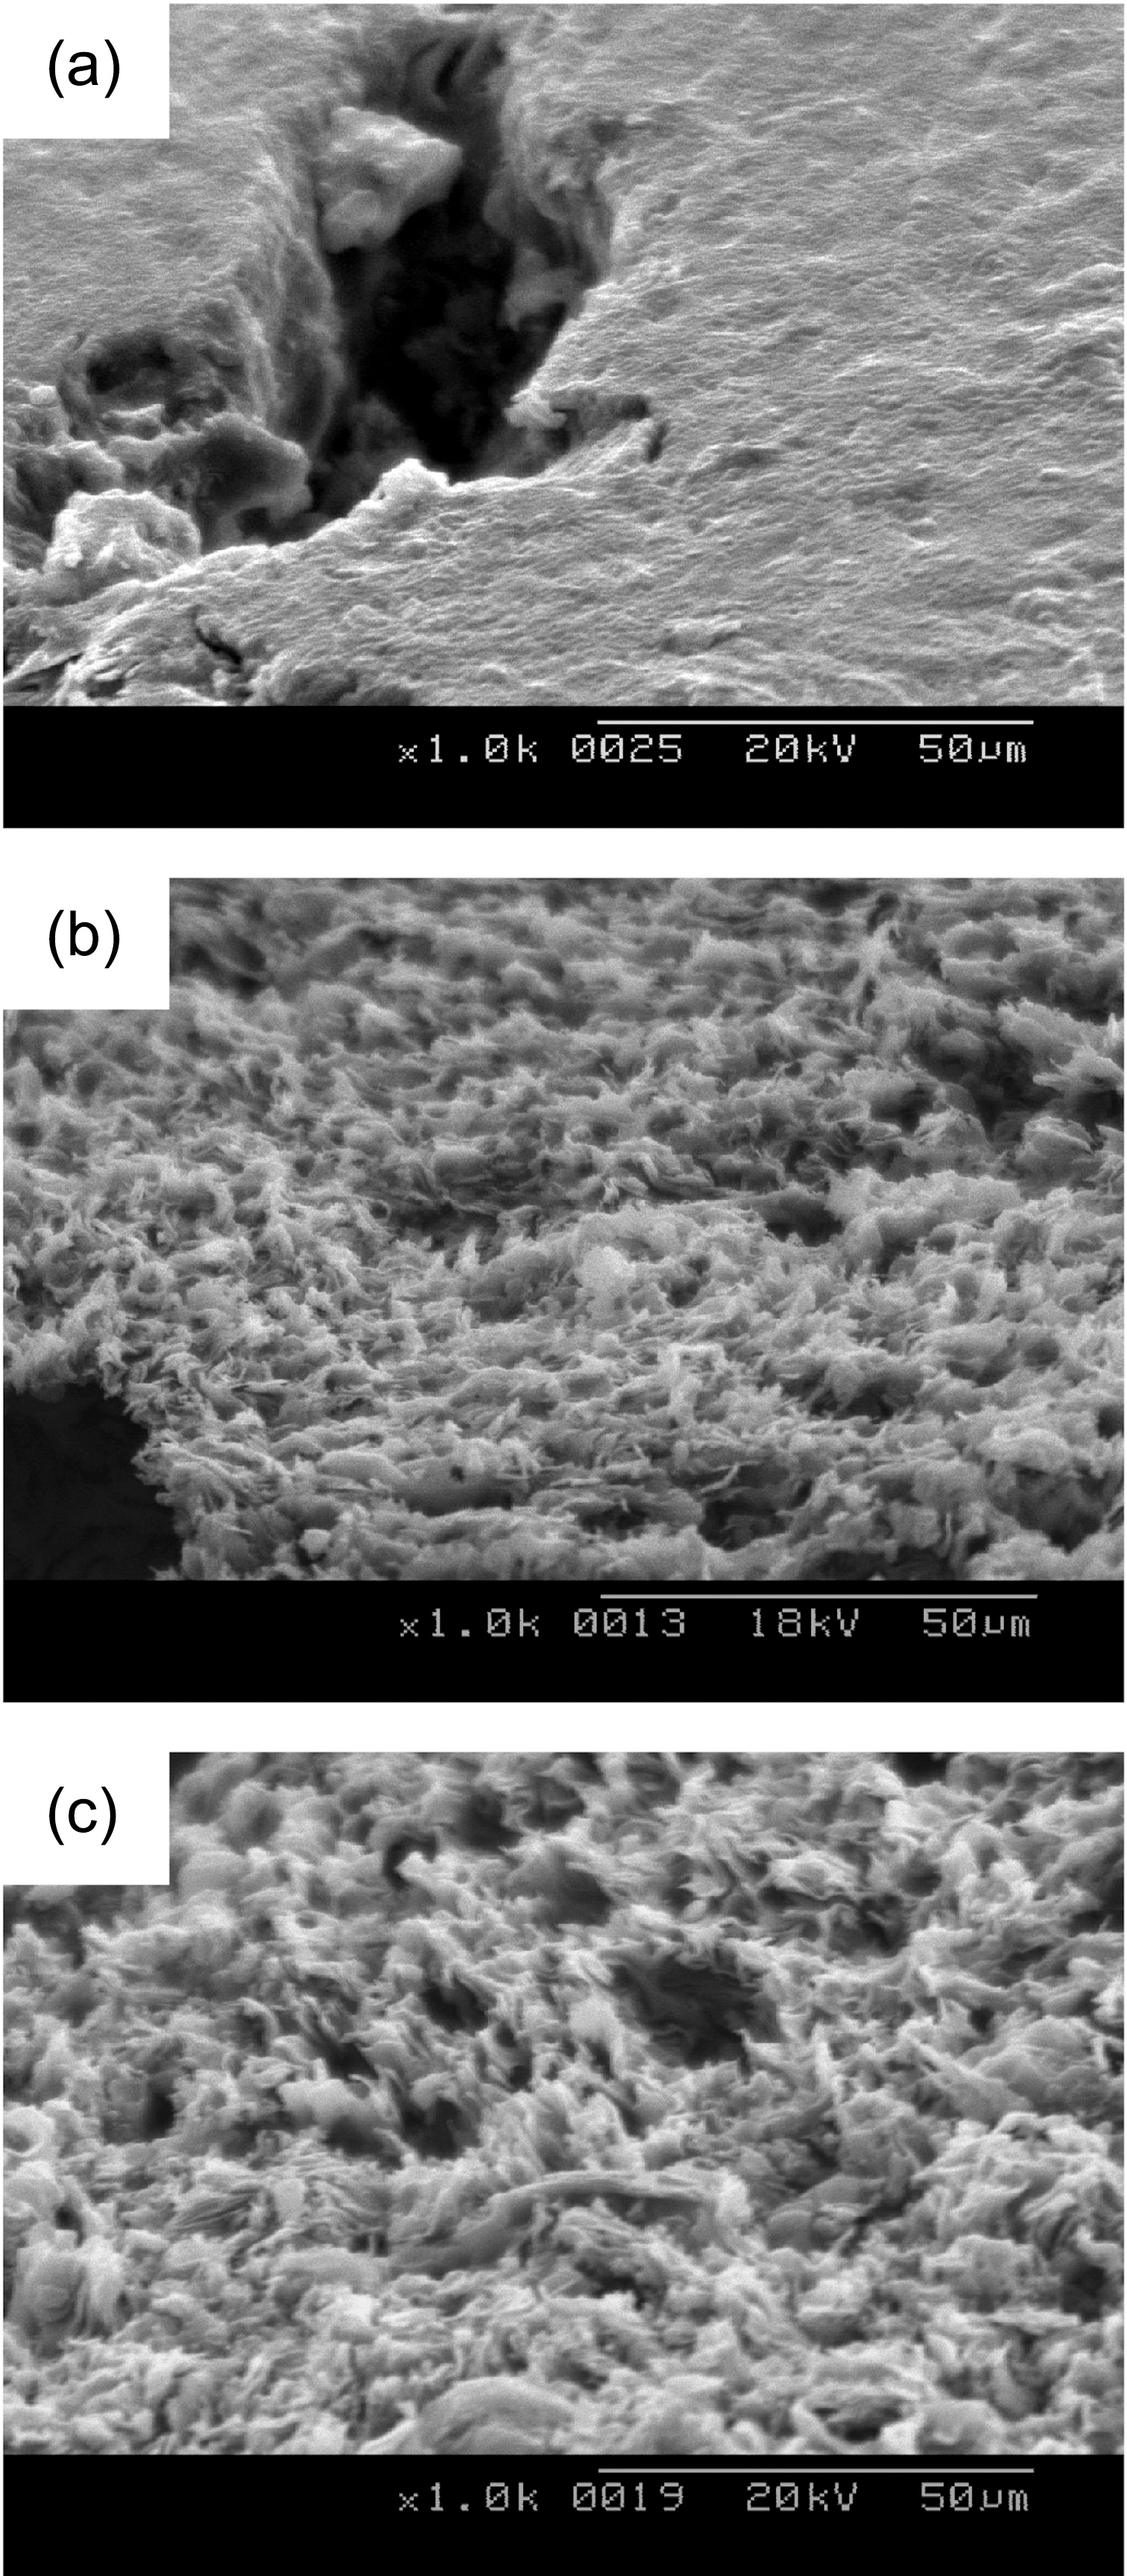
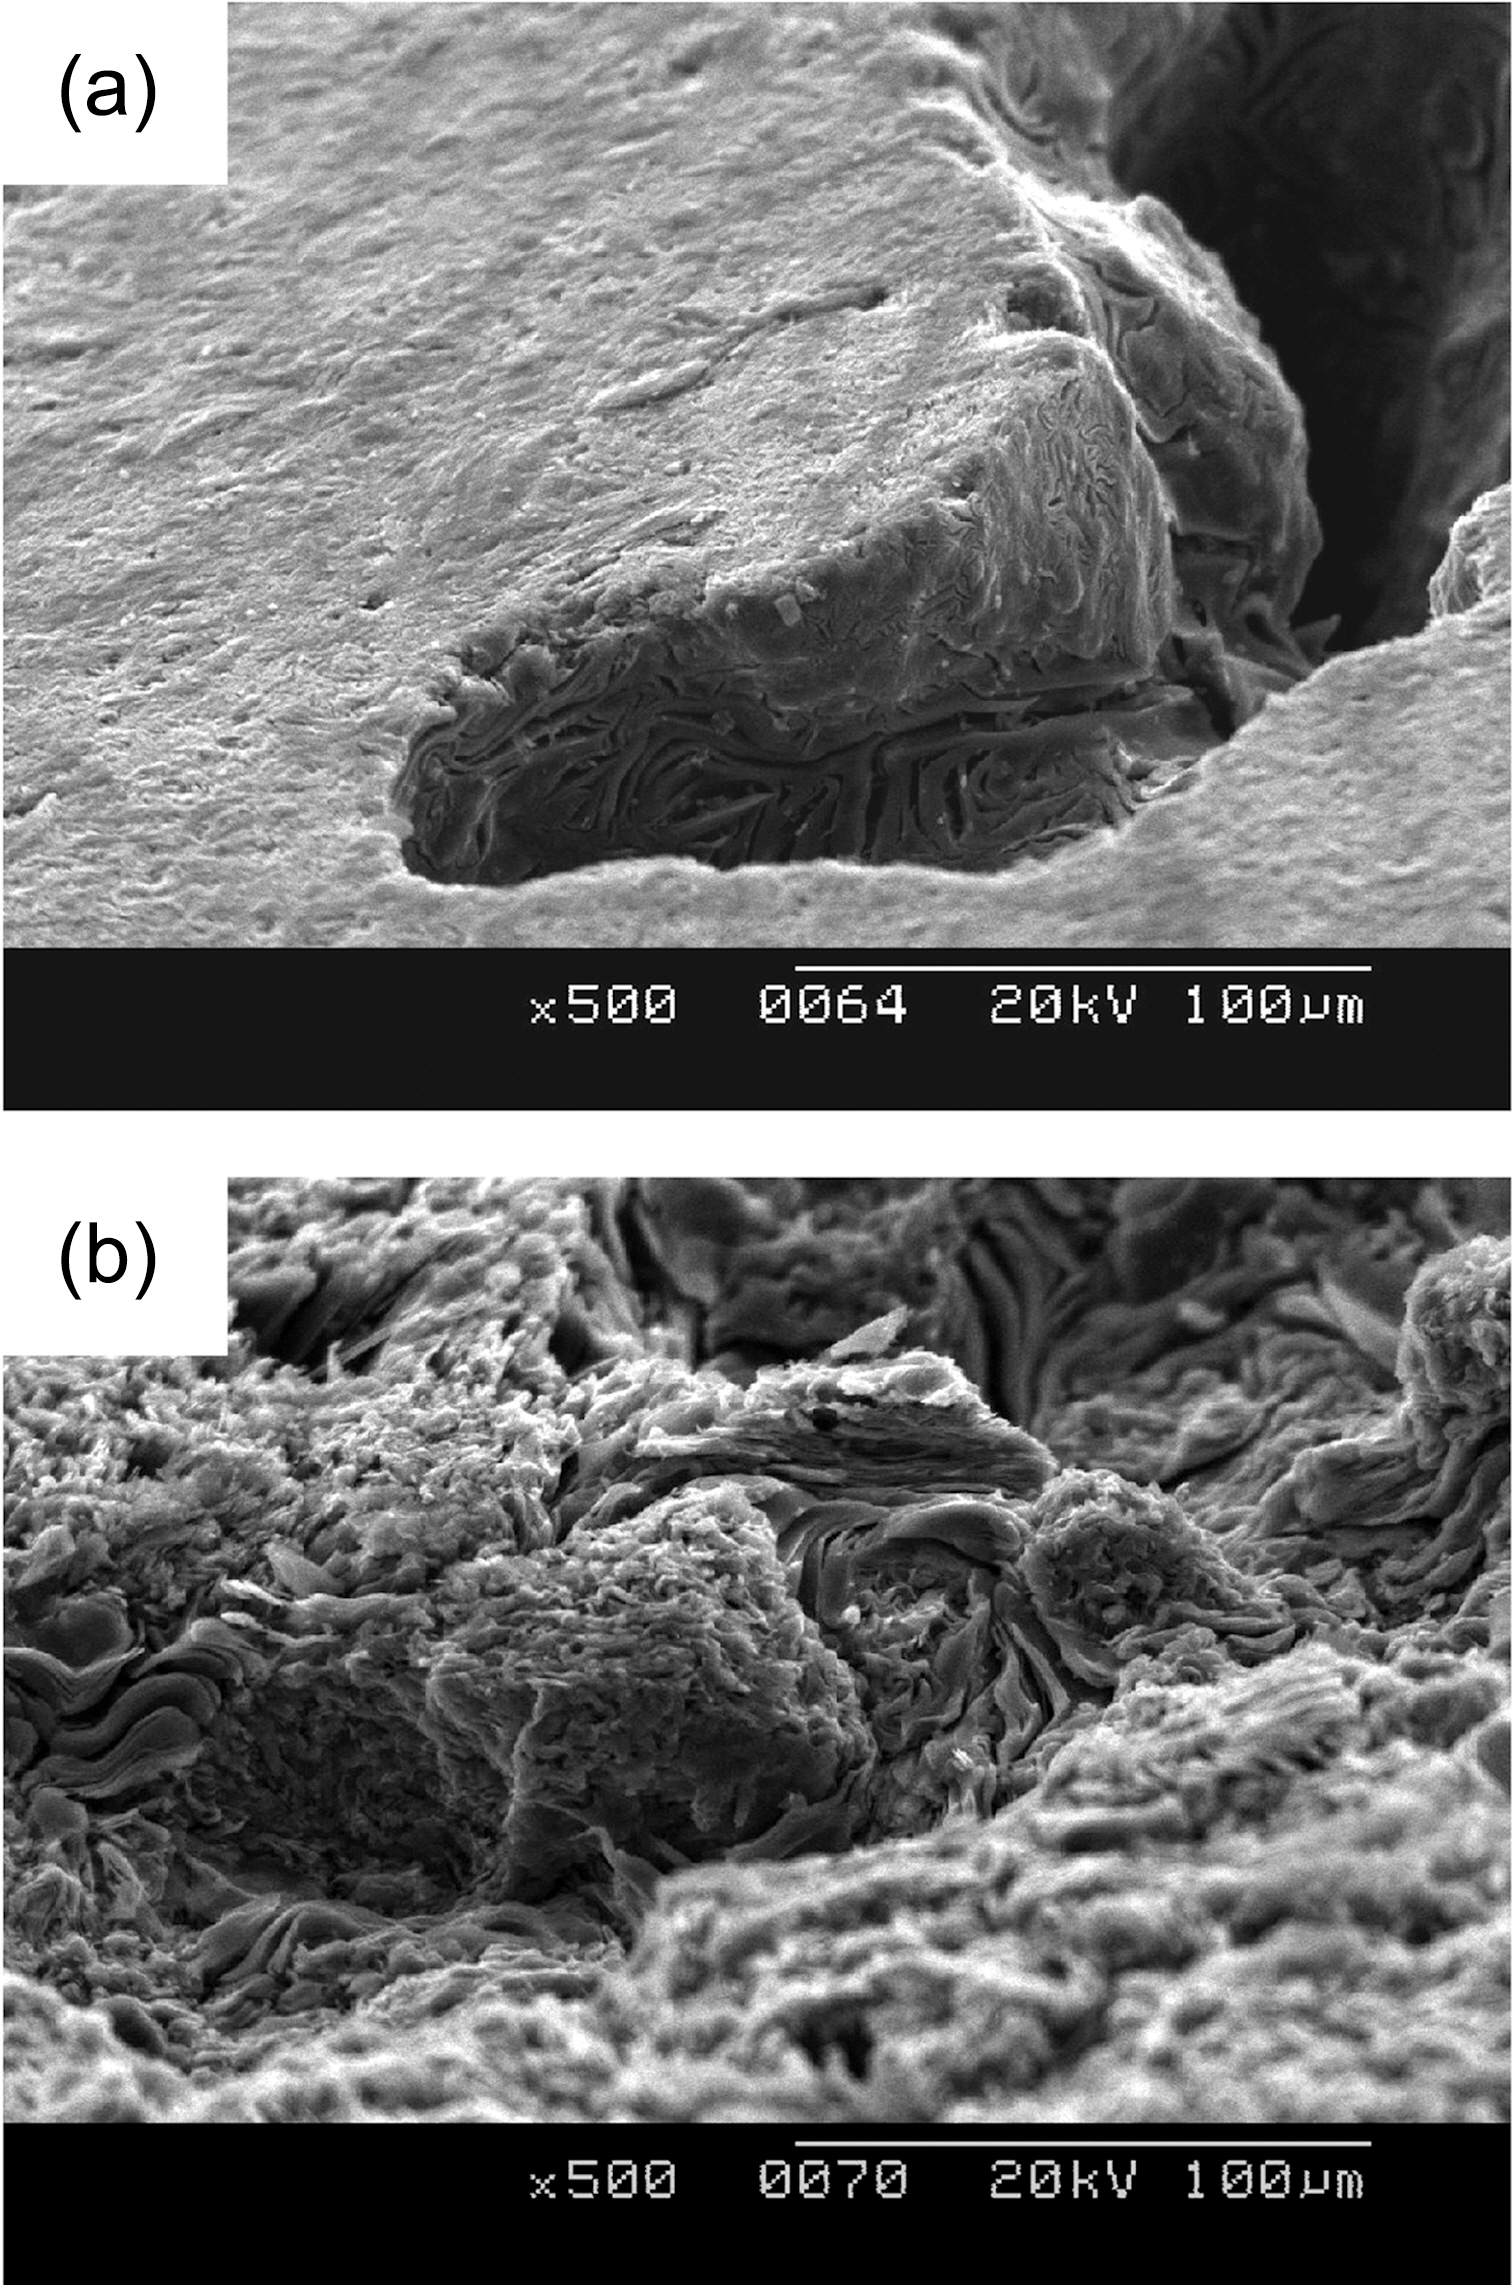
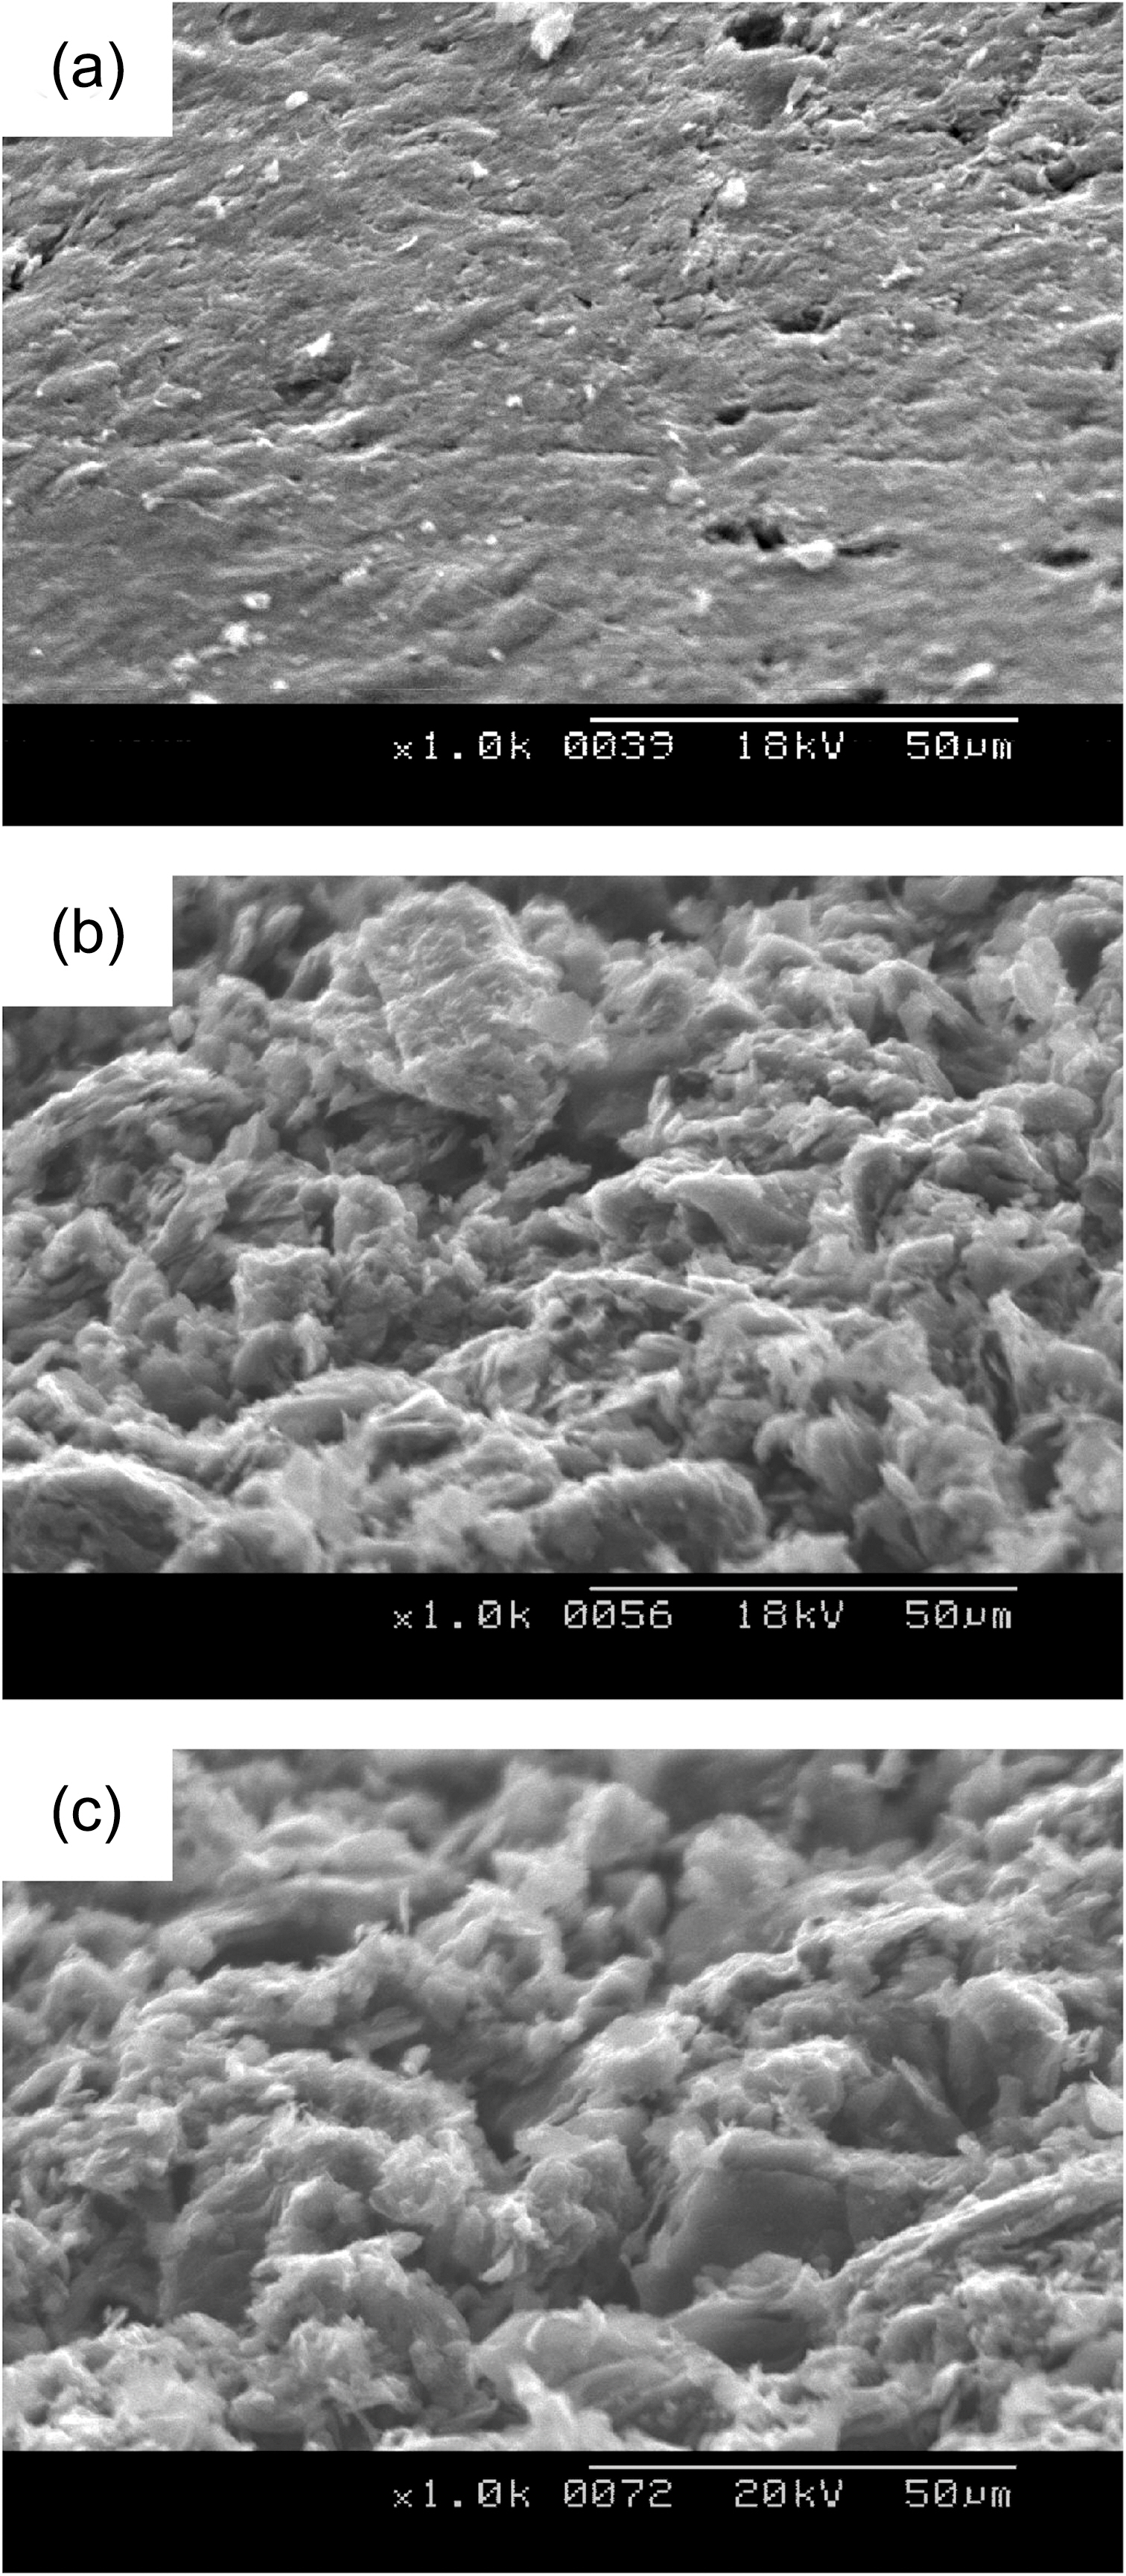
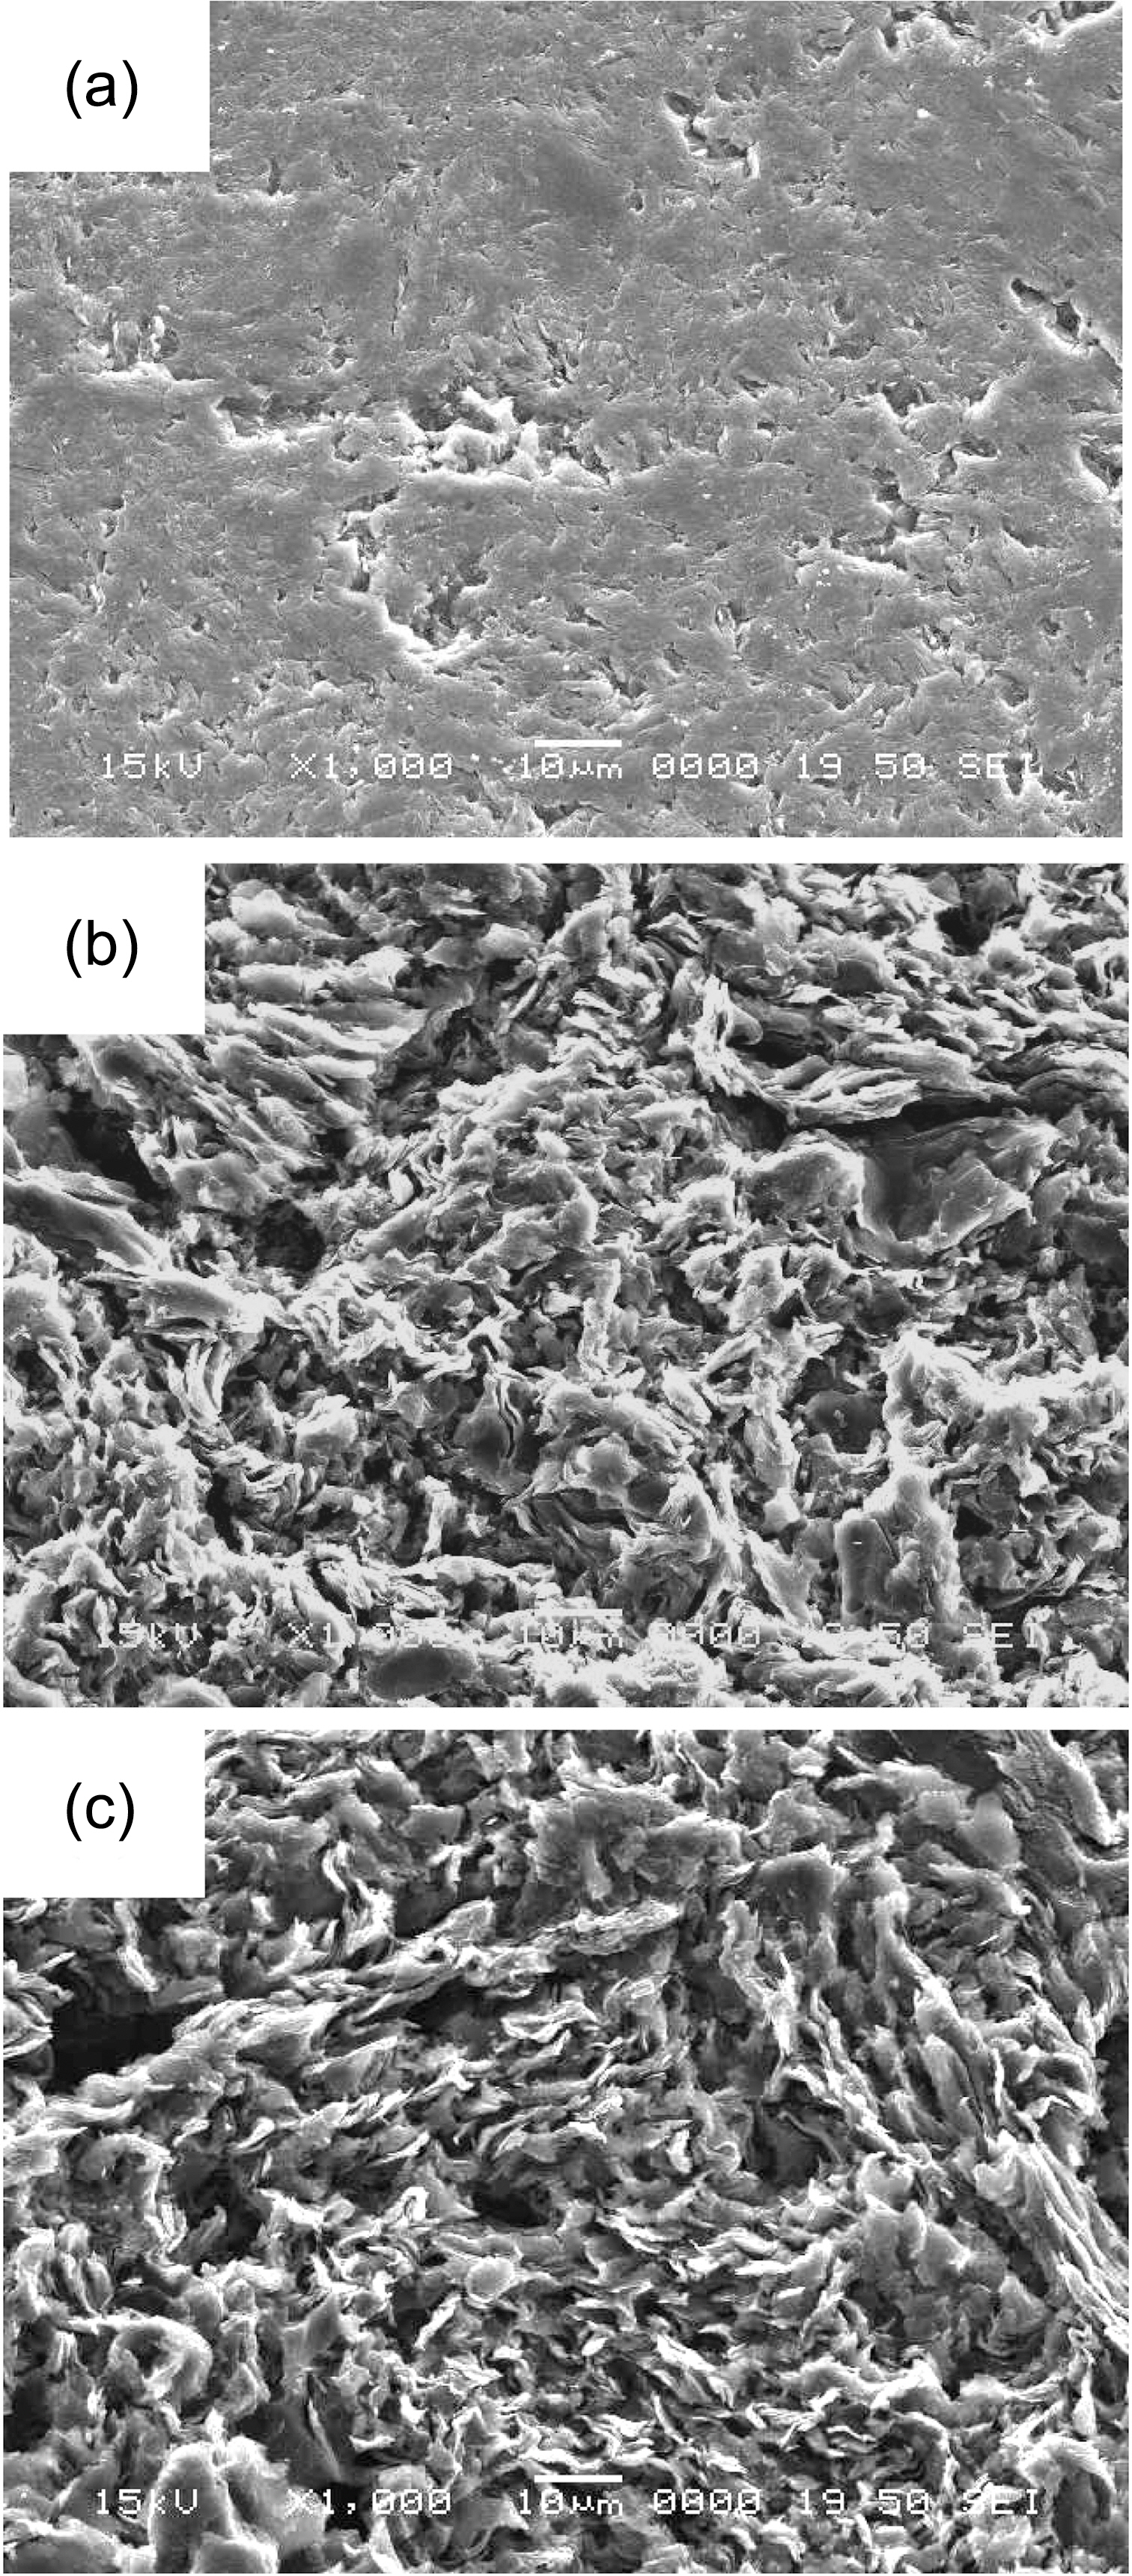
Figs. 2-5 show surface microstructures of IG-430, PCEA,IG-110 and NBG 18 with different oxidation degrees. It is shown that the 0% specimen has the surface covered with glassy materials and the 5% and 10% specimens, whereas,have the high roughness of the surface without glassy materials. Same phenomenon was also observed at the wall of the pore as shown in Fig. 6. Fig. 6(a) shows a pore (dark contrast) formed between filler particles (gray contrast) in the 0% oxidized PCEA and Fig. 6(b) shows the SEM image taken from the inside wall of the pore of 5% oxidized
PCEA. Non-oxidized PCEA (Fig. 4(a)) shows glassy wall of the pore and 5% oxidized PCEA (Fig. 4(b)), however,shows the wrinkled and rough surface without glassy materials.
In Fig. 2 IG-430 specimens with 5% and 10% weight loss show the large grains which seem to be a graphitic filler particle. PCEA specimen in Fig. 3 exposed the tiny crystallites although the grain size of PCEA is large(~360 ㎛). Also IG-110 and NBG-18 specimens exposed the tiny crystallites in Figs. 4 and 5, respectively, although the grain size of IG-110 is small (~10 ㎛) and NBG-18 is large (over 300 ㎛).
Artificial graphite is composed of binder, filler and crushed
filler. Easily graphitizing materials such as petroleum coke are commonly chosen as a filler material in the manufacture of nuclear graphite [9]. The petroleum coke as a filler is expected to be fully graphitized after heat treatment at 3000°C. And different binder pitches have been used for the fabrication of nuclear graphite by different manufacturers. It was reported that the oxidation of nuclear graphite take place at binder phase preferentially and then subsequently at the coarse filler particles [25,26]. In a previous our research, as a result of Raman analysis, the overall crystallinity of the specimen increased after oxidation. It means that the binder materials are oxidized first since they have low crystallinity compared to the filler phase [27].
Therefore it can be considered that oxidation reaction takes place first at the binder phase which may exist between grains, and then it does subsequently at surface of grains which consist of graphitic filler particles as shown in Figs. 2-5. Also it is thought that the reason why two types of graphites have a different oxidation mechanism is not only the different grain size but also different precursor types and
[Table 2.] Structural Parameters of Nuclear Graphites Obtained from XRD Analysis
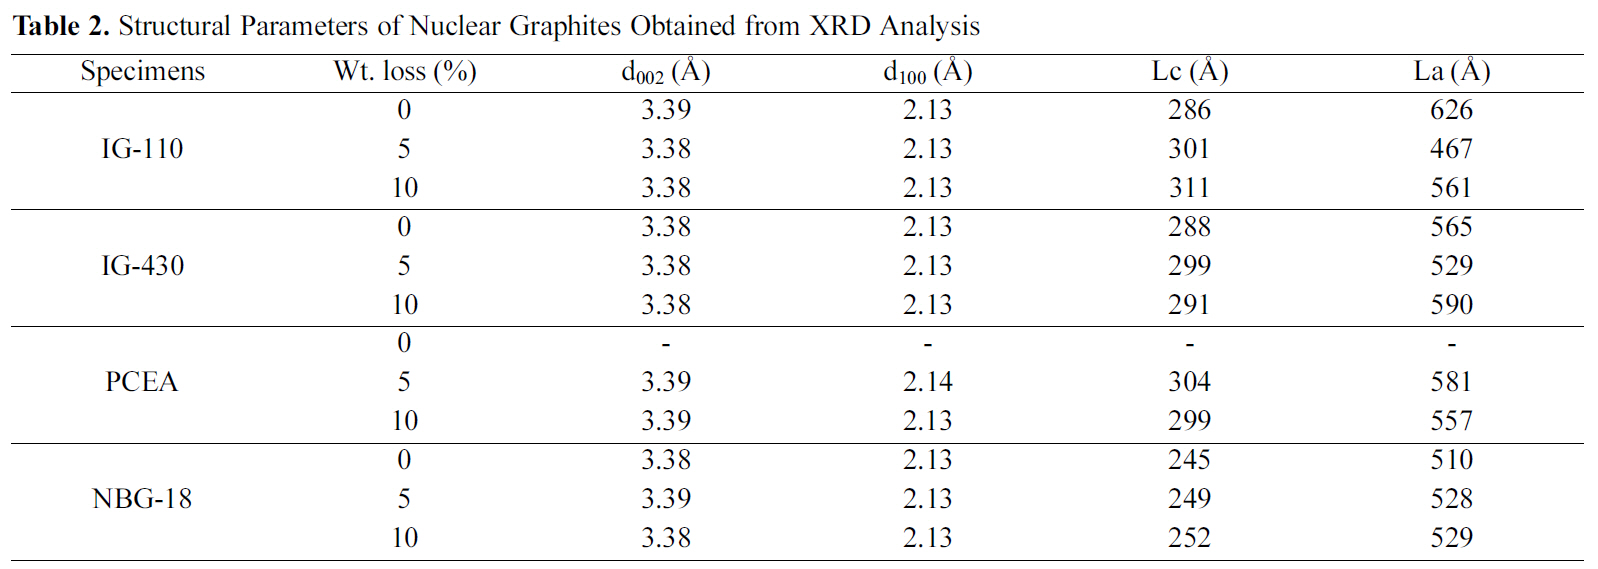
Structural Parameters of Nuclear Graphites Obtained from XRD Analysis
manufacturing process.
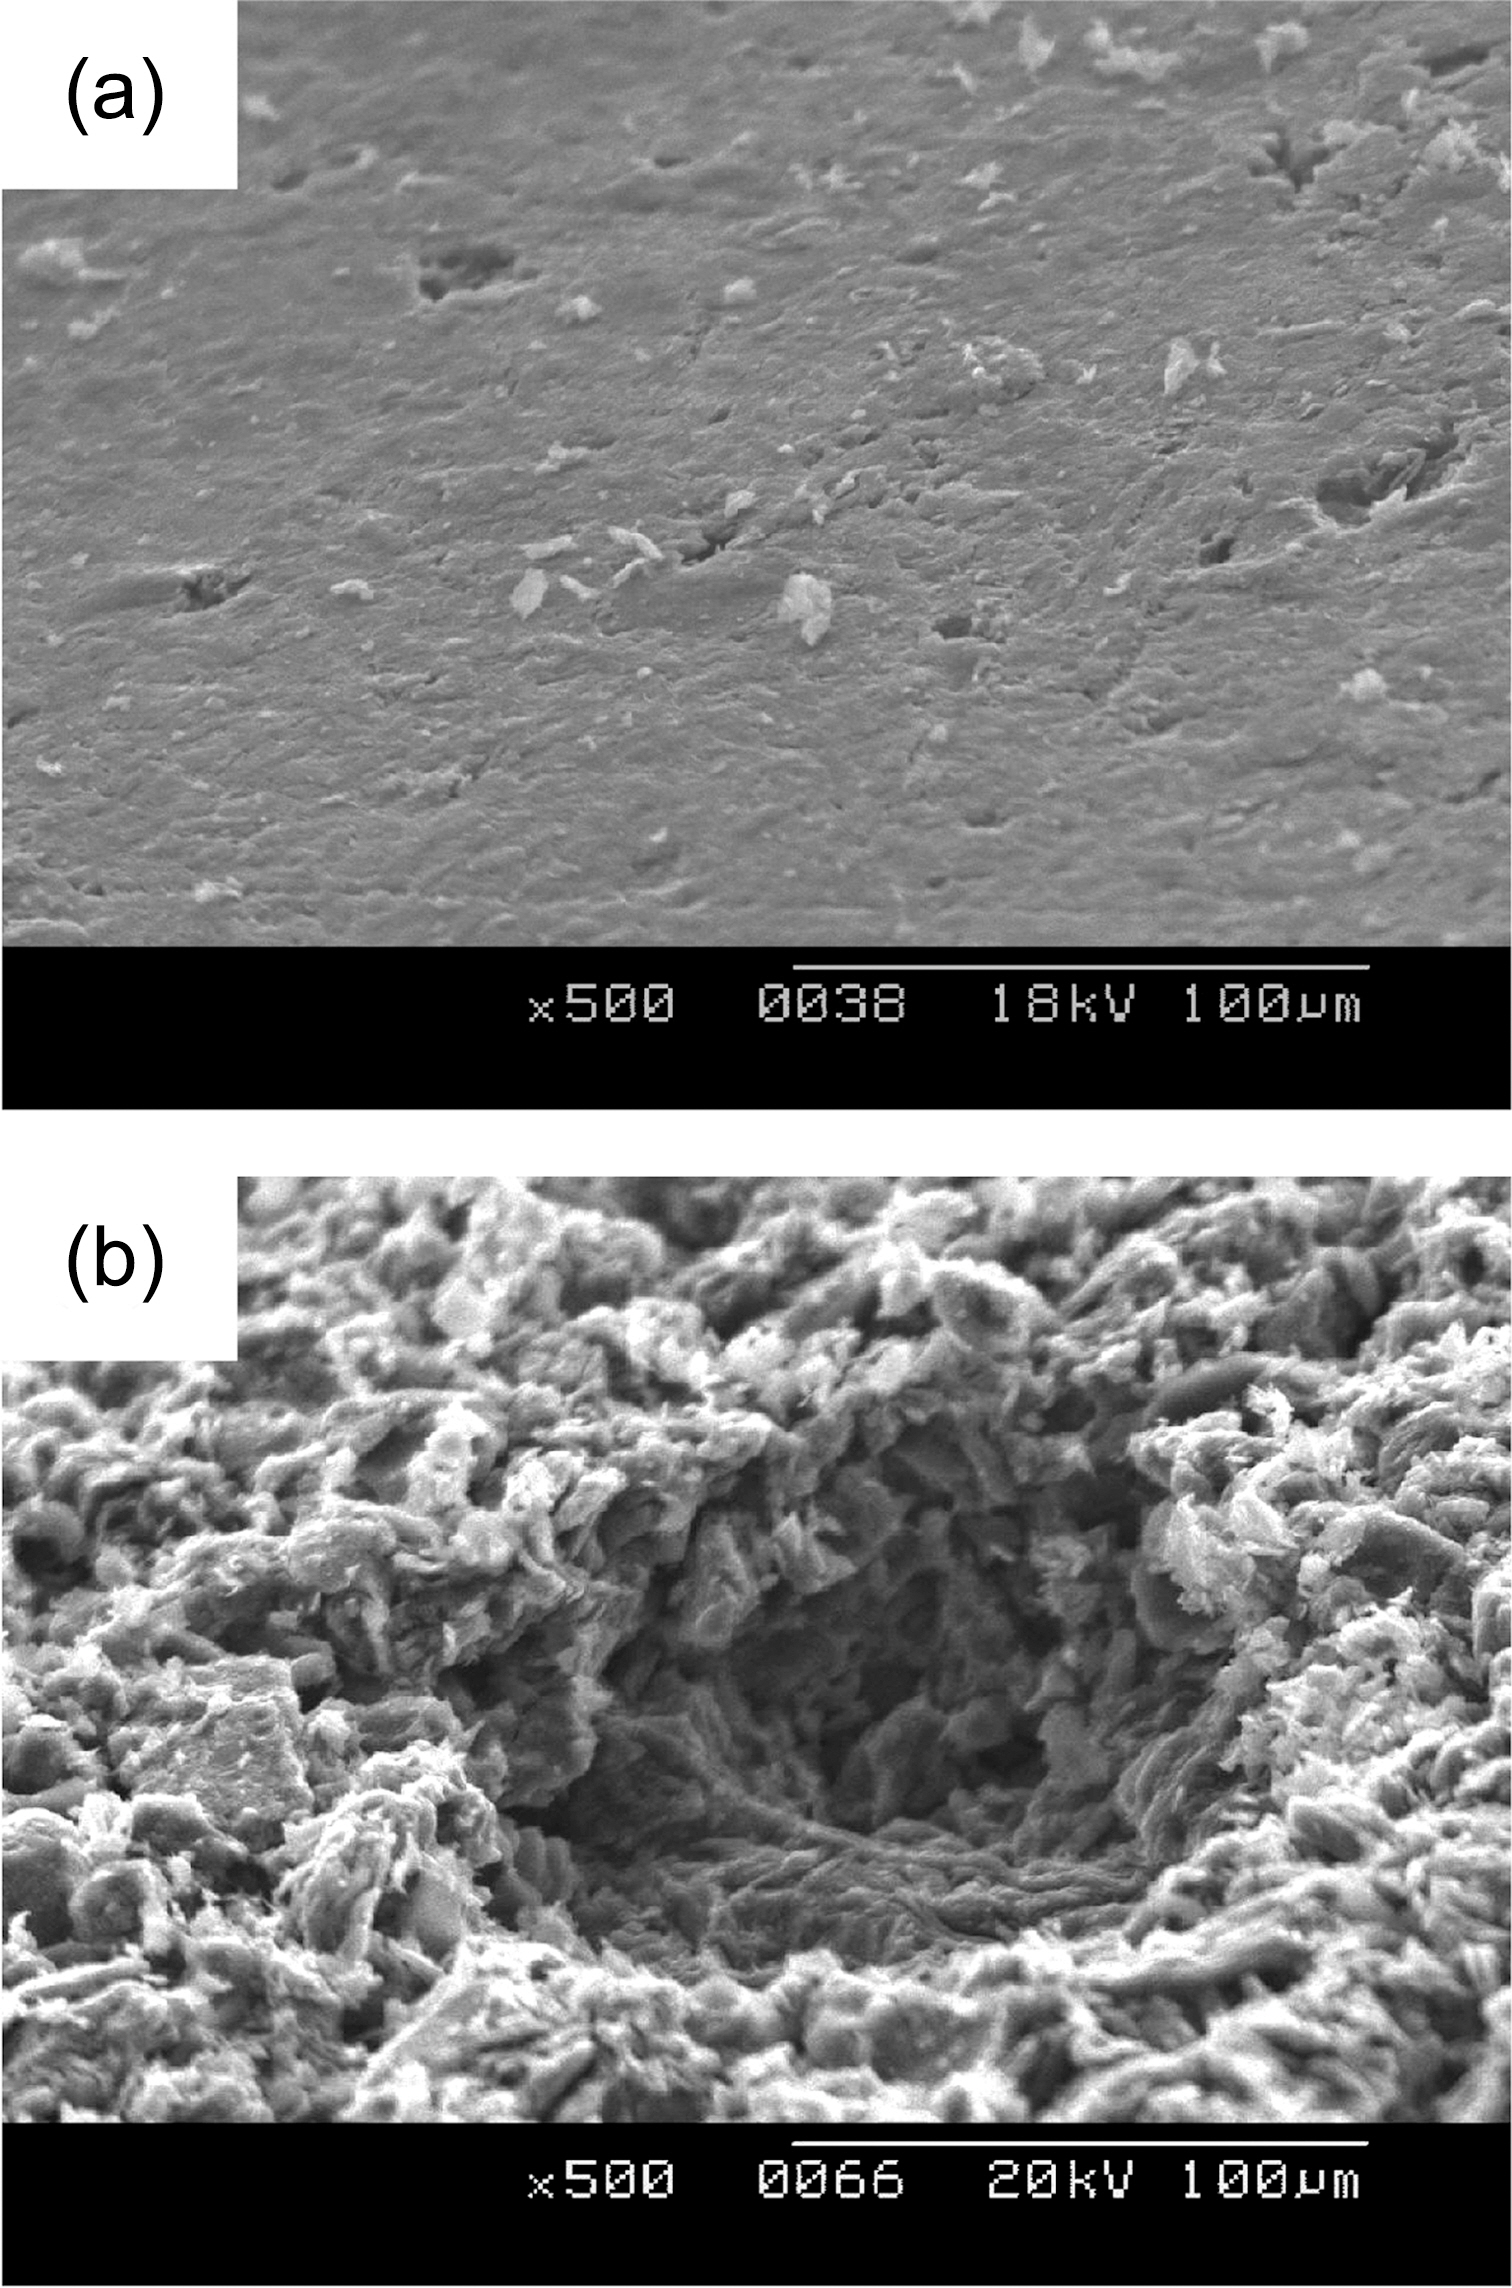
Fig. 7 shows that the pore development of IG-430 is quite different with that of PCEA. As shown in Figs. 1 and 6, the pore of PCEA was developed by widening and growth of the existed pore. However it seems that the pore of IG-430 was developed by break-off of the grain cluster due to weakening of a binder phase through oxidation.
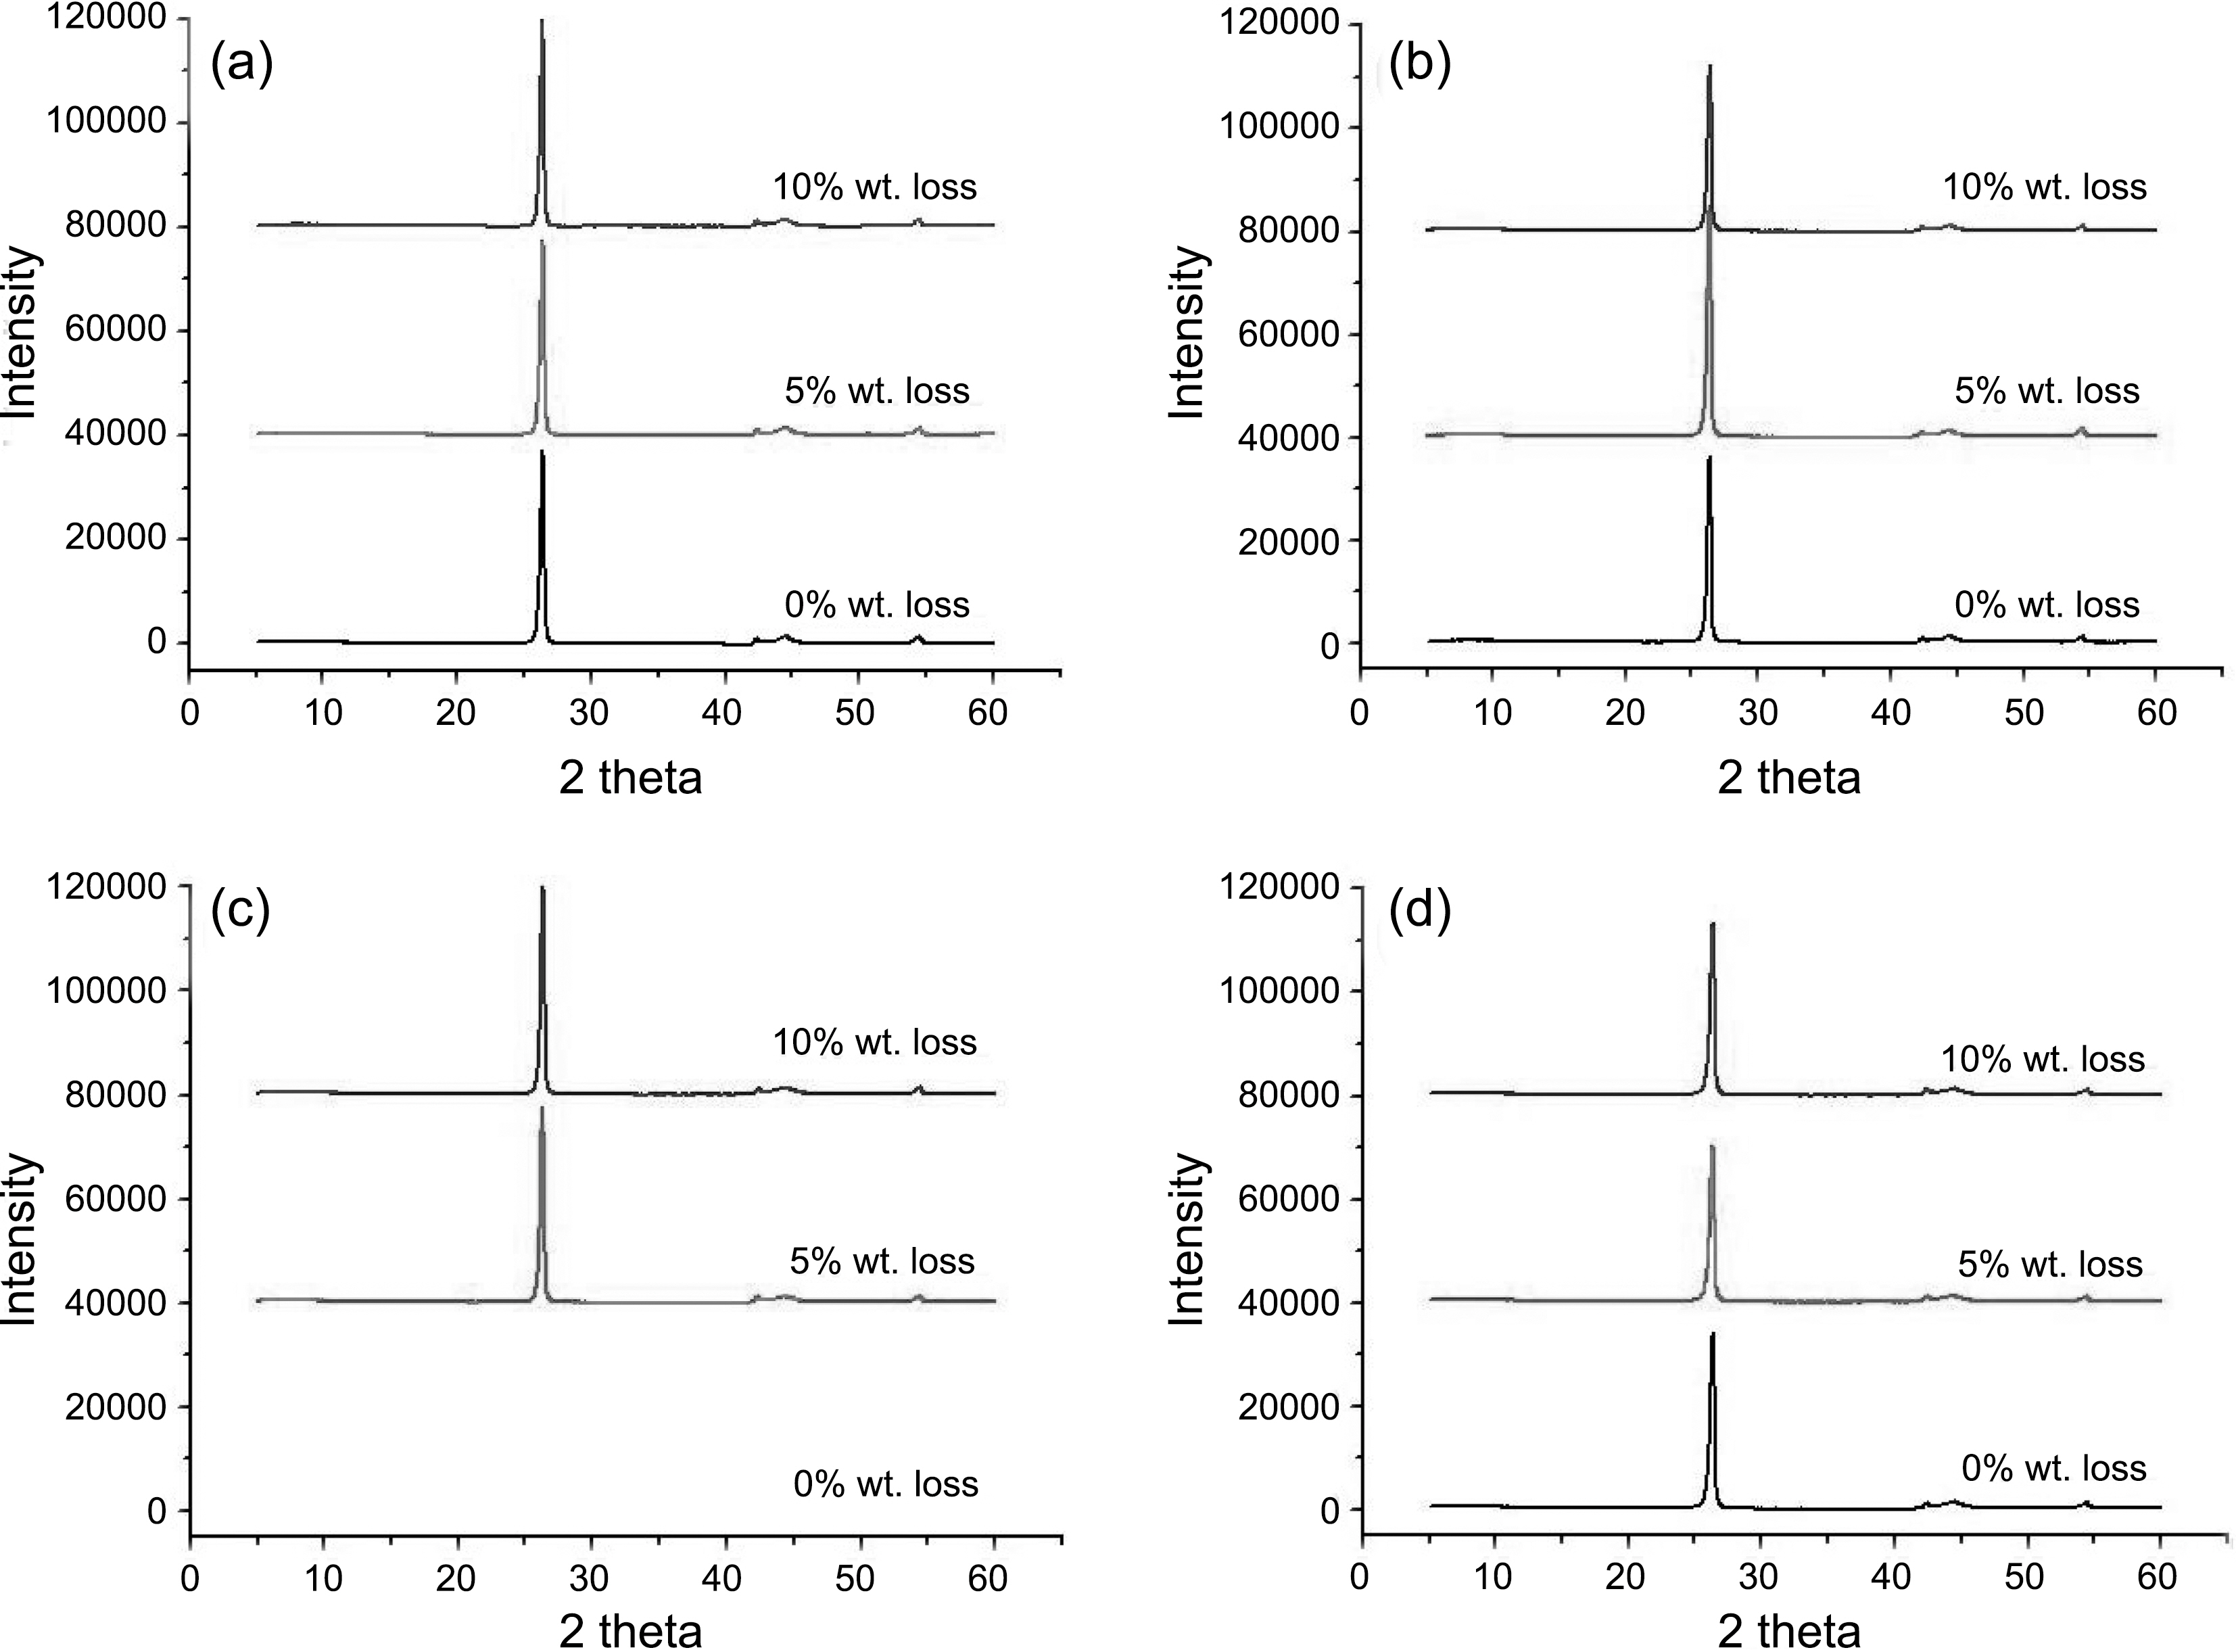
The XRD patterns following the oxidation degree were achieved as shown in Fig. 8. The XRD pattern of the nonoxidized(0% wt. loss) PCEA could not be obtained due to damage of specimen during keeping. PCEA specimens with 5% and 10% weight loss were examined to improve the curve fitting correlations in graphs. It seems there is almost no significant change in the XRD patterns after oxidation compared to 0% samples.
The structural parameters (d002, d100,
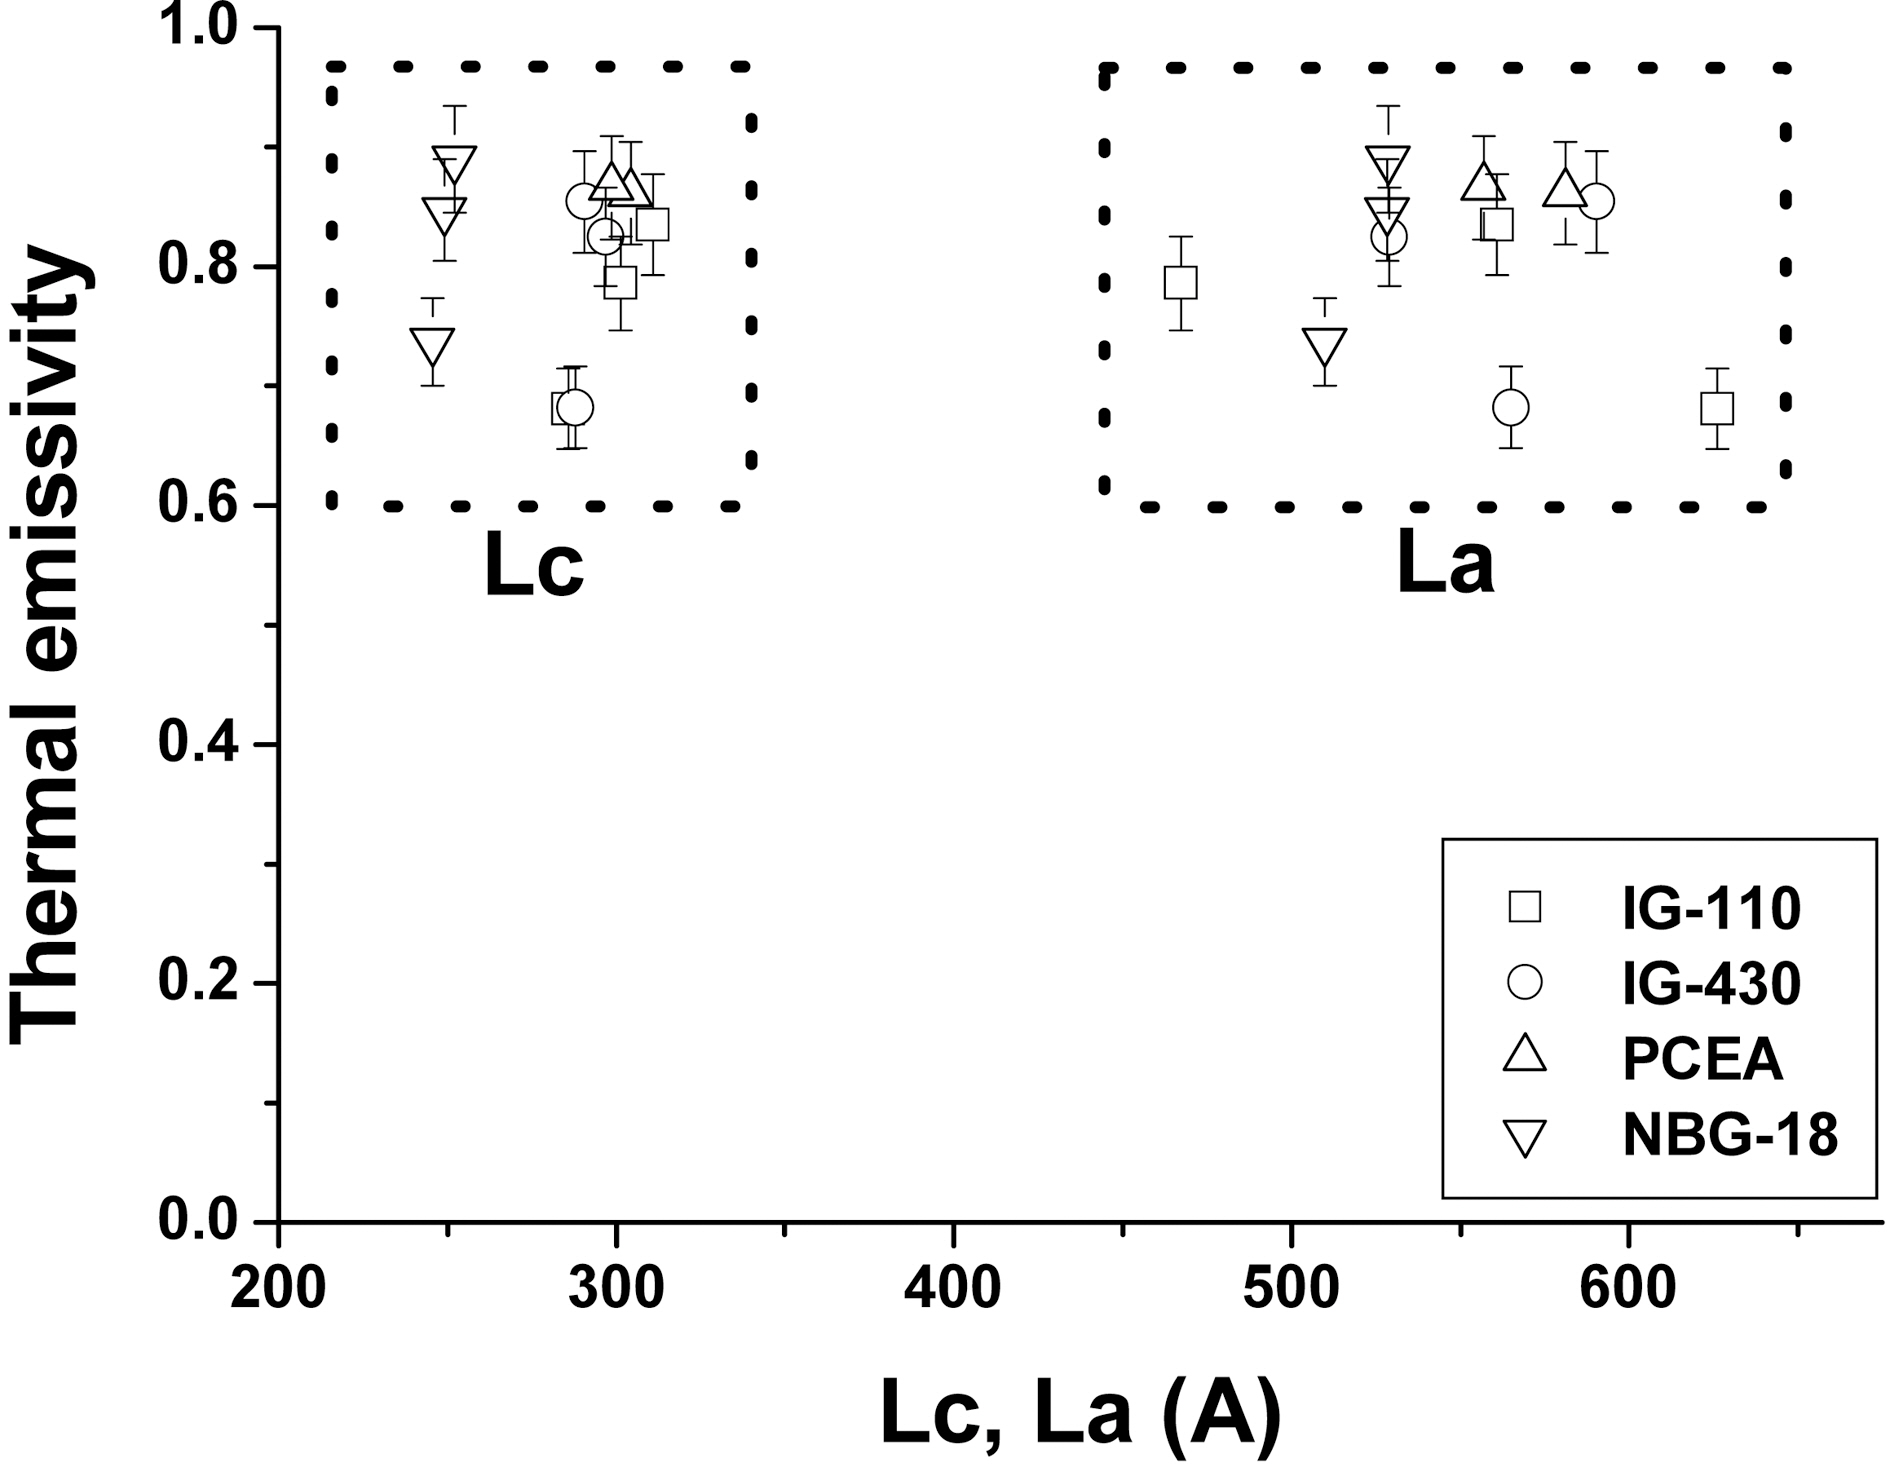
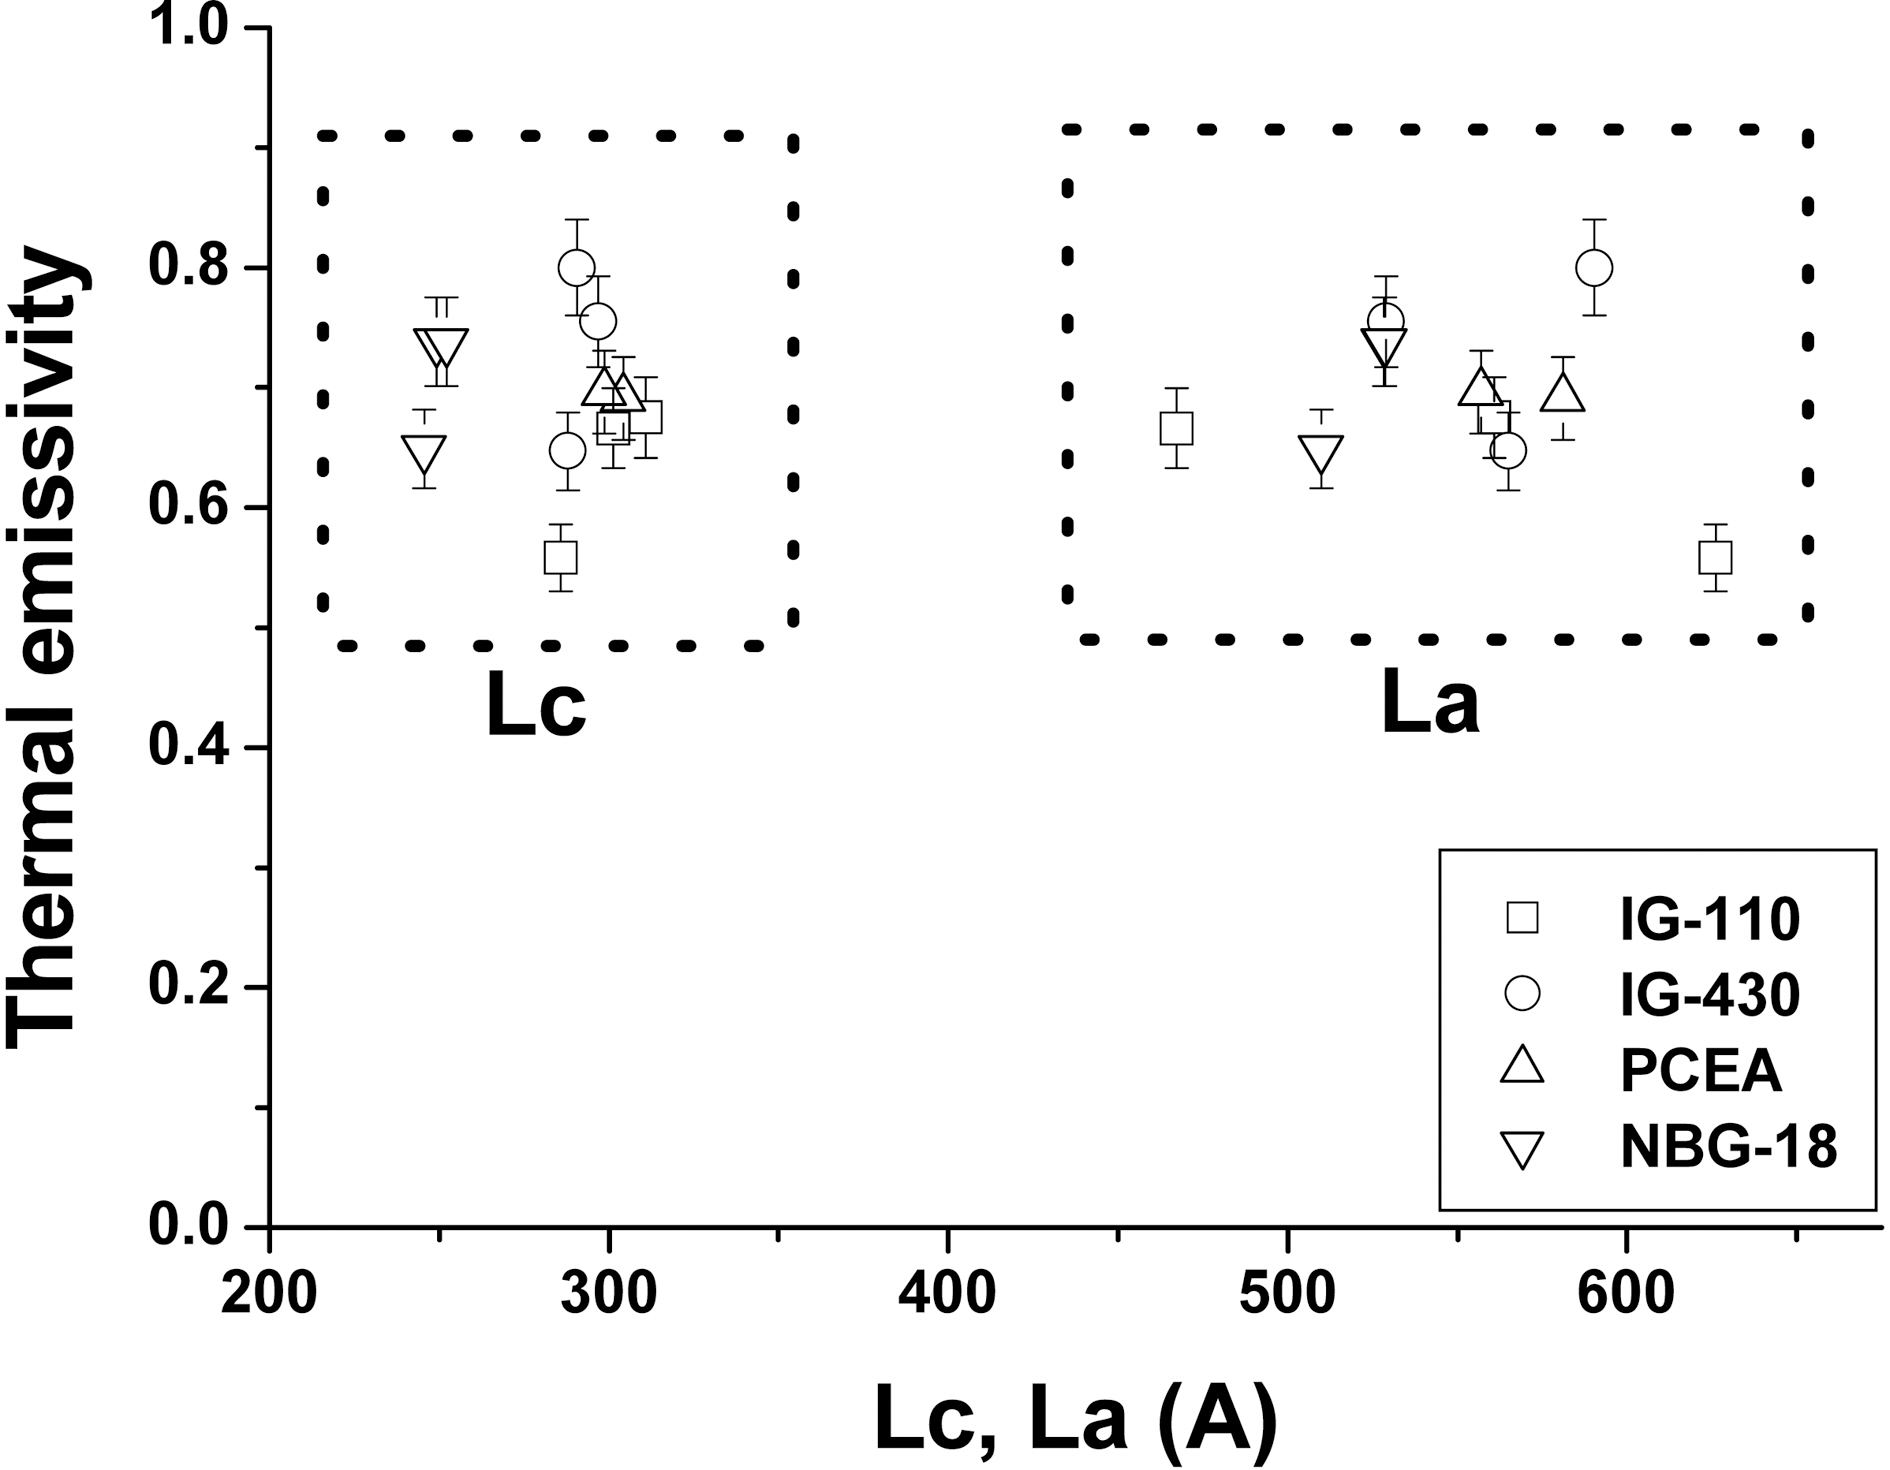
There was a slight change in crystallite size after oxidation compared to non-oxidized specimens. Lc and La values of the 0% specimens were in the range of 245 to 288 A and 510 to 626 A, respectively. The Lc and La values of the 10%oxidized specimens were in the range of 252 to 311 A and 529 to 590 A, respectively.
3.3. Thermal emissivity and crystallite size
Figs. 9 and 10 show relationships between Lc and La and thermal emissivity measured at 100oC and 500oC, respectively.In the previous Raman analysis, the overall crystallinity of the specimen increased after the oxidation and the thermal emissivity also increased as the crystallinity increased [19].However, it seems that there is no relationship between the thermal emissivity and the size of crystallites from the XRD analysis although this is different result with the aforementioned SEM analysis.
Thermal emissivity is the intrinsic property of the material which is dependant on the surface conditions such as surface roughness, particle size, surface oxidation, and surface functional groups. Since the information through Raman analysis comes from the outermost surface of the specimen the Raman signal can be changed as the crystallinity change by oxidation.
The XRD, whereas, gives the information of the deeper position from the surface rather than Raman instrument.Since nuclear graphite has normally isotropic structure the bulk of graphite may behave as the randomly oriented powders. Furthermore the binder phase which has less crystllinity cannot contribute to XRD peak intensity than the filler particle which has graphitic structure. Therefore the XRD signal almost cannot be changed even though the outermost surface state has been changed.
It is, therefore, thought that the use of the Raman
instrument or SEM is more effective to analyze the effect of specimen surface on the thermal emissivity than X-ray diffractometer in the study of a nuclear graphite oxidized at low temperature at which the structural parameters show little changes. Quantitative measurement of the surface roughness will be compared to the Raman and SEM results and the more effective analysis of surface effect on the thermal emissivity also be reported in the next study.
Thermal emissivities of nuclear graphites (IG-110, PCEA,IG-430 and NBG-18) following changes in oxidation degrees were studied. The graphites were oxidized to 5%and 10% weight loss in air flow of 5 L/min at 600oC in a furnace. This work was conducted to study the relationships between thermal emissivity of nuclear graphites and its surface structural change by oxidation using SEM and XRD analysis. The results obtained in this study are as follows.
The non-oxidized 0% specimen had the surface covered with glassy materials and the 5% and 10% oxidized specimens have shown rougher surface without glassy materials. And the binder materials were oxidized first.
002 and 100 interlayer spacings of all samples have almost no changes after oxidation compared to 0% specimens. The 002 interlayer spacings of the 0% specimens and the oxidized specimens were about 3.38~3.39 A. The 100 interlayer spacing of the 0% specimens and the oxidized specimens were about 2.13 A and 2.13~2.14 A, respectively.
There was a slight change in crystallite size after oxidation compared to non-oxidized specimens.
It was difficult to find a relationship between the thermal emissivity and the structural parameters obtained from the XRD analysis. It is thought that the use of the Raman instrument or SEM is more effective to analyze the effect of specimen surface on the thermal emissivity than X-ray diffractometer in the study of a nuclear graphite oxidized at low temperature at which the structural parameters show little changes.

![Summary of Thermal Emissivity Data [1819]](http://oak.go.kr/repository/journal/10383/HGTSB6_2011_v12n1_8_t001.jpg)
![SEM microstructures of nuclear graphites oxidized in0% 5% and 10% weight loss respectively (×50) [18]. SEM:scanning electron microscope.](http://oak.go.kr/repository/journal/10383/HGTSB6_2011_v12n1_8_f001.jpg)