A concern for the need of an alternative to gasoline and clean fuel has prompted the consideration of hydrogen as a possibility, which instead of causing pollution when burnt in the air; produces water. Comparison of density of energy of hydrogen with gasoline also favors the choice of hydrogen as a fuel. On weight basis, hydrogen has nearly three times the energy content of gasoline (120 MJ/kg for hydrogen versus 44 MJ/kg for gasoline). However, on volume basis the situation is reversed (8 MJ/l for liquid hydrogen versus 32 MJ/l for gasoline).Hence, storage of hydrogen under cryogenic condition is not preferred.
However, possible methods for hydrogen storage are:compression of gas, liquefaction, metal hydrides and adsorption by carbon nanomaterials (CNM). Since at atmospheric pressure one gram of hydrogen gas occupies 11 liters (2.9 gallons) of space; storing it in gaseous form in a smaller portable vessel requires several hundred atmospheres pressure. For this purpose a strong and heavy container is required. In addition, hydrogen storage capacity should meet the target value set by the US Department of Energy’s (DOE)hydrogen plan which requires a system-volume efficiency(the ratio of stored hydrogen to system volume) of 63 kg H2/m3 and weight efficiency (weight of stored H2/system weight) of 6.5 wt% for a practical hydrogen fuel cell-driven vehicle [1,2]. Therefore, development of an efficient storage material using a lighter container is needed. Considering these aspects, amongst the various materials, adsorption of hydrogen by CNM appears to be promising because of its low density, high strength, and ultrahigh surface-to-volume ratio.
If CNMs are to be used for this purpose, there is a need to select the best form of CNM (e.g. carbon nanotubes, carbon nanobeads,carbon fibers etc) which can adsorb hydrogen of required amount. The process of synthesis should also be economical.Amongst the various techniques used for the synthesis of CNM, chemical vapor deposition technique or pyrolysis technique seems to be most economical and easy process.
Precursors for CNM synthesis has been mainly from petroleum product, which are heading for extinction. Sharon and his group initiated the research [3-8] to investigate the possibility of using plant derived precursors for the synthesis of CNM because plant tissues contain oils, lipids,carbohydrates, cellulose, lignin etc, which are rich source of carbon. Moreover, plant can be cultivated as and when desired. Thus there will be no fear of its extinction. Sharon et al. [9] have observed that amongst the carbon fibers obtained from the various plants, cotton fiber seems to show better result for the hydrogen adsorption. Hence a detail study on the preparation of carbon fiber from cotton and its hydrogen adsorption capacity measurement were undertaken.
1.1. Taguchi optimization technique
There are various parameters in pyrolysis technique that controls the growth of carbon nanotubes e.g. source of carbon (hydrocarbon), catalyst, temperature, environment, flow rate of carrier gas, catalyst support and duration etc. With such large number of variable parameters, one would need to conduct many experiments to find out the best parameters giving the desired products. Taguchi optimization technique utilizes very small number of experiments to predict the best parameters to get the desired products. For example, if there are four variable parameters and each parameter has many variables, one would need a minimum of 24 experiments to get some idea about the best conditions to get the desired products. Taguchi optimization technique on the other hand,needs only 9 experiments to get this information.
Details of the Taguchi optimization technique is discussed elsewhere [10-12] however; a brief description is given here.
Basic unit of this methodology is the calculation of “signal to noise (S/N)” ratio. There are three major ways to use this methodology: (i) “smaller the better” i.e. when the interest is to find the best parameters to get the minimum amount of the desired product, (ii) “nominal the better” i.e. when interest is to get the exact amount of the desired product and (iii) “larger the better” i.e. when interest is to get the largest amount of the desired product. Since we are interested in getting the largest amount of adsorption of hydrogen by CNM, “larger the better” technique has been used in the present work and the same is discussed here.
The S/N ratio is calculated using the formula given for“l

Where
To determine the effect of each parameter level (mi),average value of S/N ratios is calculated for each parameters using analysis of mean. For this calculation, the S/N ratios of each experiment with corresponding parameter levels are employed

Where,
The impacts of parameters, i.e. the contributions of each experimental parameter to the quality characteristic are calculated by the analysis of variance (ANOVA). This is done by summing of squares (SoS) of variance of all levels of a given parameters which then is normalized with respect to the degrees of freedom (DoF) of the corresponding process parameters (DoF = number of parameter levels-1).The relations that are used to determine the sum of the squares and the factor effect are given by Eq. (3):
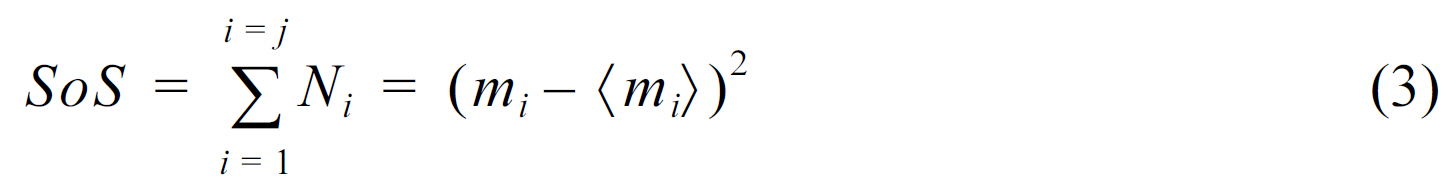
Where mi gives the average of the levels contributions for each parameters levels to S/N ratio,

Since earlier study with carbon obtained by pyrolysis of cotton fiber was made at a fixed temperature of 850oC as well as hydrogen storage study was made at low pressure(not published), it was thought to synthesize cotton fiber by varying the parameters of the pyrolysis process by utilizing Taguchi optimization method and study hydrogen adsorption at higher hydrogen pressure. This paper discusses the results obtained under these conditions.
2.1. Pre-treatment of the precursor
Some time, pre-treatment is necessary to activate carbon so that its adsorption capacity increases. For pre-treatment, the cotton fiber was suspended in 0.1M solution of nickel nitrate and iron (III) nitrate for 3 h at room temperature. This treated fiber was then dried at 50oC and used for the pyrolysis.
2.2. Synthesis of carbon materials from cotton
Synthesis of Carbon materials from cotton fibers was

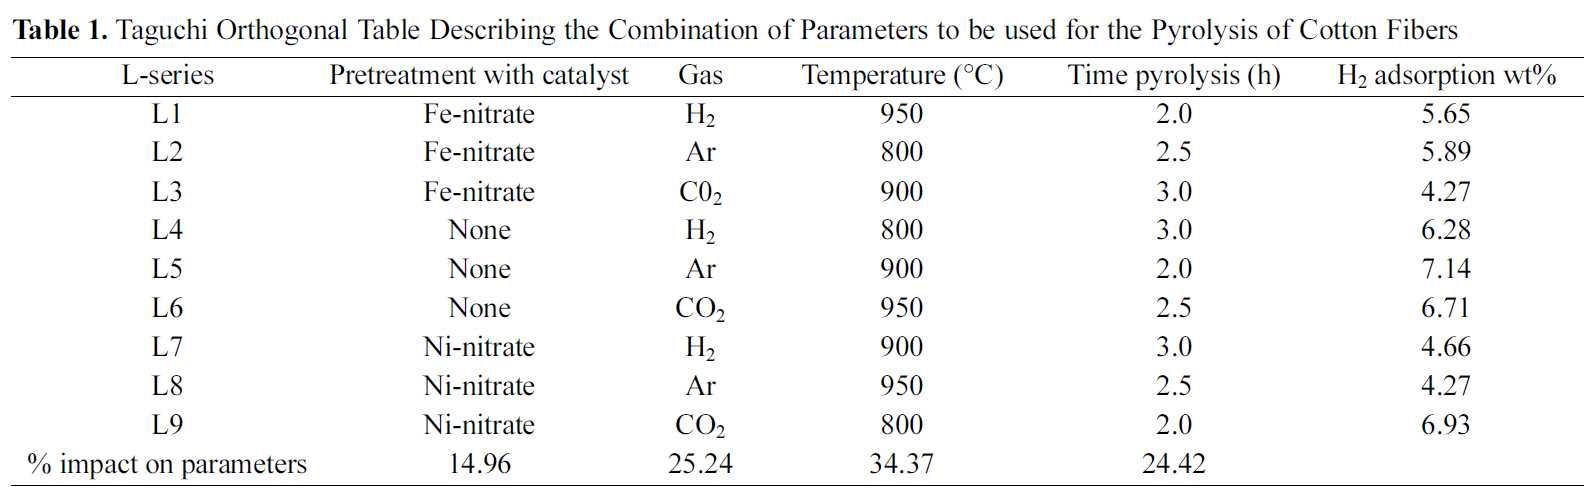
Taguchi Orthogonal Table Describing the Combination of Parameters to be used for the Pyrolysis of Cotton Fibers
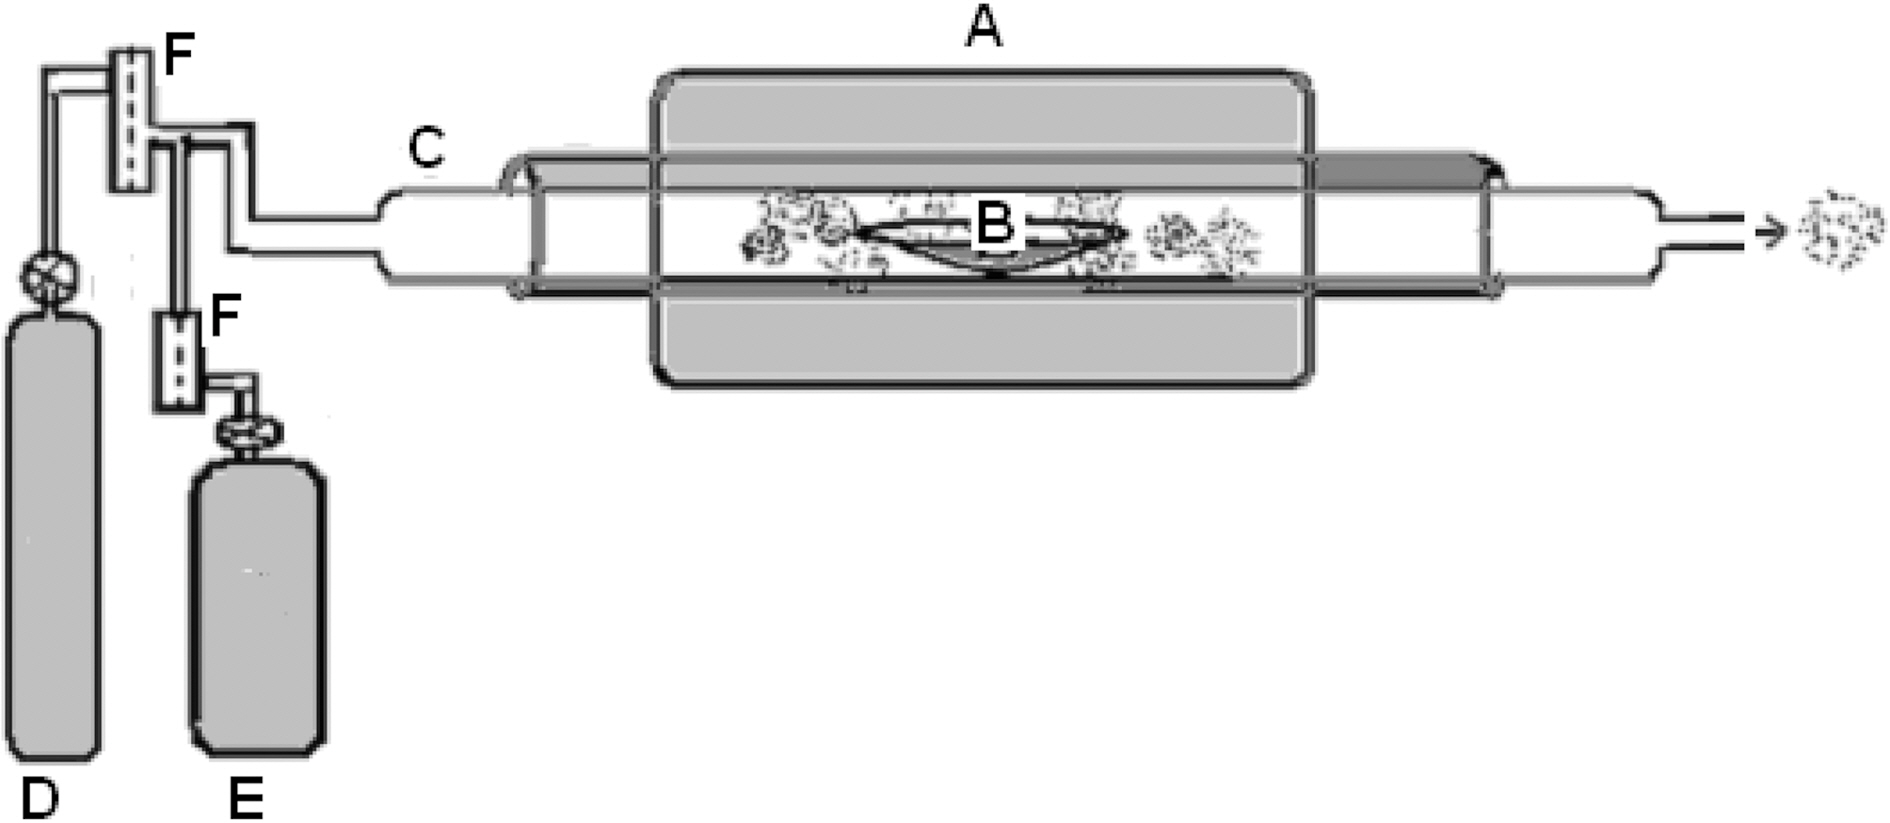
carried out by pyrolysis technique. The furnace used for the pyrolysis is shown in Fig. 1. Details of the unit are given in legend of the figure which is self-explanatory.
Since the number of variable parameters of the pyrolysis process was 4 (e.g. pretreatment of fiber, temperature of pyrolysis, type of gas, duration) it was decided to apply Taguchi optimization technique to synthesize carbon fibers from cotton. Taguchi optimization technique requires formation of an orthogonal Table 1. Cotton fibers were pyrolyzed under the various conditions as given in Table 1. These carbon fibers were then used for studying hydrogen adsorption.
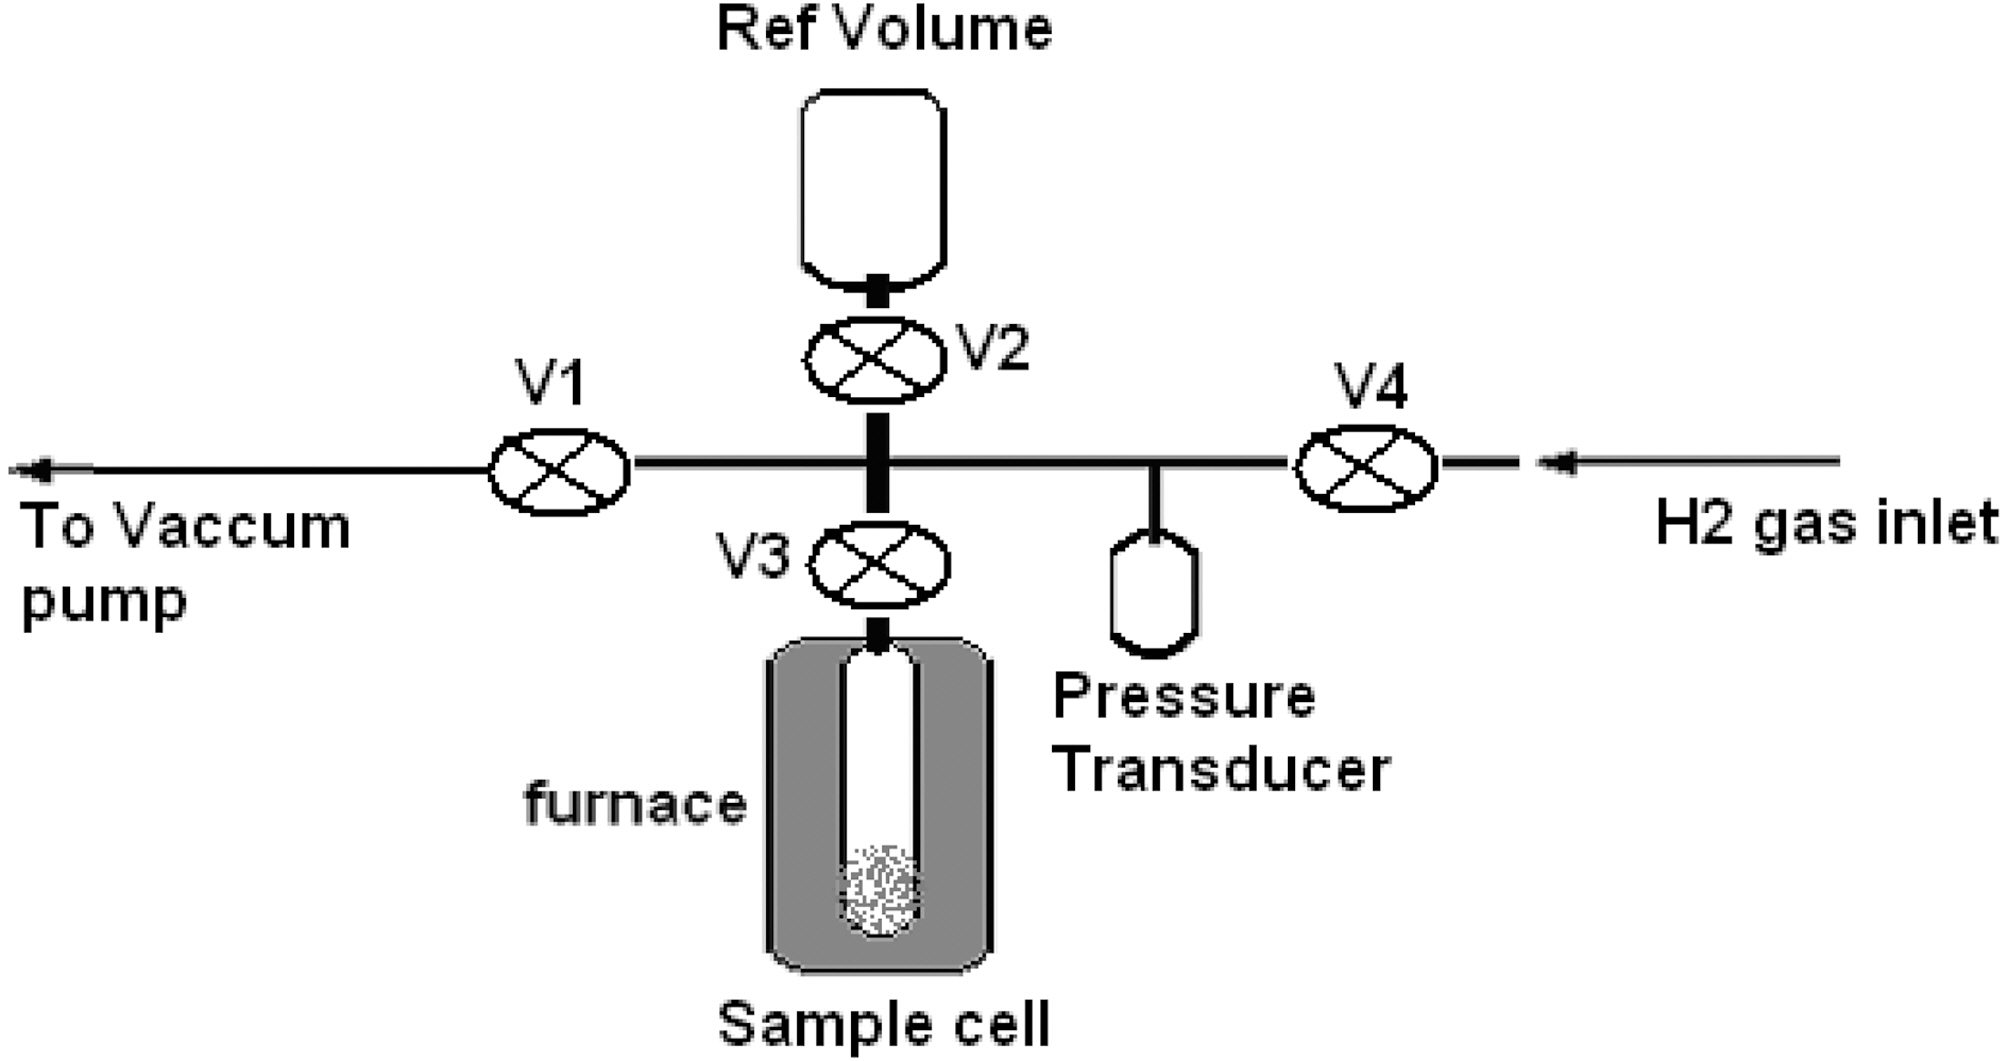
2.2. Hydrogen storage measurement
Hydrogen storage was measured by using a Seivert’s apparatus (Fig. 2). The unit is made up of stainless steel tubes, needle valves, tees and elbow joints (Nova,Switzerland). Strain gauge based pressure transducer is used to measure hydrogen gas pressure in the system (Syscon,India) which works in the pressure range 0 to 100 bar. In the diagram, needle valves are represented as V with different suffixes to designate the various valves. The reference volume (Ref Volume) is a container for storing the hydrogen gas, which is attached with the valve V2. V4 is used to allow the hydrogen gas into the system. Valve V3 is used to isolate the reactor from the sample cell. Vacuum pump is connected to the unit through the valve V1. The accuracy of the pressure transducer is ±0.1 bar sample cell is specially designed to withstand high pressure and high temperature,which is housed inside a furnace. The temperature of the furnace is controlled by PID (proportional-integralderivative)with an accuracy of ±0.1oC.
To check any leakage, the apparatus was filled with hydrogen gas at a pressure of 30 bar by opening the valve V4, V2 and V3, and keeping valve V1 closed. Absence of any change in pressure over a time period of 2 h suggested the system to be leak proof. The joints were checked by using soap water.
A known weight of the carbon fiber as prepared under conditions given in Table 1 was introduced in the sample
cell. The apparatus was then evacuated to 10-3 bar by closing valve V4 and opening valve V1 and the sample cell was heated to 200oC for 2 h. This was done to remove any adsorbed gases by the carbon fiber. The sample cell was then allowed to cool down to room temperature while valve V1 was connected to the pump.
Hydrogen gas was filled in the reference volume to 60 bar pressure by closing valve V1 & V3 and opening valve V4 and V2. System was allowed to attain equilibrium at room temperature (this pressure was considered as initial pressure).The gas was then allowed to expand into the sample cell by opening valve V3. After equilibrium is reached the final pressure (Pf ) was recorded. This pressure is considered as final pressure. From these two pressures, volume of the sample cell and the weight of carbon fiber, the amount of hydrogen adsorbed by carbon fiber was calculated in terms of wt%. In order to calculate the volume of carbon fiber occupying in the sample tube, its density was determined by tapping method.
3.1. Characterisation of carbon fiber
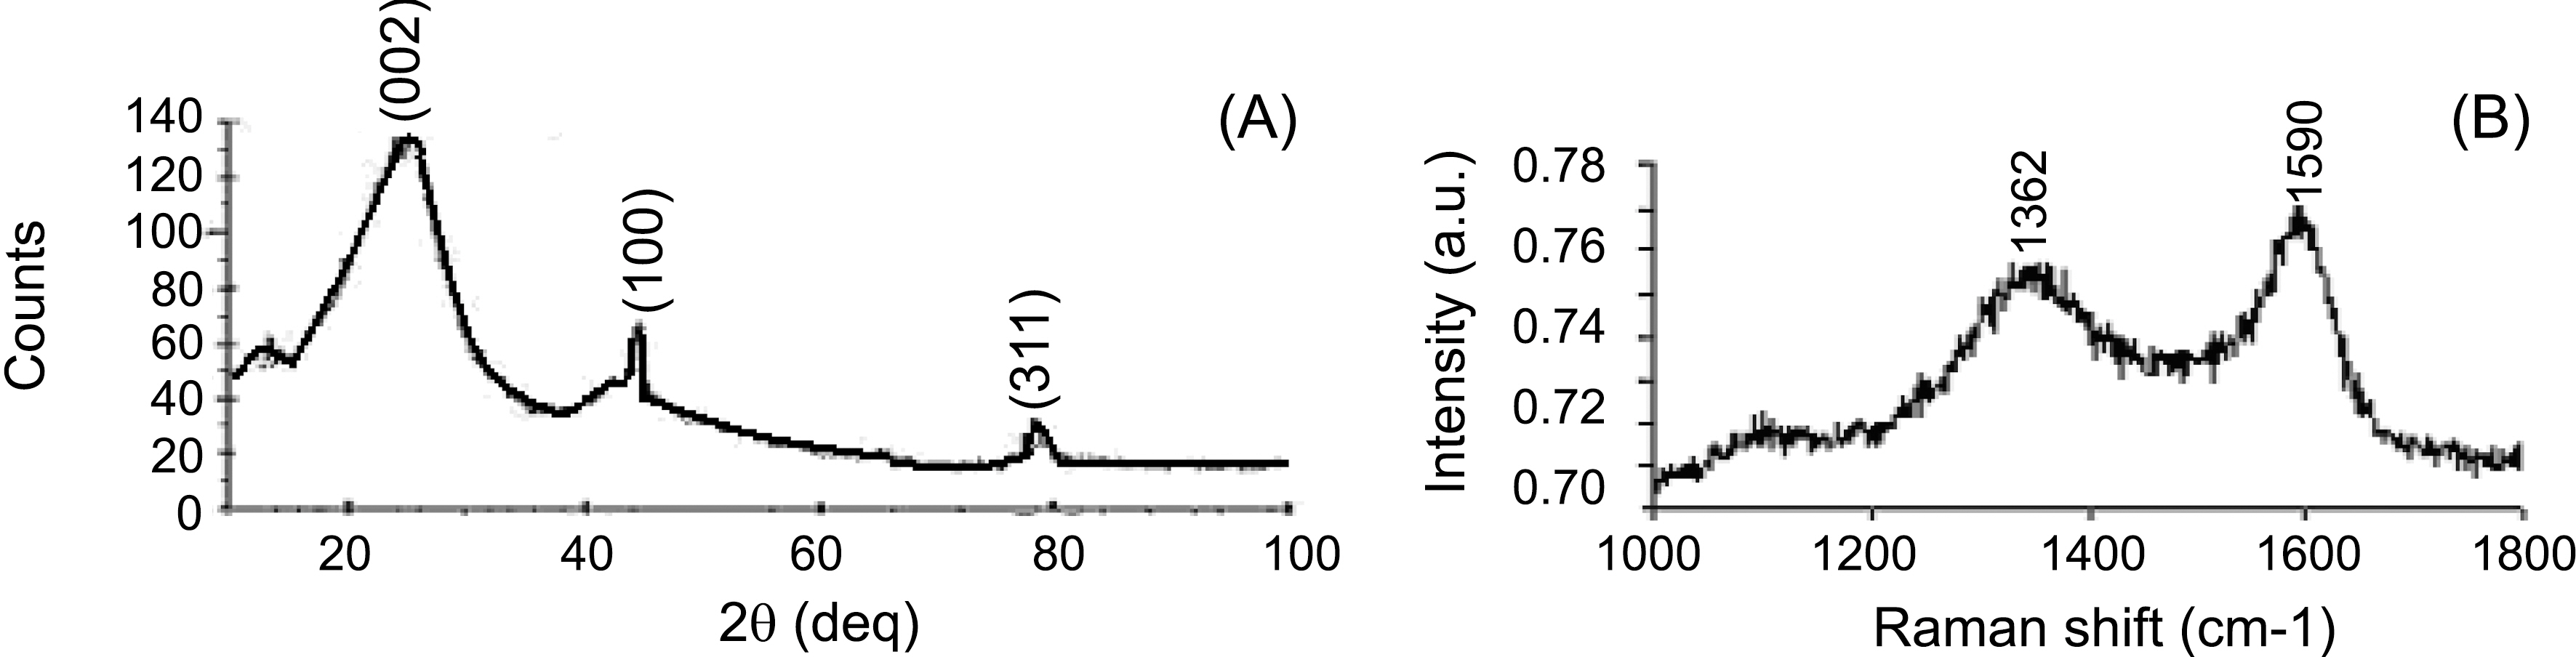
The fibers obtained from cotton were analyzed by X-ray
diffraction (XRD) and Raman (Fig. 3). The XRD of carbon fiber shows a broad peak at 26 two theta corresponding to(002) plane and one sharp peak at 44.62 two theta corresponding to (100) plane.
A Raman spectrum (Fig. 3(b)) shows one peak at 1590 cm-1 and other at 1362 cm-1 which are the characteristic for graphitic material containing some disorder structure.
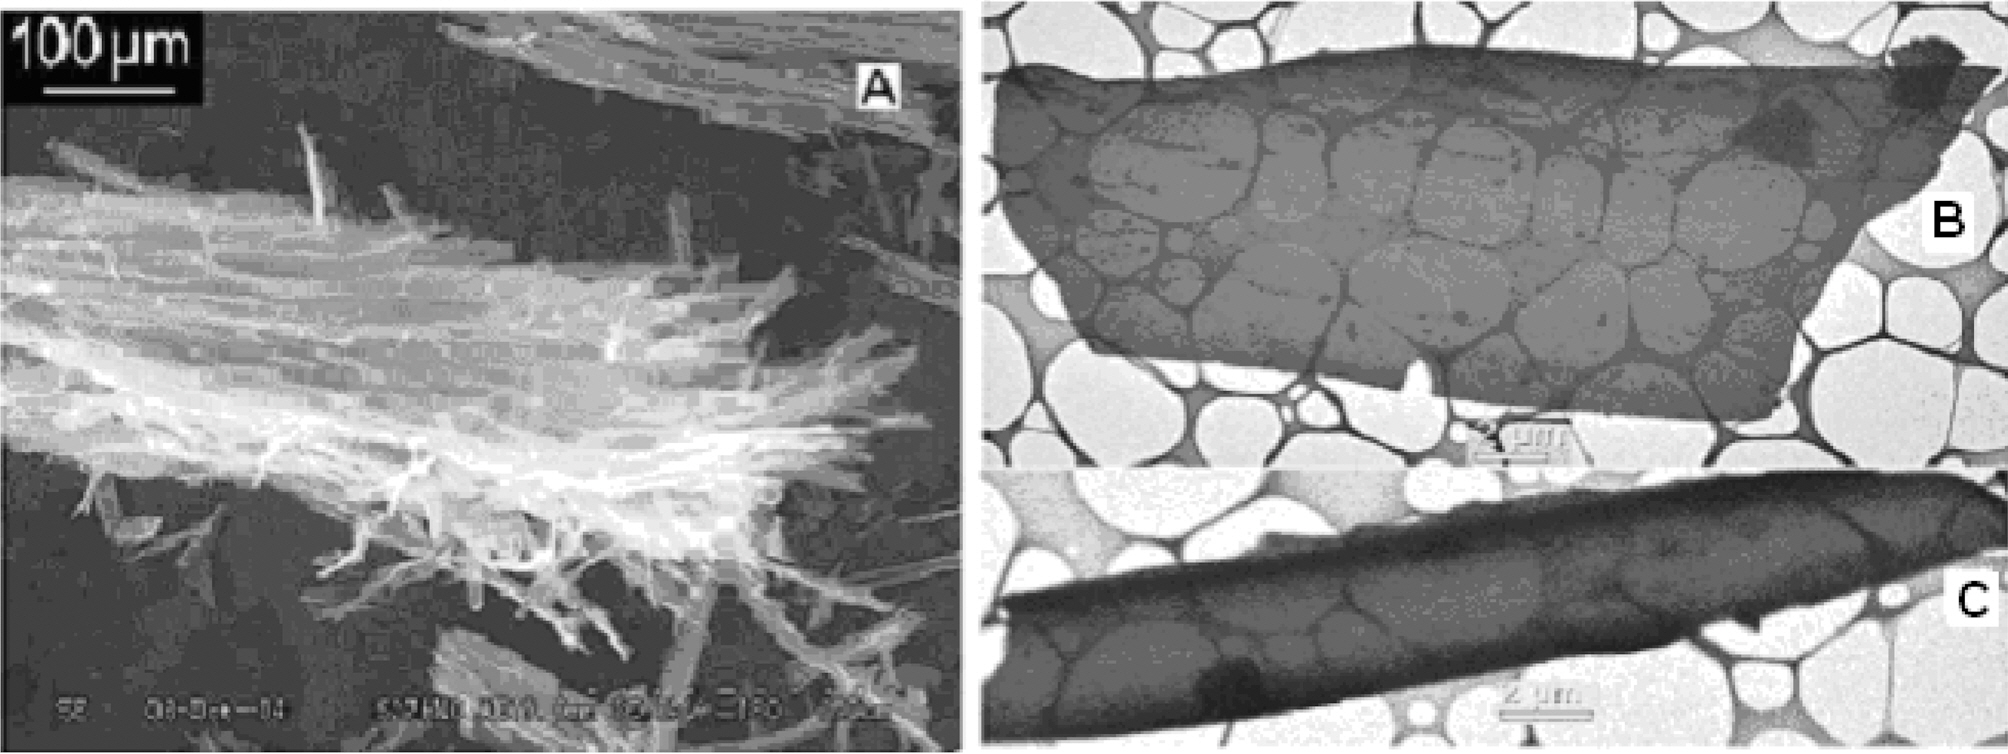
Scanning electron microscopy (SEM) micrographs of carbon fibers were also taken (Fig. 4). These micrographs show that the diameter of the tube is about 2 ㎛.Interestingly, this carbon appears as a transparent material,some in form of sheet (Fig. 4(b)) and some in form of cylindrical type (Fig. 4(c)). The sheet or cylindrical type carbon is so thin that even the grid used to hold the carbon powder is visible through the material. The width of the sheet is variable from 2 ㎛ to about 12 ㎛. Surface area was measured by methylene blue technique [10] and found to be 190 m2g-1.
3.2. Hydrogen adsorption studies
Results of the hydrogen adsorption obtained with carbon synthesized from different conditions are shown in Table 1.These results suggest that carbon material synthesized under the L5 condition (Table 1) gives the highest hydrogen adsorption value (7.14 wt%).
To confirm that L5 is the best combination we applied the
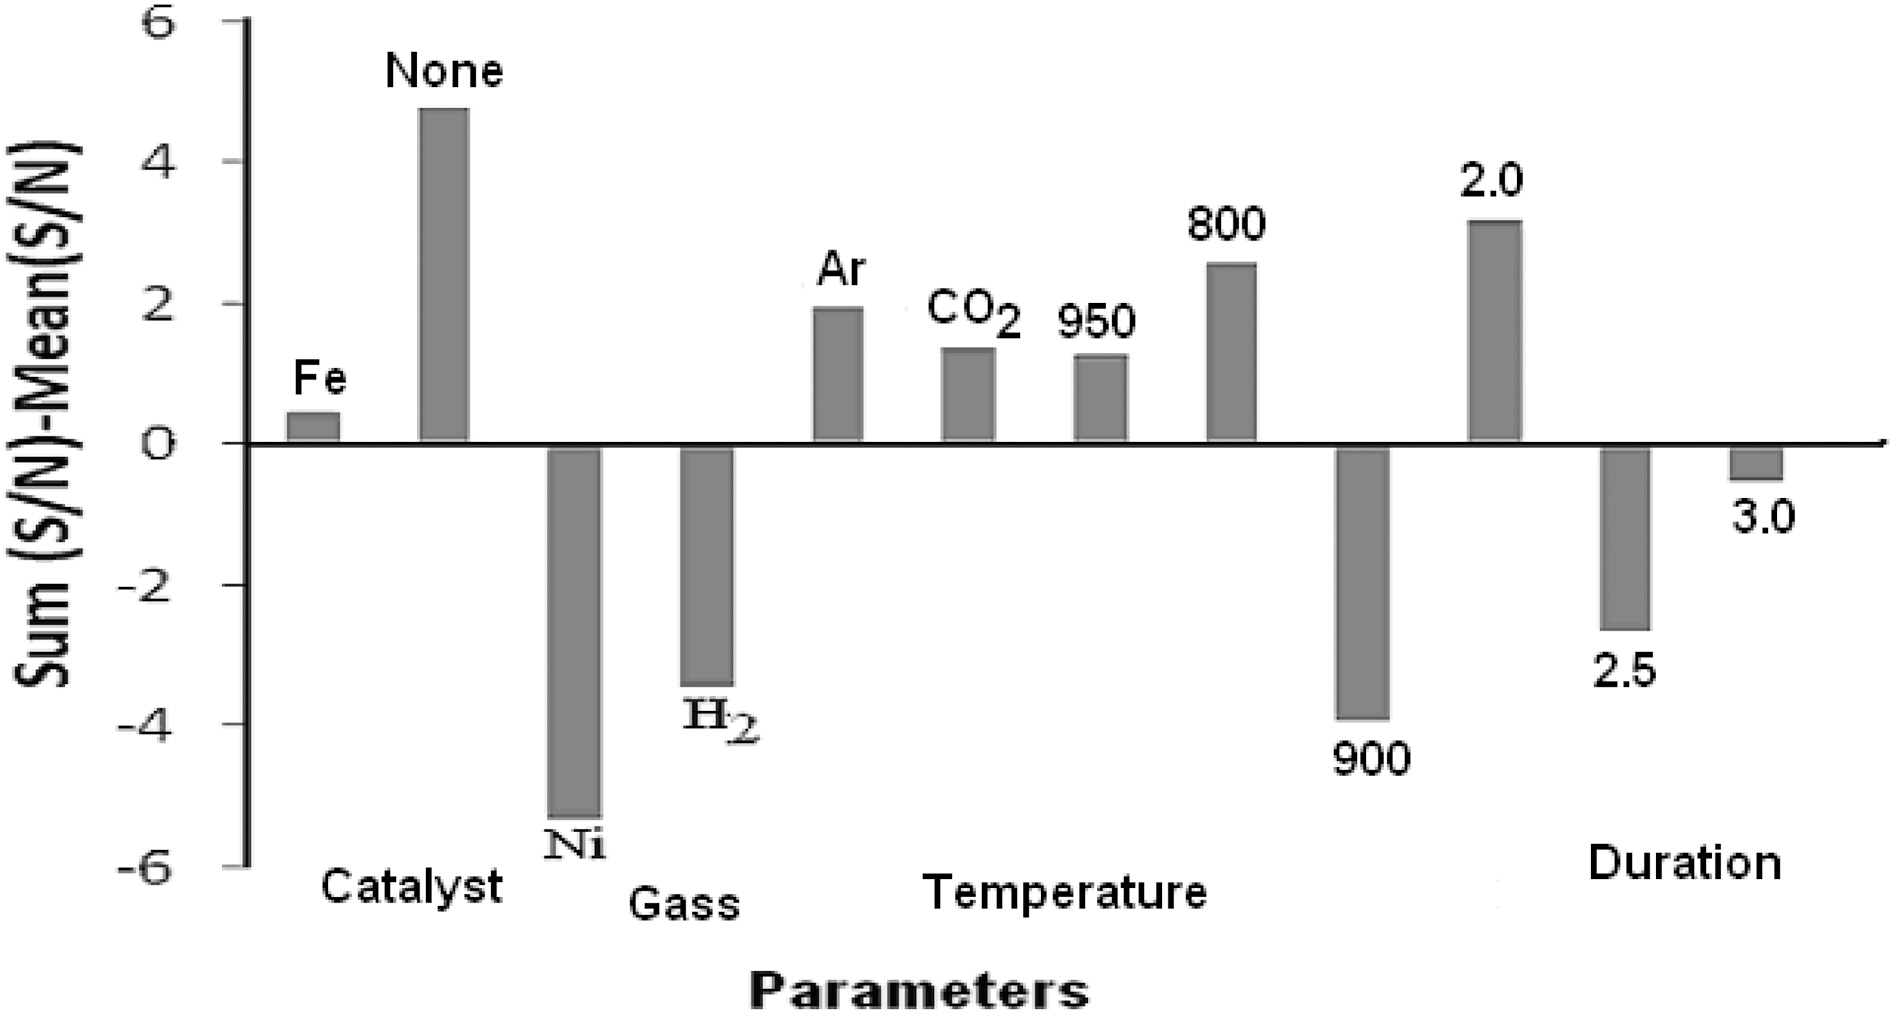
“larger the better” condition to calculate the S/N ratio for each experimental results (Table 1) as well as the average of S/N ratio by using Eq. (1). Each individual S/N ratio was then subtracted from average (S/N) ratio and plotted for each level of each parameter (Fig. 5). Those levels of each parameters lying above the average S/N ratio are considered to be effective levels of each parameter. Thus, Fig. 5 suggests that if cotton fiber is pyrolyzed under the conditions: no pretreatment, pyrolyzing gas as CO2 or Ar at 800oC for 2 h,then it will produce suitable carbon which can give the best hydrogen adsorption.
Parameter which has the maximum impact on producing the carbon material which can give the best hydrogen adsorption result was also calculated using Eq. (4). The results are shown in Table 1 which suggests that the maximum impact is of the temperature (34.37%) of pyrolysis. Impacts of gas (CO2/Ar) or duration of pyrolysis are almost the same i.e. around 25%. Pretreatment has very little impact on the production of carbon (15%).
Considering these observations, pyrolysis of cotton fibers was carried out under the condition: no pretreatment (i.e.cotton fiber was not treated with any catalyst prior to pyrolysis), temperature of pyrolysis 800oC (because this gave the highest [S/N] value, Fig. 5), Argon as carrier gas and paralyzing time for 2 h. CO2 could have been also used,since impact of gas is only 15%, argon was selected. Hydrogen adsorption study was made with carbon obtained from these conditions which gave a value of 7.32 wt%. This value is slightly higher than L5 condition.
Cotton fiber pyrolysed by selecting the conditions (no treatment of cotton fiber prior to pyrolysis, temperature of pyrolysis 800oC, Argon as carrier gas and paralyzing time for 2 h) predicted by Taguchi optimization technique gave the highest hydrogen adsorption capacity of 7.32 wt%.Cotton fiber obtained by this process is very transparent and posses graphitic nature.