In recent years, there has been an increasing demand for gas sensors based on safety and process control requirements. In particular, NO gas is among the major air pollutants leading to the formation of photochemical smog and acid rain. Therefore,NO mobitoring has become a critical issue, and the development of detection techniques for this gas is urgently required. Due to rapid developments in the fabrication of sensors for the detection and monitoring of environmental pollutants related to increasingly strict emission regulations, several kinds of gas sensors have been reported in literature [1-3].
Many types of NO gas sensors have been investigated, by applying different basic techniques, and using various materials such as metal oxide semiconductors (MOS) and carbon nanotubes (CNTs) [4,5]. MOS sensors have high sensitivities and short response tims but operate at high temperatures over 200oC [6,7], thus requiring supplemental heating equipment. In contrast, CNT-based sensors show good analytical sensitivity at room temperature and are highly responsive; therefore, they have been widely used for gas sensing; however, technologies with still higher sensitivities are currently in development, such as the use of sensors with highly developed specific surface areas [8].
Activated carbon fibers (ACFs) are non-hazardous processed carbonaceous materials, having a porous structure, a high adsorption capacity and rate and a large specific surface area.The advantages of ACFs compared with conventional activated carbons are smaller fiber diameter, a narrower pore size distribution and excellent adsorption capacity at low concentration of adsorbates [9,10]. Therefore, ACFs are promising electrode materials for high sensitivity of gas sensors.
In this study, an electrode for an NO gas sensor was constructed of ACFs fabricated by electrospinning and heat treatment. The activation process was performed using H3PO4 to improve the pore structure. The activation effects were investigated with respect to the sensitivity and response time of the NO gas sensor.
Polyacrylonitrile (PAN, d=1.184, Aldrich, USA) was used as a carbon source. N,N-dimethyl formamide (DMF,Aldrich) was adopted as a solvent because its boiling point is 153oC and because it has a sufficiently high conductivity for electrospinning (conductivity=10.90 μS/cm, dipole moment=3.82 Debye). To develop a porous structure, phosphoric acid (H3PO4, 85%, Samchun Co., Korea) was used as a chemical activation agent for the activation process.
The prepared polymer solution was injected into a 30 mL syringe with a capillary tip (18 G; inner diameter: 1.27 mm),and the syringe was placed in a KD Scientific Syringe Pump(Model 100, USA). The polymer solution was ejected onto an aluminum foil-covered collector. Electric power was applied with a high voltage power supply (NT-PS-25K,NTSEE Co., Korea) at 17 kV. See our previous work for more details [11].
Before carbonizing the electrospun fibers, a stabilization(oxidation) step was used to convert the polymer from a thermoplastic to a thermosetting polymer because electrospun thermoplastic materials may soften and melt at high temperatures [12,13]. The stabilization step was performed at 260oC for 4 h in air. The stabilized electrospun samples were then heat-treated in a nitrogen atmosphere at 1050oC under the following conditions: heating rate=10oC/min,holding time =1 h, nitrogen feeding rate =100 mL/h. This prepared sample is hereinafter termed CF.
2.3. Activation of the electrospun carbon nanofibers
H3PO4 solutions used as chemical activation agents. CFs were immersed in four solutions (20, 40, 60 and 80 wt%H3PO4) for 12 h with shaking. These wet CF samples were then placed in an alumina boat within a steel pipe for chemical activation. Activation was conducted at 750oC for 3 h in an argon atmosphere. The heating rate was 5oC/min,and the feed rate of the argon gas was 40 mL/min. After chemical activation, the resulting samples were washed with distilled water several times and dried at 120oC overnight[14,15]. These activated samples were denoted H3PO4 ACF(HACF) followed by a suffix according to the concentrations(20, 40, 60 and 80%) of the H3PO4 solutions used, i.e.,HACF-20, HACF-40, HACF-60 and HACF-80, respectively.
2.4. Characterization of the prepared samples
The textural properties of the fluorinated samples (CF,HACF-20, HACF-40, HACF-60 and HACF-80) were investigated before and after packing. Samples were degassed at 150oC for 3 h, and then nitrogen adsorption was performed at -196oC using a Brunauer-Emmett-Teller (BET)apparatus (Micromeritics ASAP 2020) to determine the specific surface areas, total pore volumes, pore size distributions and micropore fractions.
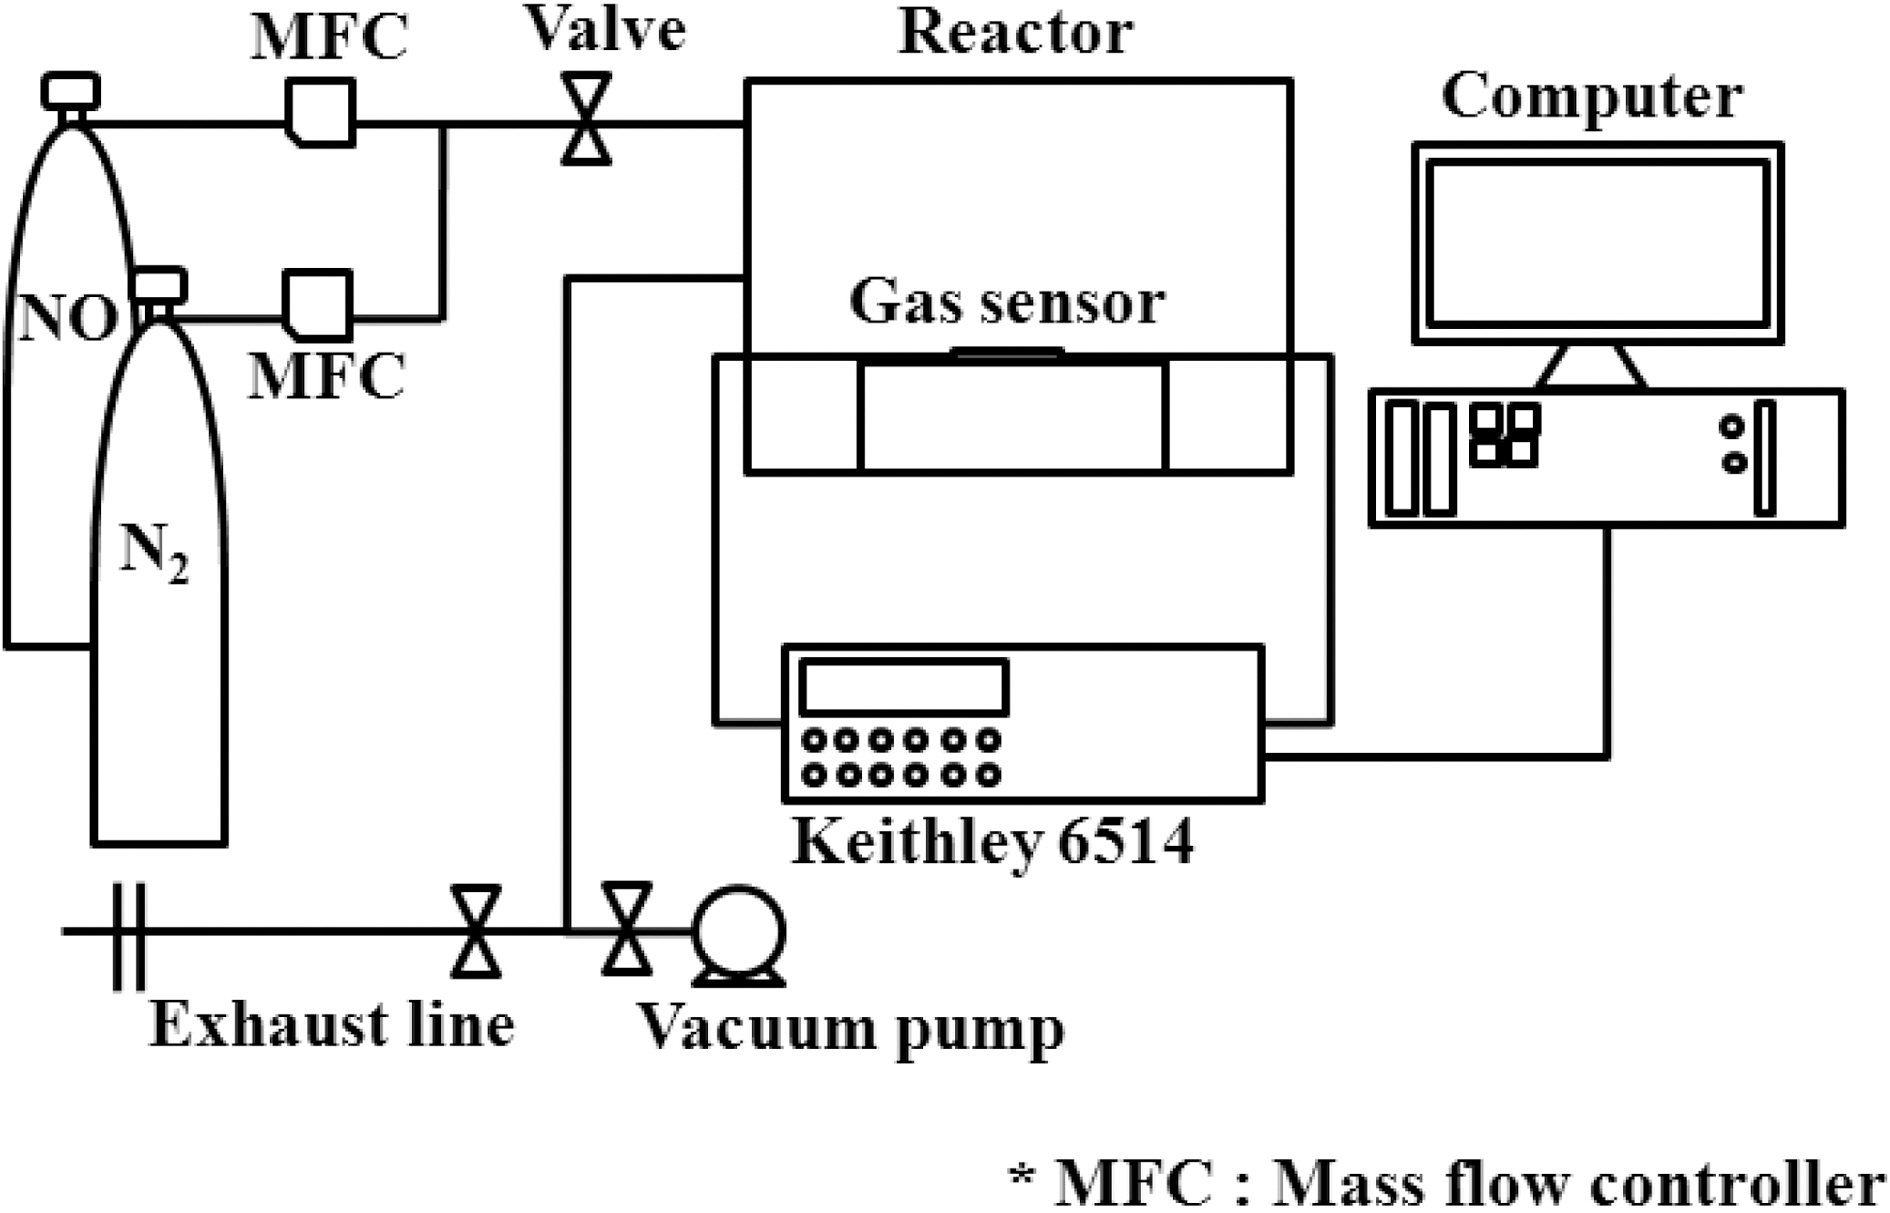
The electrical resistance of the samples was measured using a programmable electrometer (Keithley 6514) to evaluate their gas-sensing properties. This measurement was performed in a stainless steel chamber with a volume of 1500 cm3. The chamber was connected to gas cylinders (NO and N2). Each prepared gas sensor sample was placed in a sealed chamber under vacuum at a pressure of 1× 10⁻³Torr.Initially, nitrogen gas was injected into the chamber to stabilize the electrical resistance. A mixture of the two gases was prepared with a concentration of 50 ppm NO in N2 and
injected into the chamber and the change in electrical resistance was measured. The gas feeding rate was fixed at 500 sccm in all cases. The setup of the gas sensor system is depicted in Fig. 1.
3.1. Textural properties and pore structure
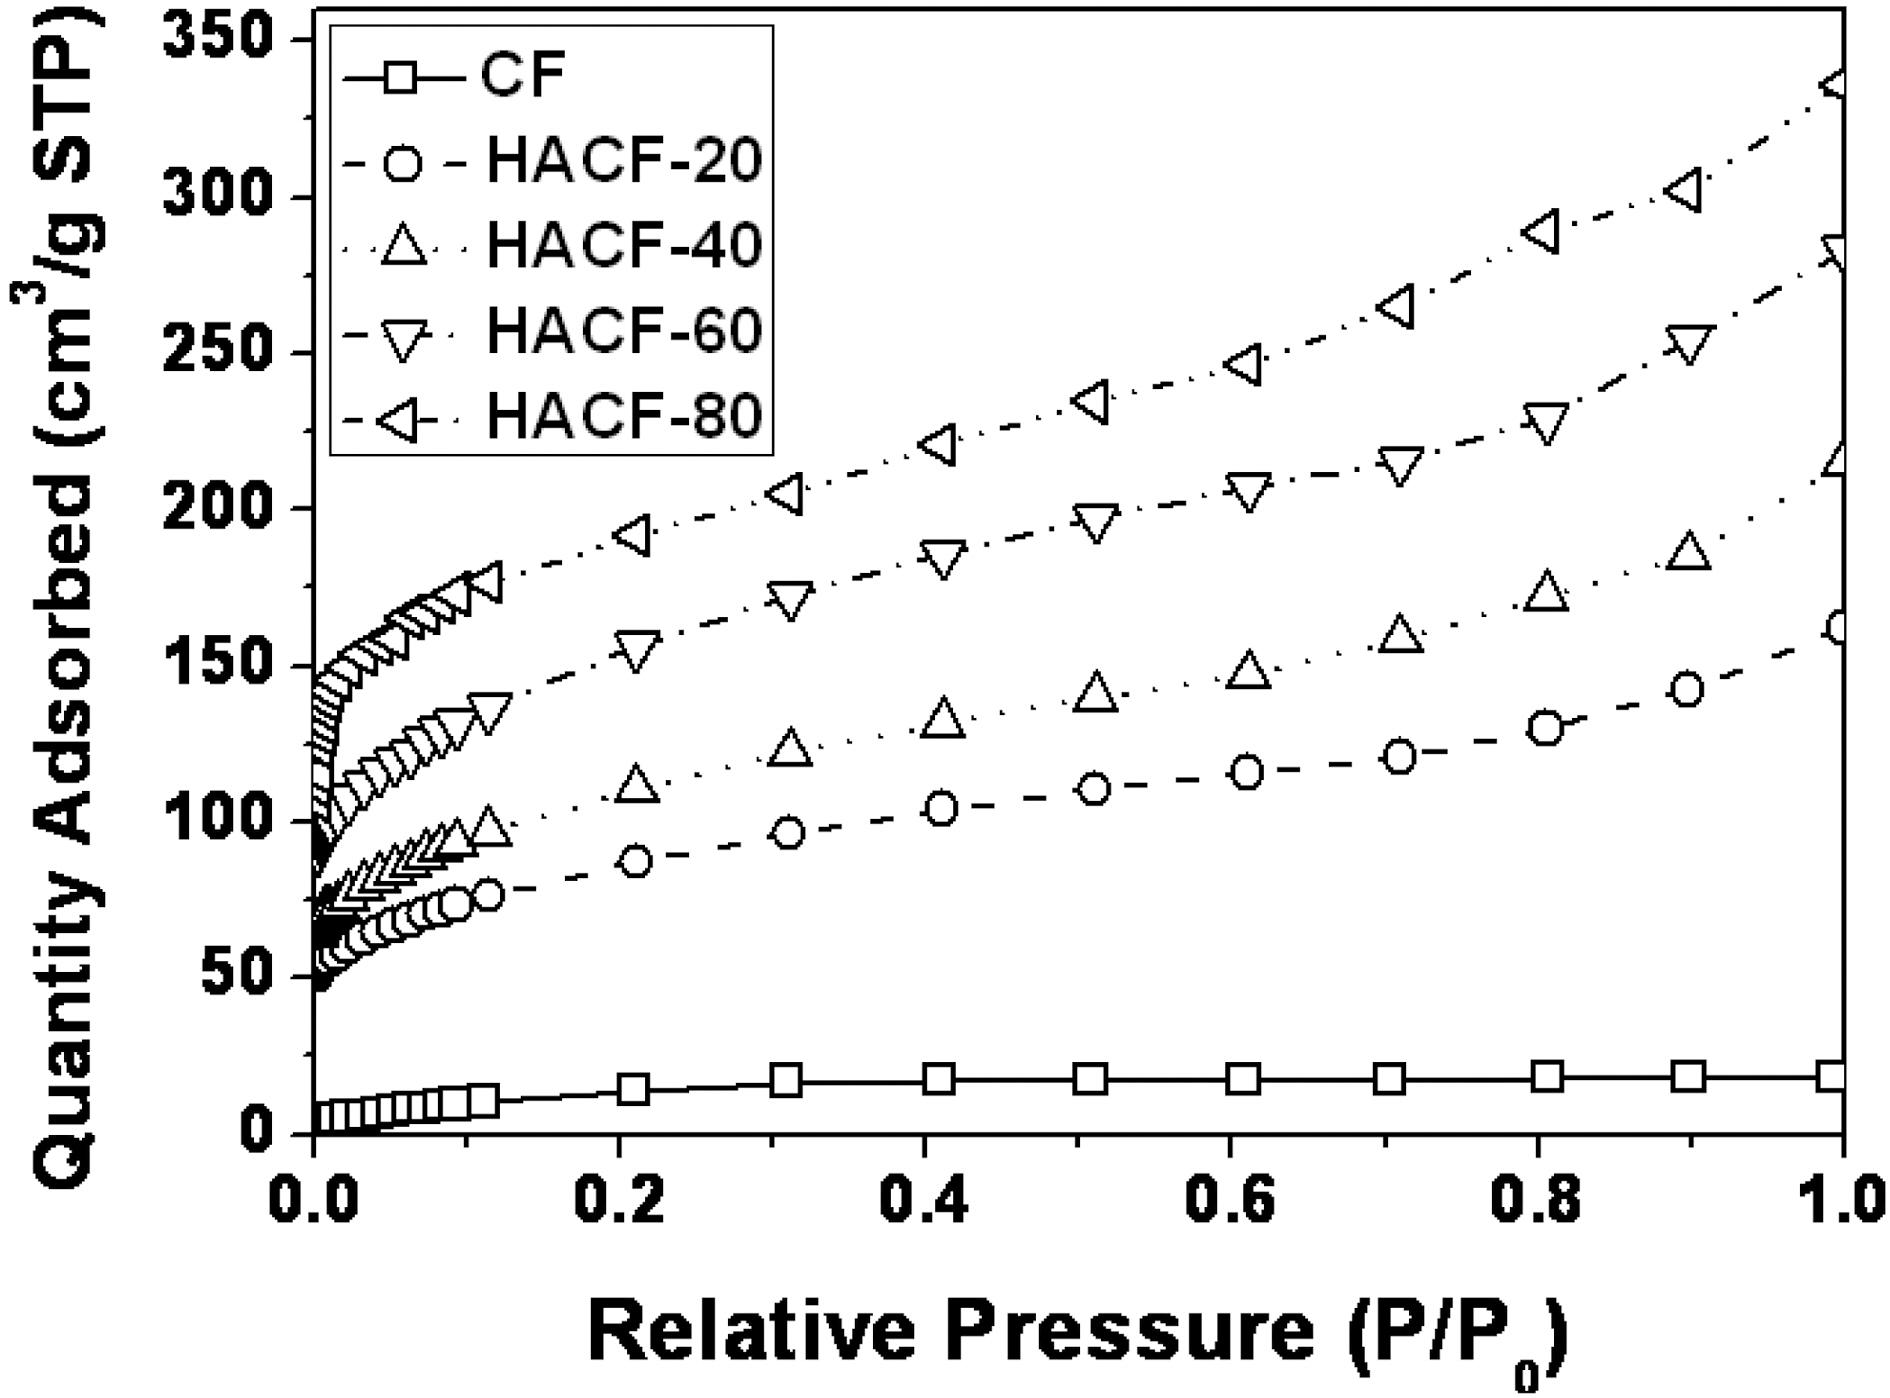
The nitrogen isotherms of the samples were plotted to investigate the effects of the activation conditions on the pore structure, as presented in Fig. 2. The non-activated sample CF showed no change on nitrogen adsorption,indicating a non-porous material. However, in the case of the activated samples (HACF-20, HACF-40, HACF-60 and HACF-80), a more significant increase in adsorption was apparent in the samples treated with higher concentrations of H3PO4. The isotherms of four H3PO4-activated samples all have inflection points at approximately 0.01 P/P0. Each sample had different characteristics depending on the
[Table 1.] Textural Properties of the Activated Samples
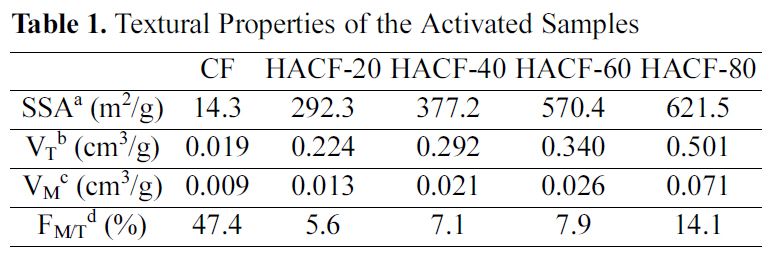
Textural Properties of the Activated Samples
concentration of H3PO4 used. Generally, an increase in the isotherm curve indicates the development of a micropore structure (at less than 0.01 P/P0) and a mesopore structure(above 0.01 P/P0) [16,17]. Significant changes were observed above 0.1 P/P0 in all other cases indicating that both mesopores and macropores developed.
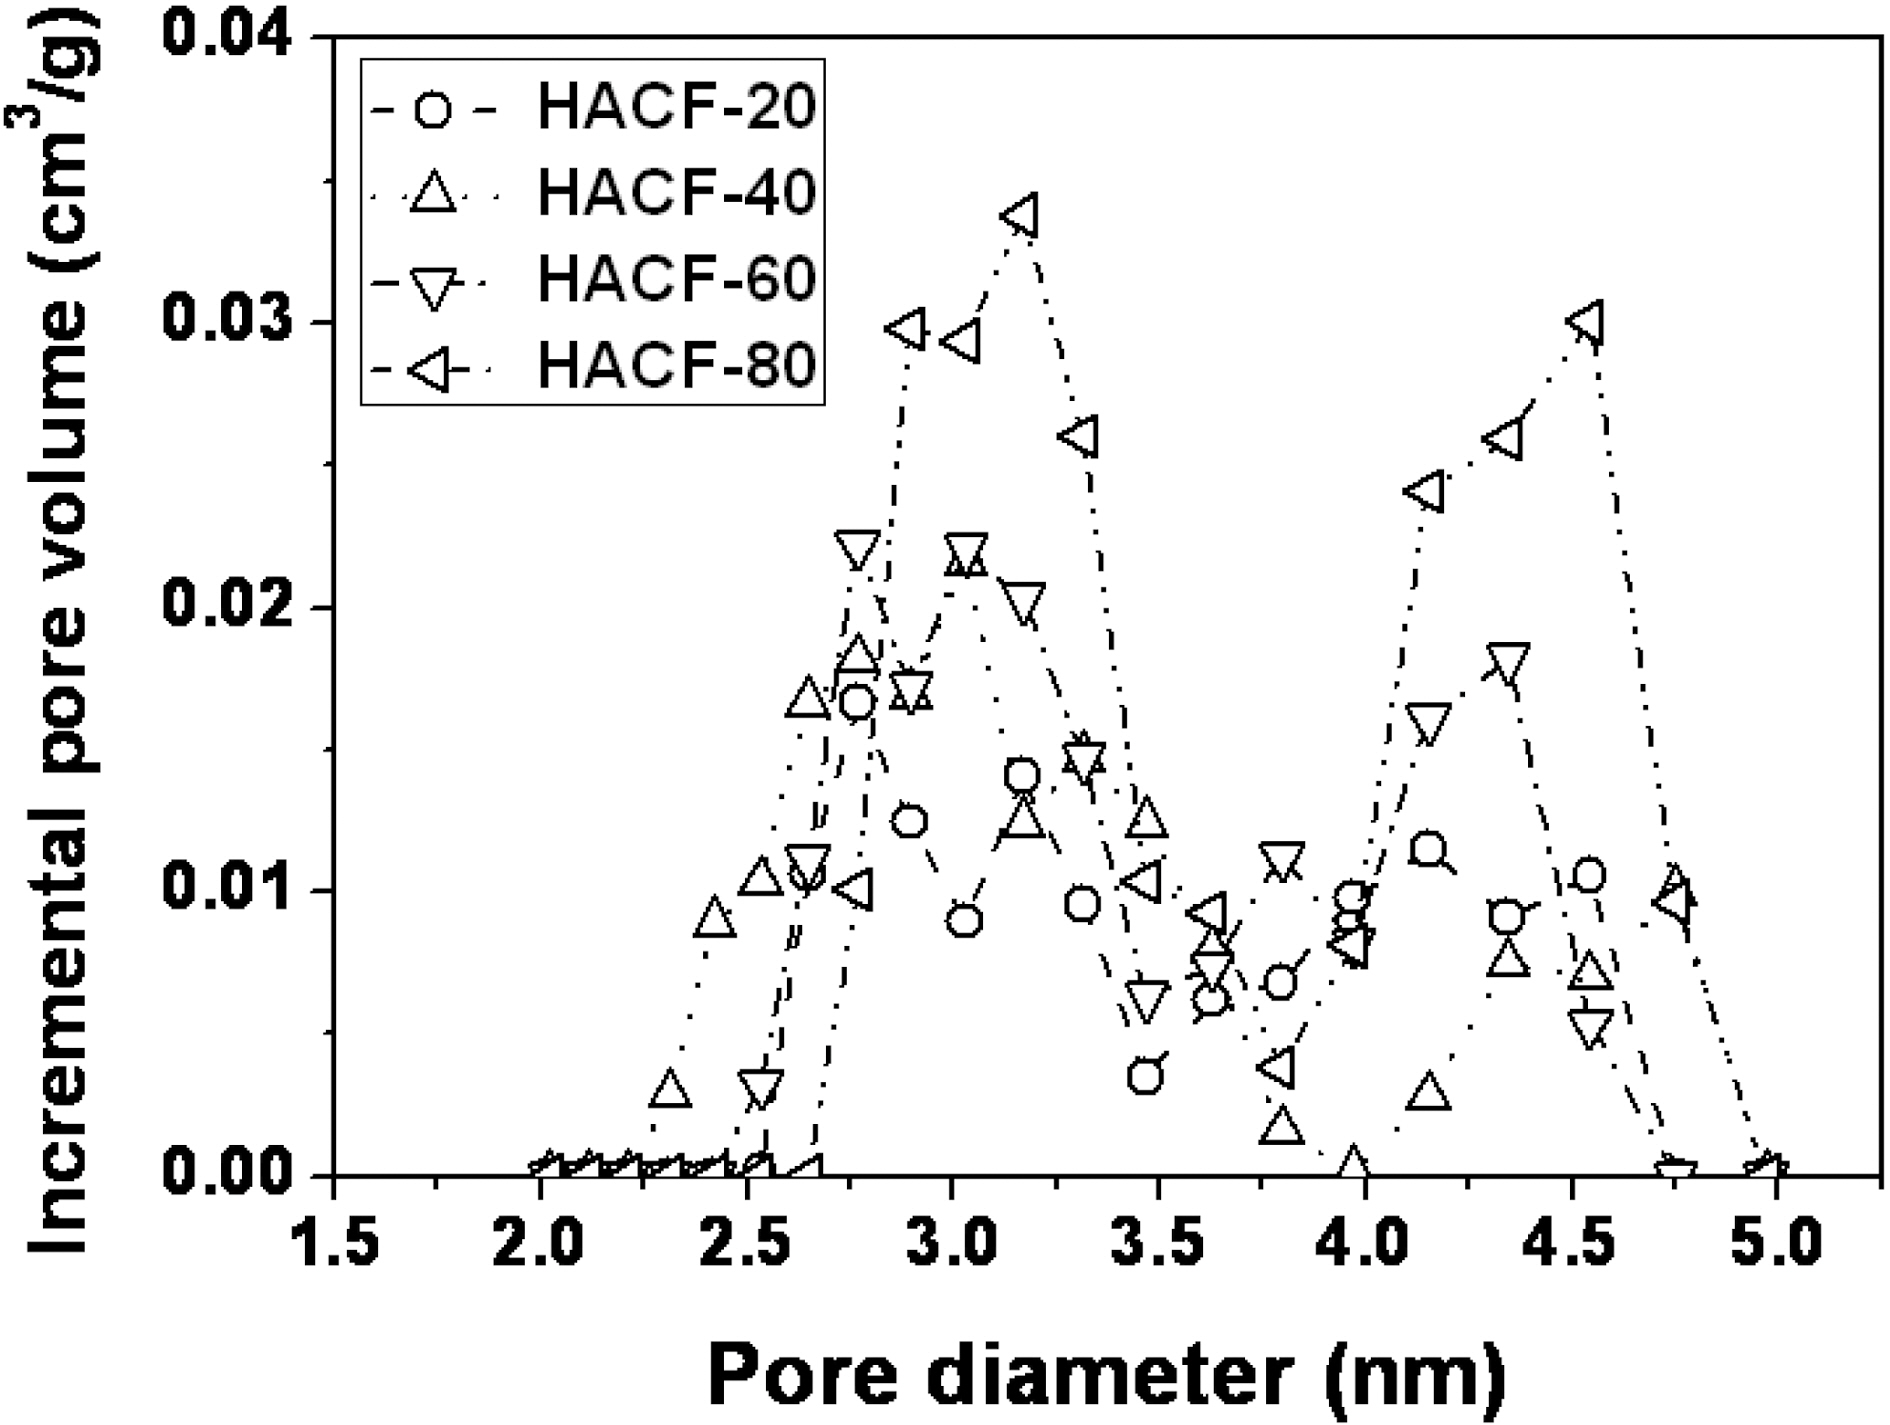
The isotherm curve of HACF-80 increased strikingly in the range below 0.1 P/P0 and then increased gradually,indicating that the pore structure was mainly dominated by micropores but some mesoporous structure was also developed. To evaluate this result in more detail, a comparison of the pore size distribution of each sample was performed using density functional theory, as shown in Fig. 3.The pore volume and surface area increased with the increment of phosphoric acid concentration. All the pores of the activated samples had diameters range from 2.3 to 4.9 nm. The phosphoric acid activated samples also had small mesopores. HACF-80 showed the highest pore volume and surface area among the samples.
A summary of the textural properties of the activated materials is presented in Table 1. Their specific surface areas and pore volumes were both increased by activation. After phosphoric acid activation, the BET specific surface areas of the samples (HACF-20, HACF-40, HACF-60 and HACF-80) ranged from 292.3 up to 621.5 m2/g. Pore volume was also increased by activation. Sample HACF-80 had the highest total pore volume, at 0.501 cm3/g. All of the activated samples were mesoporous, as their micro pore volumes comprised less than 15% of their total pore volumes.
3.2. Gas sensing by resistive response
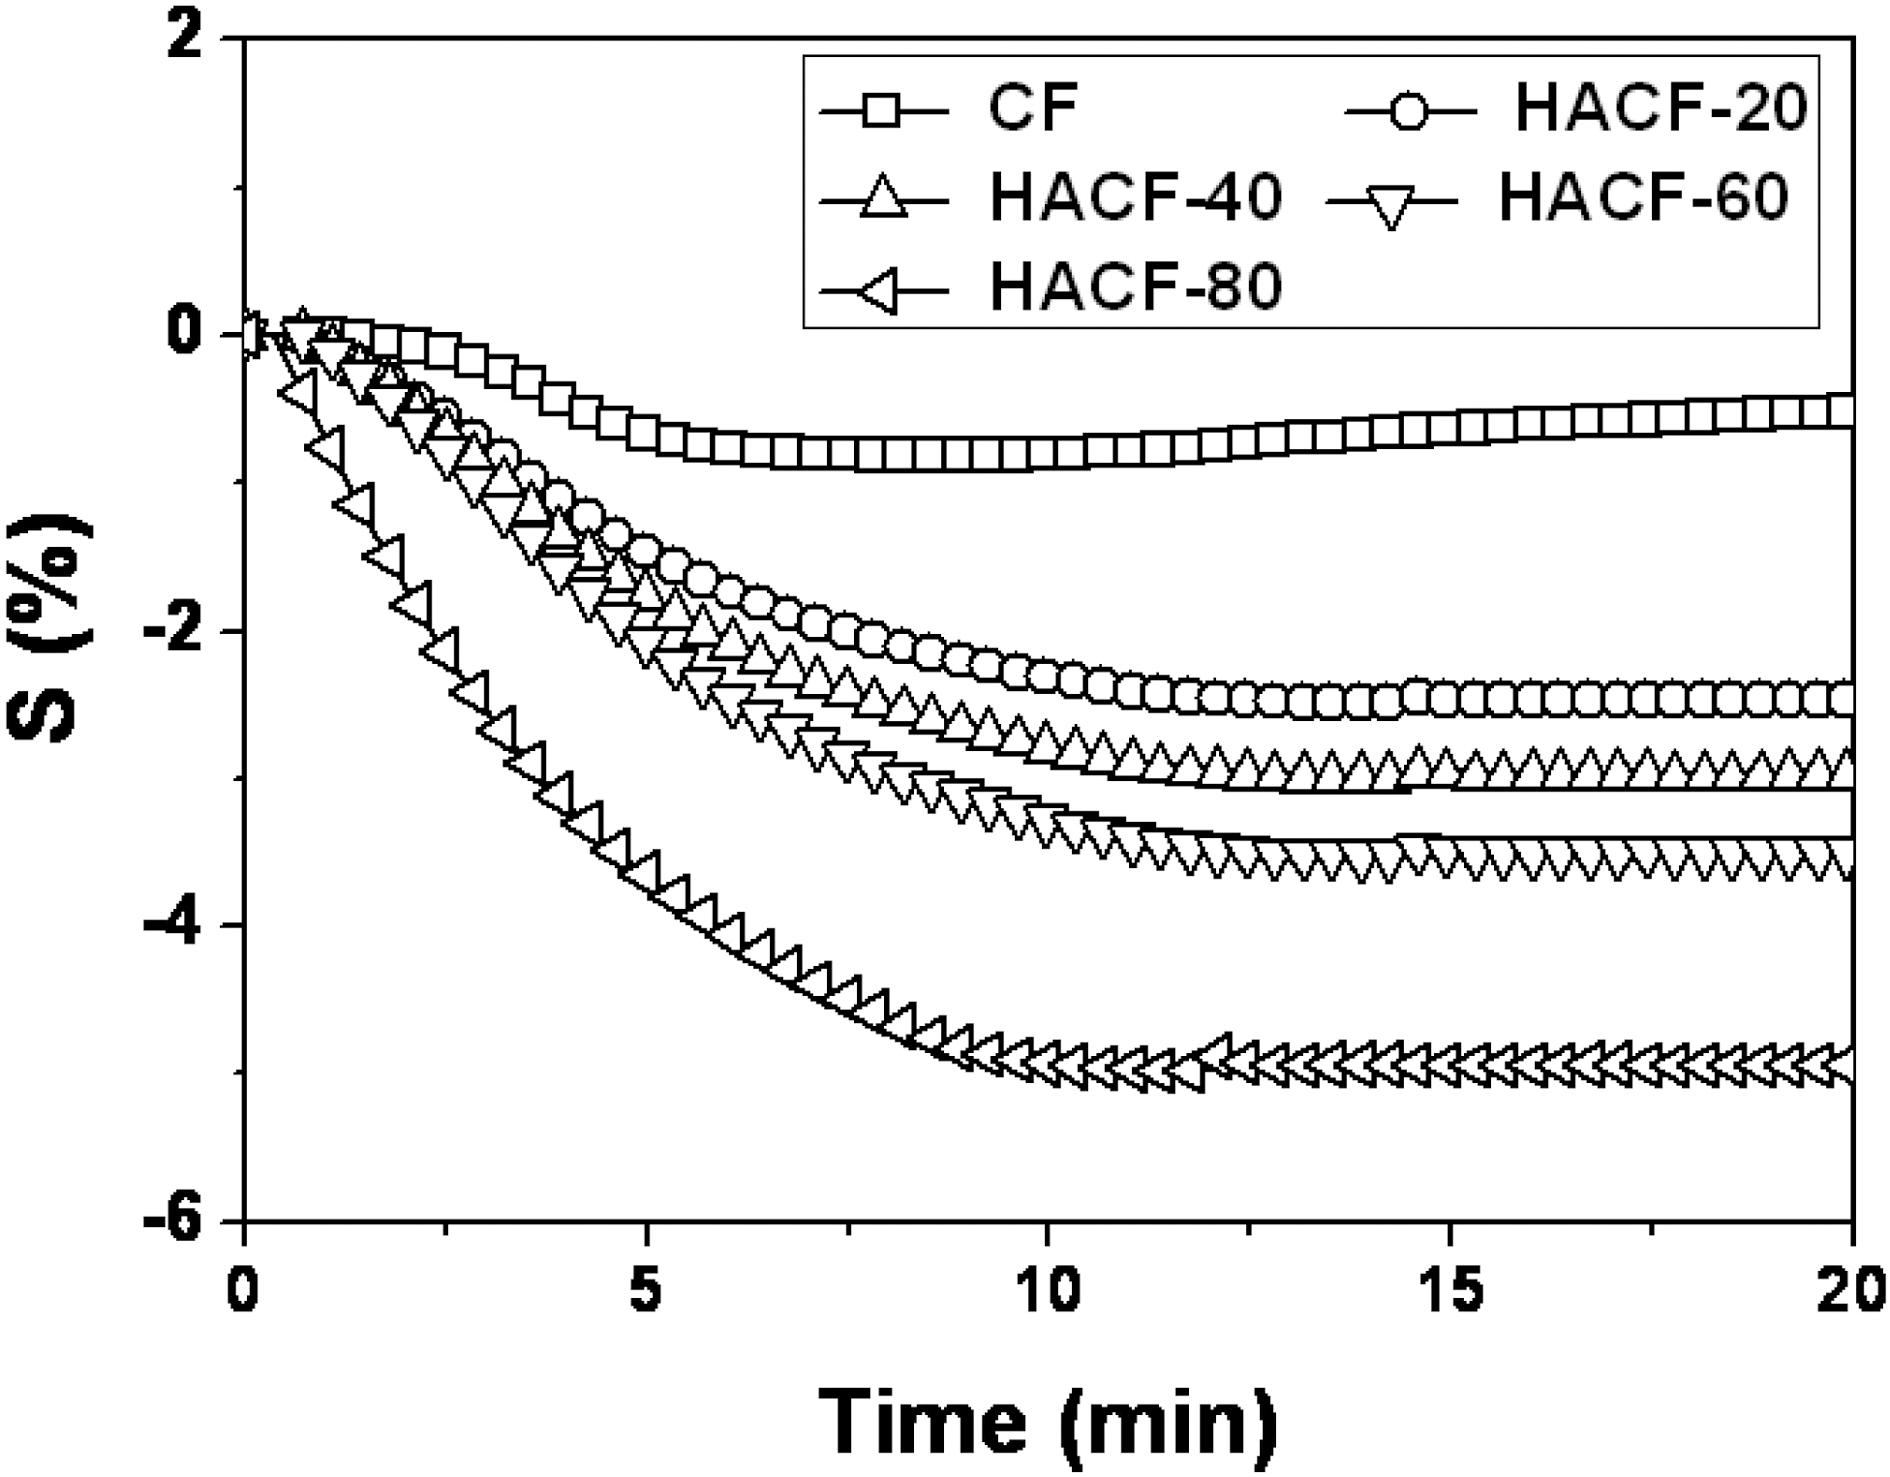
The resistive response was measured and plotted vs. the time of exposure to NO gas (Fig. 4). The sensitivity of gas sensor is expressed by [18,19]
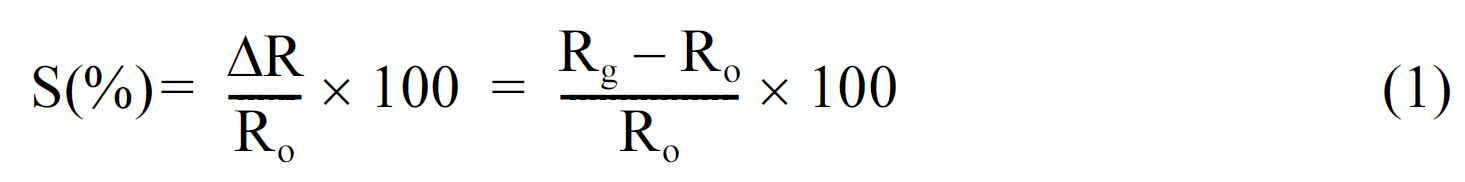
where Ri is the resistance in N2 gas and Rg is the resistance measured upon exposure to NO gas molecules. The CF sample showed resistive response of only a 0.8% due to the inactive NO gas adsorption sites and because it is a nonporous material, as shown in Fig. 2 and Table 1. The development of a porous structure enhanced the NO gas sensing ability up to approximately 5%, as observed in HACF-80. This result implies that the porous structure generated by chemical activation effectively improved the gas adsorption sites. The electrical resistance decreased significantly within 12 min to approximately 2.5%, 3% and 3.5% in the HACF-20, HACF-40, and HACF-60 samples. In case of HACF-80, the response time was faster than with the other samples. The main reason for this result is likely that the NO gases were quickly adsorbed into the narrow micropores, resulting in the quick response time in HACF-80, due to its relatively high fraction of micropore volume[20-22]. In detail, the target gas adsorbed into the micropores very quickly in approximately 5 min, resulting in a
significant drop in resistance, and then slowly adsorbed into the mesopores from 5 min to 10 min, resulting in a slow decrease in resistance.
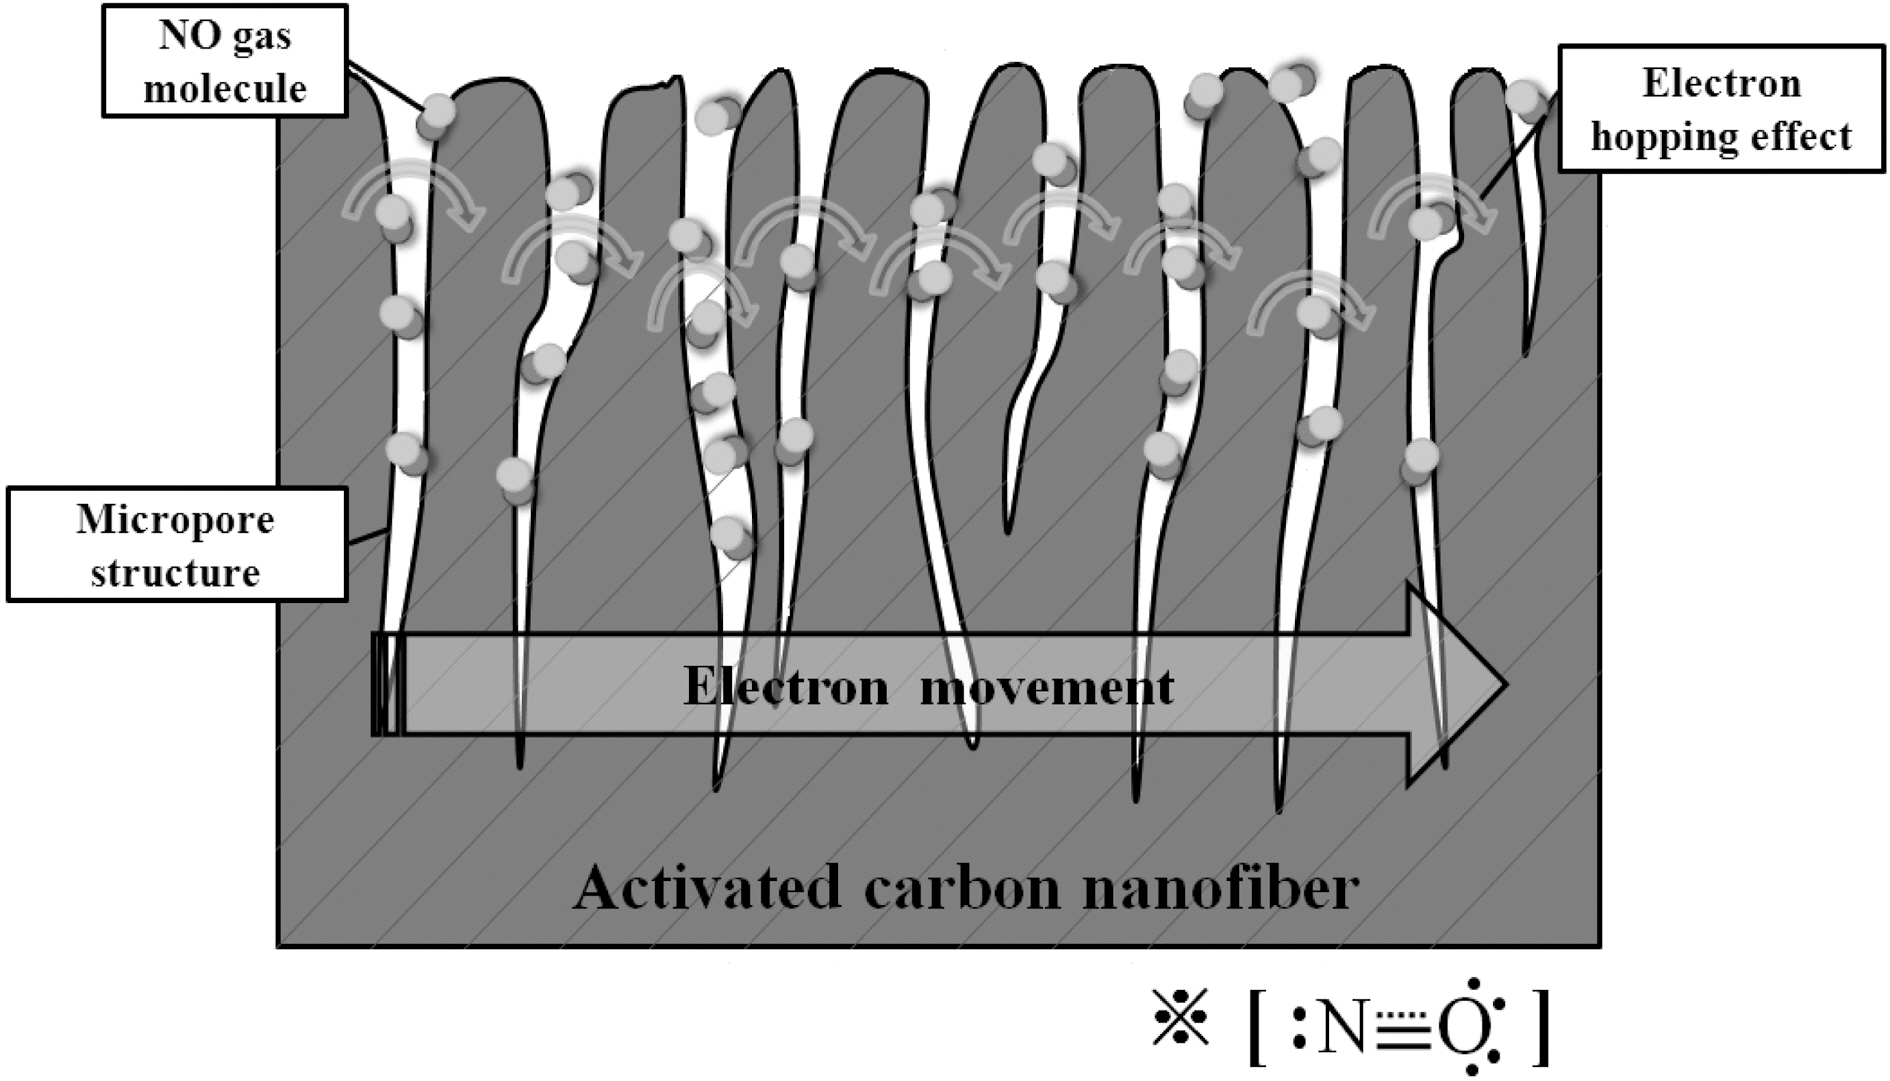
Generally, carbon materials show the characteristics of ptype semiconductors; upon exposure to oxidizing gases(electron acceptor), the electron charge transfer is from the electron acceptor to the p-type semiconductor. Therefore,exposure to electron accepting gases such as NO, NO2 and CO2 results in a Fermi level shift of the carbon materials closer to the valence band. This shift enriches the hole carriers in carbon materials and decreases their resistance[23,24].
In contrast, in case of activated carbon materials, the trend of electrical resistance shows completely different behavior,suggesting that they are neither n-type rather nor p-type semiconductors. This effect is attributed to the destruction of the graphite structure by the activation process. After activation, activated carbons do not show semiconductors characteristics, and the change of electrical resistance depends instead on quantity of adsorbed gas in the pores.During the stabilization of electrical resistivity, the electrical resistivity may increase due N2 adsorption on activated carbon; however, after adsorbing easily electron polarizable gas molecules (NO), the electrical resistance is reduced by electron hopping effects [25,26].
Generally, carbon materials are regarded as a semiconductors based on the electron charge transfer between carbon materials and adsorbed gas molecules. It has been suggested that activated carbon loses its semiconductor characteristics during the activation process due to destruction of the graphite structure by pore formation [26].The electrical resistance of our activated carbon materials varied in relation to both the adsorbed gas and the pore structure as shown in Fig. 5. The reduced electrical resistance was mainly attributed to the effects of the electron localized NO molecules rather than the electron delocalized N2 gas. Before introducing NO target gas to gas sensing material, N2 gas was first used in a stabilization step. The introduction of N2 gas increased the electrical resistance of activated carbon, showing an insulating effect due to the stable electron configuration, as reported previously [27].Conversely, the introduction of the easily polarized molecules (NO) reduced the electrical resistance. This result was likely due to electron hopping effects in the pores[25,26]. Therefore, we concluded that activated carbons especially those with an extensively disrupted graphite structure, can lose the semiconductor characteristics and function simply as an efficient electrode for gas adsorption.Accordingly, this proposed mechanism proved beneficial for the application of this material to a highly sensitive gas sensor.
A high performance NO gas sensor was prepared from electrospun ACFs. The pore structure developed by chemical activation enable the efficient adsorption of NO gas due to the enlarged specific surface area and pore volume, resulting in the high sensitivity of the gas sensor. Overall, the sensing ability for NO gas was significantly improved due to the effects of chemical activation.