Transformation temperatures of Ti-Ni based alloys are very sensitive to alloy compositions. Martensitic transformation start temperature (Ms) of Ti-Ni alloy are known to increase with increasing Ti content [1]. Substitution of Fe, Al, Co, Cr and Mo for Ti in an equiatomic Ti-Ni alloy decreases Ms, while substitution of Zr, Hf, Pd and Pt for Ni in an equiatomic Ti-Ni alloy increases Ms [2-10]. Transformation behavior of Ti-Ni based alloys depend on alloy compositions also. Solution treated equiatomic Ti-Ni alloy shows the B2-B19’ martensitic transformation behavior. Substitution of Fe, Al, Co, Cr and Mo for Ti in the equiatomic Ti-Ni alloy induced the R phase, then two-stage B2-R-B19’ (monoclinic) transformation occurs [2-6]. Substitution of Zr, Hf, Pd, Cu and Pt for Ni in the equiatomic Ti-Ni alloy induces the B19 martensite, then two-stage B2-B19 (orthorhombic)-B19’ transformation occurs [7-11]. The B2-B19 transformation is very attractive because transformation hysteresis associated with the B2-B19 transformation is relatively small comparing with that associated with the B2-B19’ transformation, which is beneficial for industrial applications. However, the alloys showing the B2-B19 transformation have low workability comparing with binary Ti-Ni alloys. It is essential to improve workability of Ti-Ni based alloys showing the B2-B19 transformation for industrial applications. Recently, present authors reported that substitution of Fe, Mo, V for Ni in a Ti-45Ni-5Cu(at%) alloy induced the B19 martensite. They also reported that Ti-(45-x)Ni-5Cu- x(Fe, Mo, V) alloys showed good workability with tensile strain about 40%. Similar to Fe and V, Mn is a 3d transition element and it is expected to be effective for inducing the B19 martensite in a Ti-45Ni-5Cu alloy. A difference in atomic radius between Ni and Mn is 10.4%, which is much large comparing with Fe(0.8%) and V(4.8%). The large difference in atomic radius is expected to affect the shape memory effect and superelasticity due to a solid solution hardening. In this study, Ti-(45-x)Ni-5Cu-xMn alloys were prepared, and then their transformation behavior and mechanical properties were investigated.
Ti-(45-x)Ni-5Cu-xMn (at%) (x = 0.5~2.0) alloys were prepared by vacuum arc melting. The alloy ingot was hot rolled at 1,123K into a sheet with a thickness of 0.8 mm. Specimens for electrical resistivity measurements and X-ray diffractions were cut from the sheet. All specimens were fully annealed at 1,123 K for 3.6 ks in vacuum followed by iced water quenching, and then electropolished with an electrolyte which consists of 95%CH3COOH and 5% HClO4 in volume. In order to investigate transformation behavior, electrical resistivity (ER) measurements and X-ray diffraction (XRD) were carried out. ER measurements were made by means of typical four probe method at the heating and cooling rate of 0.017 K/s. XRD experiments were made using CuKα with successively cooling and heating specimens. In order to investigate the shape memory characteristics, thermal cycling tests under constant load were made by heating and cooling the specimen under various applied stresses. Elongation on cooling and its recovery on heating were measured by linear variable differential transformer. The superelasticity was examined by tensile test at various temperatures with a strain rate of 10-4/s.
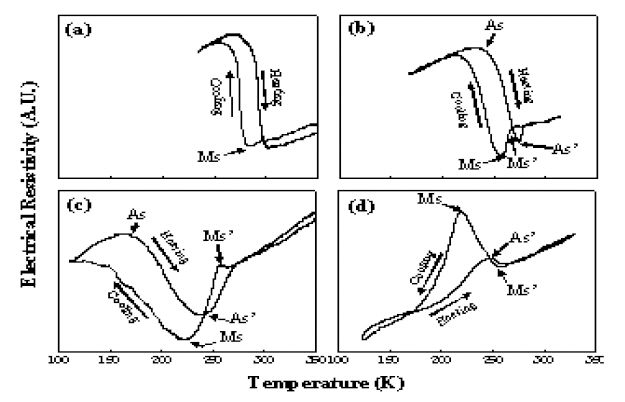
Figure 1 shows electrical resistivity vs. temperature curves of Ti-(45-x)Ni-5Cu-xMn alloys. In the curve of a Ti-44.5Ni-5Cu-0.5Mn alloy, on cooling, resistivity starts to increase abruptly at the temperature designated by Ms. On heating, resistivity starts to decrease at the temperature designated by As. In the curve of Ti-44.0Ni-5Cu-1.0Mn alloy, resistivity starts to decrease suddenly at Ms’, then it starts to increase at Ms. On heating, it starts to decrease at As, then it starts to increase at As’.
In the curve of Ti-43.5Ni-5Cu-1.5Mn alloy, on cooling, resistivity starts to decrease at Ms’ after small increase at 265 K. On further cooling, it starts to increase at Ms. On heating, resistivity starts to decrease at As, then it starts to increase at As’.
In the curve of Ti-43.0Ni-5Cu-2.0Mn alloy, on cooling, resistivity starts to increase at 256 K, then it starts to decrease at Ms’. On heating, resistivity starts to decrease at As’. In order to explain electrical resistivity vs. temperature curves in Fig. 1, Xray diffractions were made with successively cooling the specimens.
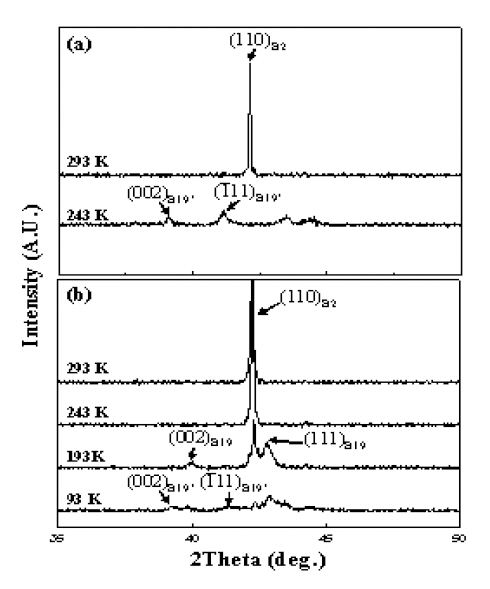
Figure 2 shows typical X-ray diffraction patterns obtained. In the patterns of a Ti-44.5Ni-5Cu-0.5Mn alloy, at 293 K, the diffraction peak corresponding to the B2 parent phase is observed. On cooling the specimen, at 243 K, diffraction peaks corresponding to the B19’ martensite are observed, while that of the B2 is not found. Therefore, the resistivity change in Fig. 1 (a) is ascribed to the B2-B19’ transformation. Ms is defined to be the B2-B19’transformation start temperature. In the pattern of a Ti-43.0Ni-5Cu-2.0Mn alloy, at 293 K, the diffraction peak corresponding to the B2 parent phase is observed.
On cooling the specimen down to 243 K, any change in the diffraction pattern is not observed. From Fig. 1 (d), it was found that resistivity increased on cooling from 256 K to Ms’. However,any structural change is not found in Fig. 2 (b). Therefore, it is concluded that the resistivity change occurring on cooling from 256 K to Ms’ in Fig. 1 (d) is not related with a transformation with a structural change. On further cooling down to193 K, in addition to the diffraction peak of the B2 phase, diffraction peaks corresponding to the B19 martensite are found. Therefore, the decrease in resistivity at Ms’on cooling in Fig. 1(d) is ascribed to the B2-B19 transformation. Ms’ in Fig. 1(d) is defined to be the B2-B19 transformation start temperature. On further cooling, at 93 K, diffraction peaks of the B19’ martensites are found, while intensity of those of the B19 martensite decreases. This suggests that the B19 martensite is transformed into the B19’ martensite on cooling. Similar results were obtained in Ti-44.0Ni-5Cu-1.0Mn
and Ti-43.0Ni-5Cu-2.0Mn alloys.
From Figs. 1 and 2, it is concluded that transformation behavior of Ti-(45-x)Ni-5Cu-xMn alloys depend strongly on Mn content. The one-stage B2-B19’ transformation occurs when Mn content is 0.5 at%, above which the two-stage B2-B19-B19’ transformation occurs. Similar two-stage transformation behavior was reported in Ti-(45-x)Ni-5Cu-xFe, Ti-(45-x)Ni-5Cu-xMo and Ti-(45-x)Ni-5Cu-xV alloys [10-12].
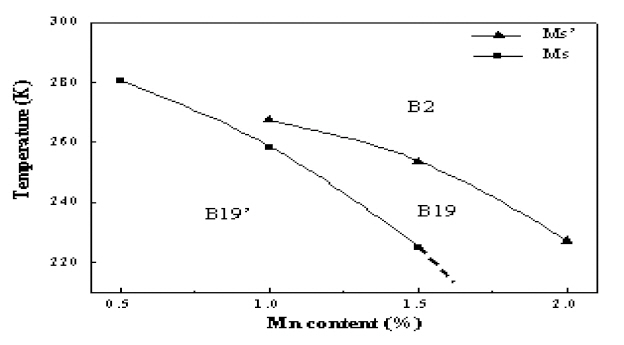
Figure 3 shows Mn content dependence of Ms’ and Ms in Ti-(45-x)Ni-5Cu-xMn alloys. It is found that both Ms’ and Ms decrease with increasing Mn content. It is also found that decreasing rate of Ms (60 K / % Mn) is larger than that of Ms’ (40K/ % Mn), and consequently a temperature range where the B19 martensite exists is expanded with increasing Mn content.Similar composition dependence of Ms and Ms’ was reported in Ti-(45-x)Ni-5Cu-xFe, Ti-(45-x)Ni-5Cu-xMo and Ti-(45-x)Ni-5Cu-xV alloys[10-12]. In order to examine workability of Ti-(45-x)Ni-5Cu-xMn alloys, tensile tests were made at near Ms or Ms’.
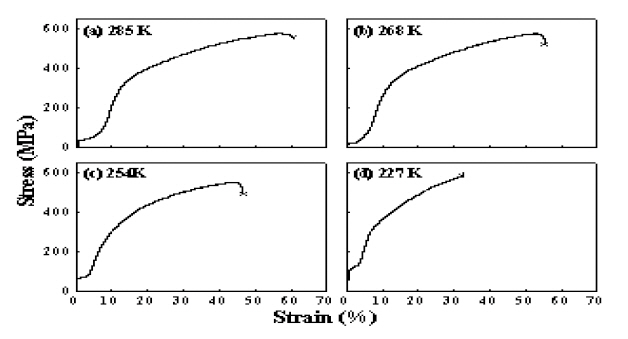
Figure 4 shows stress-strain curves obtained. Although fracture strain decreases from 60% to 32% with increasing Mn content from 0.5% to 2.0%, all Ti-(45-x)Ni-5Cu-xMn alloys are found to deform in plastic manner. Therefore, it is concluded that substitution of Ni for Mn is effective for inducing the B19 martensite with a good workability.
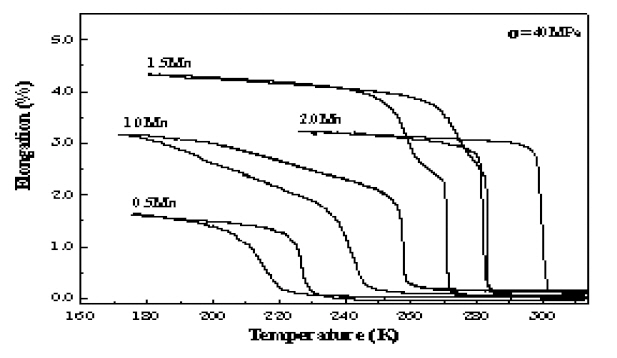
Figure 5 shows elongation vs. temperature curves of Ti-(45-x)Ni-5Cu-xMn alloy obtained from thermal cycling tests under the constant load of 40 MPa. In the curve of a Ti-44.5Ni-5Cu-0.5Mn alloy, one-stage elongation due to the B2-B19’ transformation occurs on cooling. In the curves of Ti-44.0Ni-5Cu-1.0Mn and Ti-43.5Ni-5Cu-1.5Mn alloys, two-stage elongation due to the B2-B19-B19’ transformation occurs on cooling. In the curve of a Ti-43.0Ni-5Cu-2.0Mn alloy, one-stage elongation due to the B2-B19 transformation occurs.
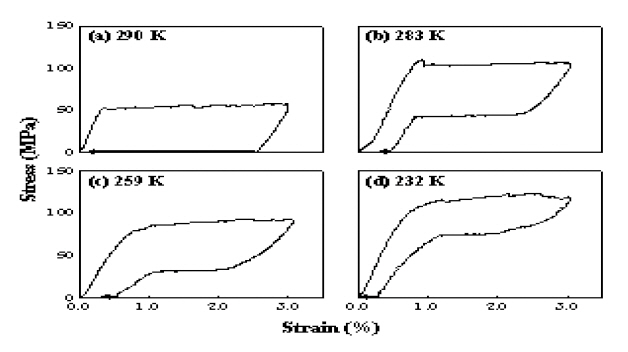
In order to investigate the superelasticity of Ti-(45-x)Ni-5CuxMn alloys, tensile tests were made on temperatures above Ms or Ms’ after heating specimens at 373 K.
Figure 6 shows stress-strain curves obtained. Clear superelasticity is found in Ti-(45-x)Ni-5Cu-xMn alloys with Mn content more than 1.0 at%. It is noted that all specimens were solution treated at 1,123 K. In a Ti-45Ni-5Cu alloy, solution treated specimens did not show the superelasticity [13]. This is ascribed to a solid solution hardening which improves the critical stress for slip deformation.
Transformation behavior, shape memory characteristics and superelasticity of Ti-(45-x)Ni-5Cu-xMn alloys were investigated. Results obtained are as follows;
1) The one-stage B2-B19’ transformation occurred when Mn content was 0.5 at%, above which the two-stage B2-B19-B19’transformation occurred.
2) A temperature range where the B19 martensite exists was expanded with increasing Mn content because decreasing rate of Ms (60 K / % Mn) was larger than that of Ms’ (40K / % Mn).
3) Ti-(45-x)Ni-5Cu-xMn alloys were deformed in plastic manner with a fracture strain of 60% ~ 32% depending on Mn content.
4) The one-stage elongation due to the B2-B19’ transformation occurred in a Ti-44.5Ni-5Cu-0.5Mn alloy, while the two-stage elongation due to the B2-B19-B19’ transformation occurred in Ti-44.0Ni-5Cu-1.0Mn and Ti-43.5Ni-5Cu-1.5Mn alloys. The onestage elongation associated with the B2-B19 occurred in a Ti-43.0Ni-5Cu-2.0Mn alloy.
5) Clear superelasticity was found in fully annealed Ti-(45-x)Ni-5Cu-xMn alloys with Mn content more than 1.0 at%, which was ascribe to a solid solution hardening by substitution of Mn for Ni.