Ti-Ni-Cu shape memory alloys with Cu content greater than 10 at% have been known to undergo the B2-B19 transformation, showing a relatively small transformation hysteresis and large transformation elongation, which is desirable for applications in actuators [1]. However, Ti-Ni-Cu alloys with Cu content greater than 10 at% are so brittle that they do not deform plastically.In order to overcome the poor workability of the alloys, many fabrication processes such as powder metallurgy [2,3] and rapid solidification [4,5] have been attempted in lieu of conventional casting. Melt-spinning enables the fabrication of Ti-Ni-Cu alloy ribbons with high Cu content directly from the melt. Since the melt-spun ribbons are generally amorphous and thus do not undergo martensitic transformation, they do not exhibit the shape memory effect and superelasticity. The ribbons crystallized under proper conditions, however, exhibit the shape memory effect and superelasticity [6]. It is essential, therefore, to understand the crystallization behavior for obtaining Ti-Ni-Cu alloys with high Cu content which also exhibit the shape memory effect and superelasticity. The amorphous phase has been used as a precursor for nanocrystalline materials. Nanocrystalline Ti-Ni based alloys display very small transformation hysteresis [7,8]. The grain size of Ti-Ni based alloys obtained by crystallizing amorphous depends on the crystallization conditions [9,10]. Therefore, it is essential to understand crystallization behavior for obtaining nanocrystalline Ti-Ni based shape memory alloys. The crystallization behavior of Ti-Ni-Cu alloys have been investigated many researchers [11,12]. However, effect of Cu content on crystallization behavior of amorphous Ti-Ni-Cu alloys was investigated well. In the present study, Ti-Ni-Cu alloys with Cu content of 20 at%, 25 at%, 27 at% and 30 at% were prepared by melt spinning. Then, the crystallization behavior of the alloys was investigated.
Ti-(50-x)Ni-xCu(at%) (x = 20, 25, 27 and 30) pre-alloys were prepared through high frequency vacuum induction melting.Billet charges of about 15 g cut from the pre-alloys were placed into quartz crucibles. The melt spinning system’s chamber was pumped down to less than 1 × 10⁻³ Pa before re-melting. After remelting,it was ejected through the nozzle on the outer surface of a rotating quenching wheel made of copper. The melt spinning temperature and the linear velocity were 1,773 K and 40 m/s, respectively.
All as-spun ribbons were electrochemically polished for removing crystalline found at the free side of ribbons. All specimens for X-ray diffraction (XRD) and differential scanning calorimetry (DSC) were cut from the polished ribbons. The crystallization behavior of the ribbons was investigated by means of DSC. The crystal structure of the ribbons was investigated by XRD using CuKα radiation.
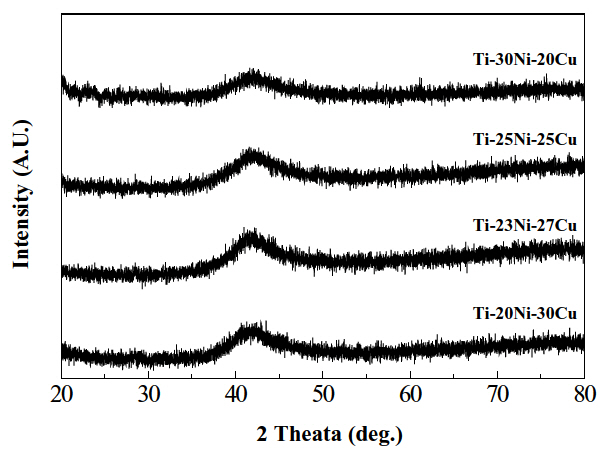
Figure 1 shows XRD patterns obtained at the free side of as-spun Ti-Ni-Cu ribbons. Broad diffraction peaks which correspond to the amorphous phase were found at 2θ-42° in all specimens. Before electrochemical polishing, a sharp diffraction peak corresponding to the B2 parent phase was found at 2θ-61° in each specimen, indicating that the ribbons consisted of the B2 parent phase as well as the amorphous phase. After electrochemical polishing, however, the sharp diffraction peaks of the B2 phase almost disappeared. This indicates that the B2 parent phase formed only at the location near the surface of the ribbons. Therefore, the conclusion follows that macroscopically fully amorphous Ti-Ni-Cu alloy ribbons were obtained by electrochemically polishing the as-spun ribbons.
The wavenumber (Qp) is defined as 4πsin θ/λ, where θ and λ are diffraction angle and wavelength of X-ray, respectively, and inversely proportional to the mean nearest-neighbor distance of local ordering clusters of amorphous alloys [13]. Therefore, as Qp becomes smaller, the glass forming ability becomes larger. From Fig. 1, Qp is calculated and then plotted against Cu content in Fig. 2.
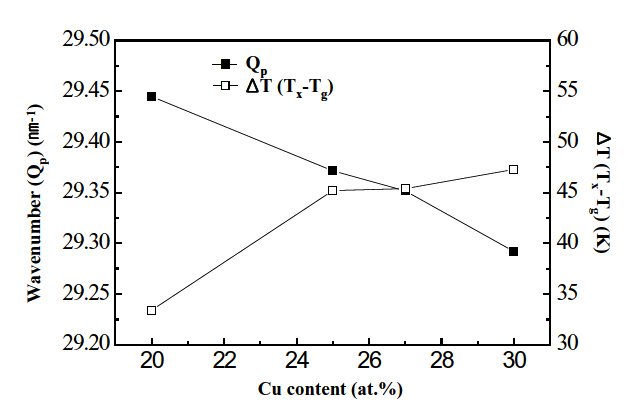
Qp decreased from 29.44 nm-1 to 29.29 nm-1 with increasing Cu content from 20 at% to 30 at%. Therefore, the conclusion follows that the glass forming ability of the Ti-Ni-Cu alloy alloys increased with increasing Cu content. Similar results were reported in Ti-Ni-Cu alloys whose Cu content was lower than 25 at% [14].
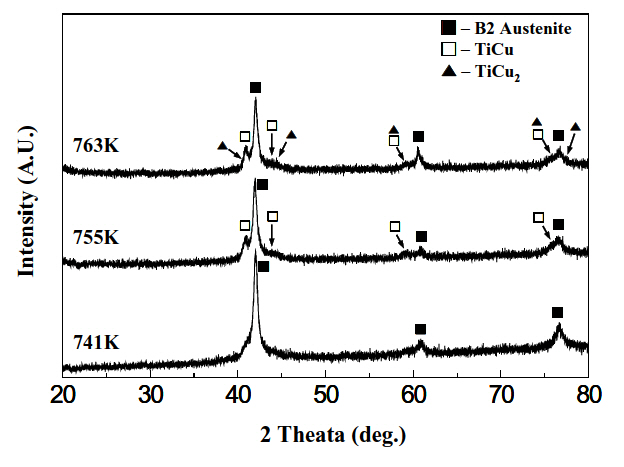
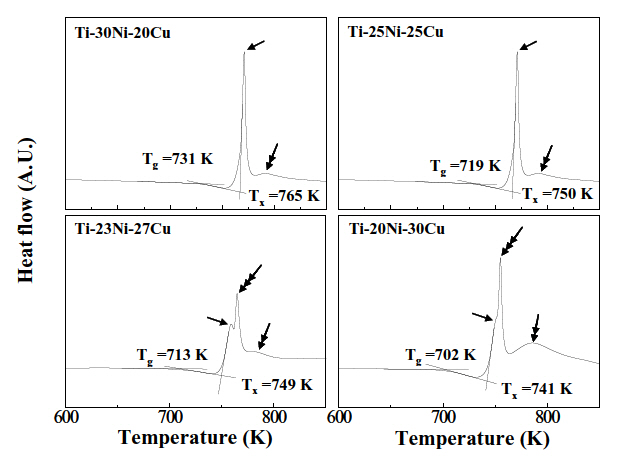
Figure 3 shows typical DSC curves of Ti-Ni-Cu alloy ribbons obtained at a heating rate of 0.42 K/sec. Two clear exothermic peaks were observed in the alloys containing a Cu-content of 20 at%, (a) and 25 at%, (b), as designated by arrows. The peak designated by a single headed arrow was ascribed to the formation of the B2 parent phase, while that by a double headed arrow was attributed to the formation of TiCu2 phase from XRD, as shown in Fig. 5(a). In contrast to Figs. 3(a) and (b), three DSC peaks appear in the alloys with Cu content of 27 at%, (c) and 30 at%, (d). In order to explain the three DSC peaks in Figs. 3(c) and (d), XRD was made on Ti-20Ni-30Cu alloy ribbons annealed at 741 K, 755 K and 763 K for 0.9 ks and then XRD patters obtained are shown in Fig. 4.
Figure 4(a) displays the pattern obtained from the specimen annealed at 741 K, where the diffraction peaks corresponding to the B2 parent phase were observed. Therefore the DSC peak designated by a single headed arrow is attributed to formation of the B2 parent phase.
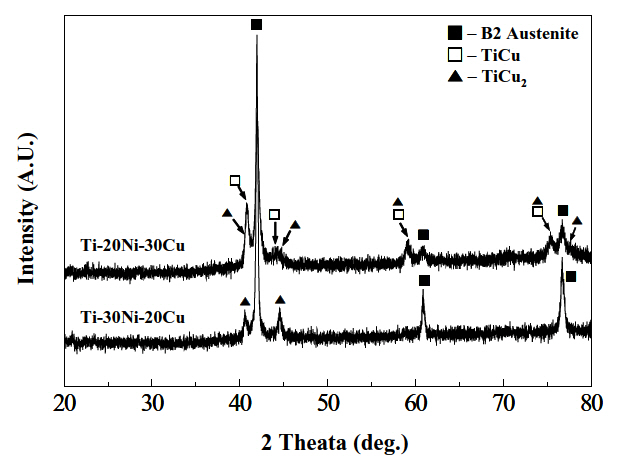
In the pattern shown in Fig. 4(b), which was obtained from the specimen annealed at 755 K, the diffraction peaks corresponding to the B2 parent phase and TiCu phase appeared simultaneously. Therefore, the DSC peak designated by a triple headed arrow was ascribed to formation of the TiCu phase. In the pattern shown in Fig. 4(c), which was obtained from the specimen annealed at 763 K, the diffraction peaks corresponding to the B2, TiCu and TiCu2 phases appeared simultaneously.Therefore, the DSC peak designated by a double headed arrow was ascribed to formation of the TiCu2 phase. Figures 5(a) and (b) are XRD patterns of Ti-30Ni-20Cu and Ti-20Ni-30Cu alloy
ribbons annealed at 823 K for 1.8 ks. The diffraction peaks corresponding to the B2 and TiCu2 phases are found in a Ti-30Ni-20Cu alloy, while those of the B2, TiCu2 and TiCu phases appear in a Ti-20Ni-30Cu alloy.
From Figs. 3-5, the conclusion follows that crystallization occurs in two-stage: amorphous-B2-TiCu2 in Ti-30Ni-20Cu and Ti-25Ni-25Cu alloys, which occurs in three-stage: amorphous-B2-TiCu-TiCu2 in Ti-23Ni-27Cu and Ti-20Ni-30Cu alloys. Similar precipitation of the TiCu phase has been observed in Ti-25Ni-25Cu(at%) alloy ribbons [15].
From the DSC curves of Fig. 3, a temperature gap (ΔT) between Tg and Tx was measured and then shown in Fig. 2. Tg and Tx were defined as the calorimetric onset temperature of glass transition and crystallization, respectively. A temperature range of super-cooled liquid region ΔT(Tx-Tg) was an important characteristic of amorphous materials.
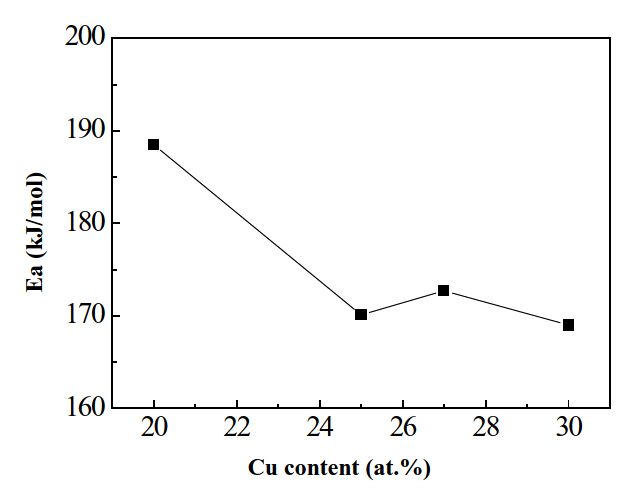
As ΔT became larger, the glass forming ability grew larger. From Fig. 2, it is found that ΔT increases from 33 K to 47 K with increasing Cu content from 20 at% to 30 at%. This observation suggests that the glass forming ability of Ti-Ni-Cu alloy ribbons increased with increasing Cu content. This is consistent with the results shown in Fig. 2. Similar results were reported in Ti-Ni-Cu alloys in which the Cu content was lower than 25 at% [14]. In addition to the curves displayed in Fig. 3, DSC curves were obtained at various heating rates ranging from 0.08 K/s to 0.42 K/s. Activation energy for crystallization were determined by Kissinger’s plot using DSC peaks corresponding to formation of the B2 phase.
ln(α/Tp 2) = C-Ea/RTp,
where C is constant, Ea is activation energy and R is the gas constant. Tp is peak temperature and α is heating rate.
Figure 6 shows calculated results for the activation energy for crystallization. Clearly, the activation energy for the formation of the B2 phase decreased from 188.5 kJ/mol to 170.6 kJ/mol with increasing Cu content from 20 at% to 25 at%; then, the activation energy remained almost constant. This indicates that amorphous Ti-Ni-Cu alloy ribbons transform into the B2 phase more easily with increasing Cu content greater than 25 at%.Therefore, the conclusion followed that the stability of Ti-Ni-Cu amorphous decreased while increasing Cu content greater than 25 at%.
Crystallization behaviors of Ti-(50-x)Ni-xCu(at%) (x = 20-30) alloy ribbons were investigated. The following results were obtained:
1) ΔT (a temperature gap between Tg and Tx) increased from 33 K to 47 K and the wavenumber (Qp) decreased from 29.44 nm-1 to 29.29 nm-1 with increasing Cu content from 20 at% to 30 at%, suggesting that the glass forming ability of the Ti-Ni-Cu alloys increased with increasing Cu content.
2) The activation energy for crystallization decreased from
188.5 kJ/mol to 170.6 kJ/mol with increasing Cu content from 20 at% to 25 at%. Afterwards, the energy remained almost constant, suggesting that the stability of Ti-Ni-Cu amorphous decreased with increasing Cu content more than 25 at%.
3) Crystallization occurs in two-stage: amorphous-B2-TiCu2 in Ti-30Ni-20Cu and Ti-25Ni-25Cu alloys, while it occurs in threestage:amorphous-B2-TiCu-TiCu2 in Ti-23Ni-27Cu and Ti-20Ni-30Cu alloys.