In recent years, the frequency of rainfall has decreased, but the rainfall intensity has shown an increasing trend during the flood season in Korea, which may be due to climate change from global warming. For this reason, the damage caused by flooding has also increased; therefore, the Korean government has been considering wetland construction as an alternative flood defense measure. The conventional structural measures, such as dams and levees, have been widely employed to mitigate flood damage and to prevent flooding. However, measures that consider not only reducing flood discharge and flood damage, but also incorporate environmental factors are currently being considered. One of the measures being pursued is the construction of wetlands, which considers reductions in both flood discharge and environmental impact.
Studies on the various uses of wetlands should not only stress flood prevention, but should also consider their use during nonflood seasons. Many countries have recently conducted studies on measures for the use of wetlands not only to prevent floods, but also for their use as ecological or environmental room during non-flood seasons.
Bradley [1] developed a wetland model, using MODFLOW, to analyze the relationship between rainfall and evaporation in wetlands and the changes in the water level in rivers due to wetlands. Connor and Gabor [2] reviewed the water level control due to the wetland located in the Saint Johns River basin in the USA and considered the possibility of using the wetland as a habitat for living organisms. Ming et al. [3] analyzed the effectiveness of flood mitigation based on the soil characteristics of wetlands. Fink and Mitsch [4] investigated the hydrologic and water quality problems affecting wetland ecosystems as part of an overall study on wetland ecosystems currently being constructed. Martinez and Wise [5] used a one-dimensional transport with inflow and storage (OTIS) model for hydrological analysis of wetlands as part of a study on wetland management. Furthermore, Conly and van der Kamp [6] analyzed the water balance within a wetland to monitor the impact of changes in climate and land use on the wetland environment. Clayton and Hicks [7] analyzed the change in water level in wetlands in order to determine how the changes in hardwood growing in wetlands has influence the hydrologic function of wetlands.
Morris et al. [8] investigated wetland construction and management in order to consider biological diversity and how to reduce flood risk, which are increasing in low regions. Also, Morris et al. [9] evaluated the administrative alternatives and funding mechanisms for the development of washlands, which have the main aim of reducing flood discharges, with the objective of integrating flood management, biological diversity and agricultural activities. Morris et al. [10] explained the relationship of ecological characteristics with the effectiveness of flood control of washlands, and argued that studies on the effectiveness of flood mitigation of wetlands and biological diversity should be conducted in tandem.
A study on wetlands should not just be confined to flood control, but also encompass a study on the link between the surrounding wetlands environment and the ecosystem. However, water should be stored in a wetland throughout the year to maintain the wetland function, especially from an ecological point of view. Hence, the water balance may be analyzed to investigate the water variability in a wetland throughout a year. Therefore, the objectives of this study were to analyze the effectiveness of wetlands for flood control via a hydraulic analysis, and then evaluate the changes in the wetlands water level to analyze the water balance throughout a year.
2. Wetland Construction for Flood Control and Ecosystem
2.1. Flood Control of Constructed Wetland During Flood Season
Every year in Korea, heavy rains fall during the wet season,from June to late August, and floods occur, which causes serious damage to both humans and property. Flooding is further exacerbated by the mountainous topography of Korea. Existing flood prevention measures to reduce such losses mainly focus on discharging flood waters into the sea through rivers via the construction of levees. However, such conventional flood prevention measures are being called into question because of their limited ability to protect ecosystems or reduce environmental
impacts, as people are becoming more environmentally conscious. Therefore, the construction of wetlands is being considered as one of the measures for preventing floods in an ecofriendly manner and to reduce the flood damages due to rivers flooding. In other words, instead of only burdening rivers with the flood discharge, a strategy of sharing the burden of flood discharges can be pursued by their distribution into a basin via the construction of riverine wetlands.
Wetlands function as a flood control measure during the flood season, that is, they can mitigate flood waves and act as a buffer area. Therefore, wetlands reduce surface runoff and act as reservoirs for the storage of the runoff. They can also receive surface water that flows from slanted surfaces in surrounding areas, and simultaneously play the role of a dam by lowering flow; thus, preventing soil erosion. Therefore, if wetlands are constructed using the area existing around a river, they can control floods and increase ecological, environmental or other productivity according to the usefulness of the area.
2.2. Ecosystem of Constructed Wetland During Non-Flood Season
When wetlands are used as an ecosystem during non-flood seasons, they will have both function and value. The flow introduced during the flood season may be maintained throughout the year for providing water to the wetland reservoir for the wetland ecosystem. Therefore, the water balance, that is, whether the stored flow during the flood season is maintained until the following flood season, is important. Maintaining a certain level of flow through the year in a wetland is very important for creating various hydrophytes and various animals, such as birds and fish. In other words, a constructed wetland can be used as a wetland ecosystem to consolidate the diverse ecological benefits as well as possess scenic value. At the same time, a wetland can be used to perform the function of improving the water quality.
3. Flood Control and Water Balance Analysis of Wetlands
3.1.1. Topyeong-cheon Stream Basin and Upo Wetland
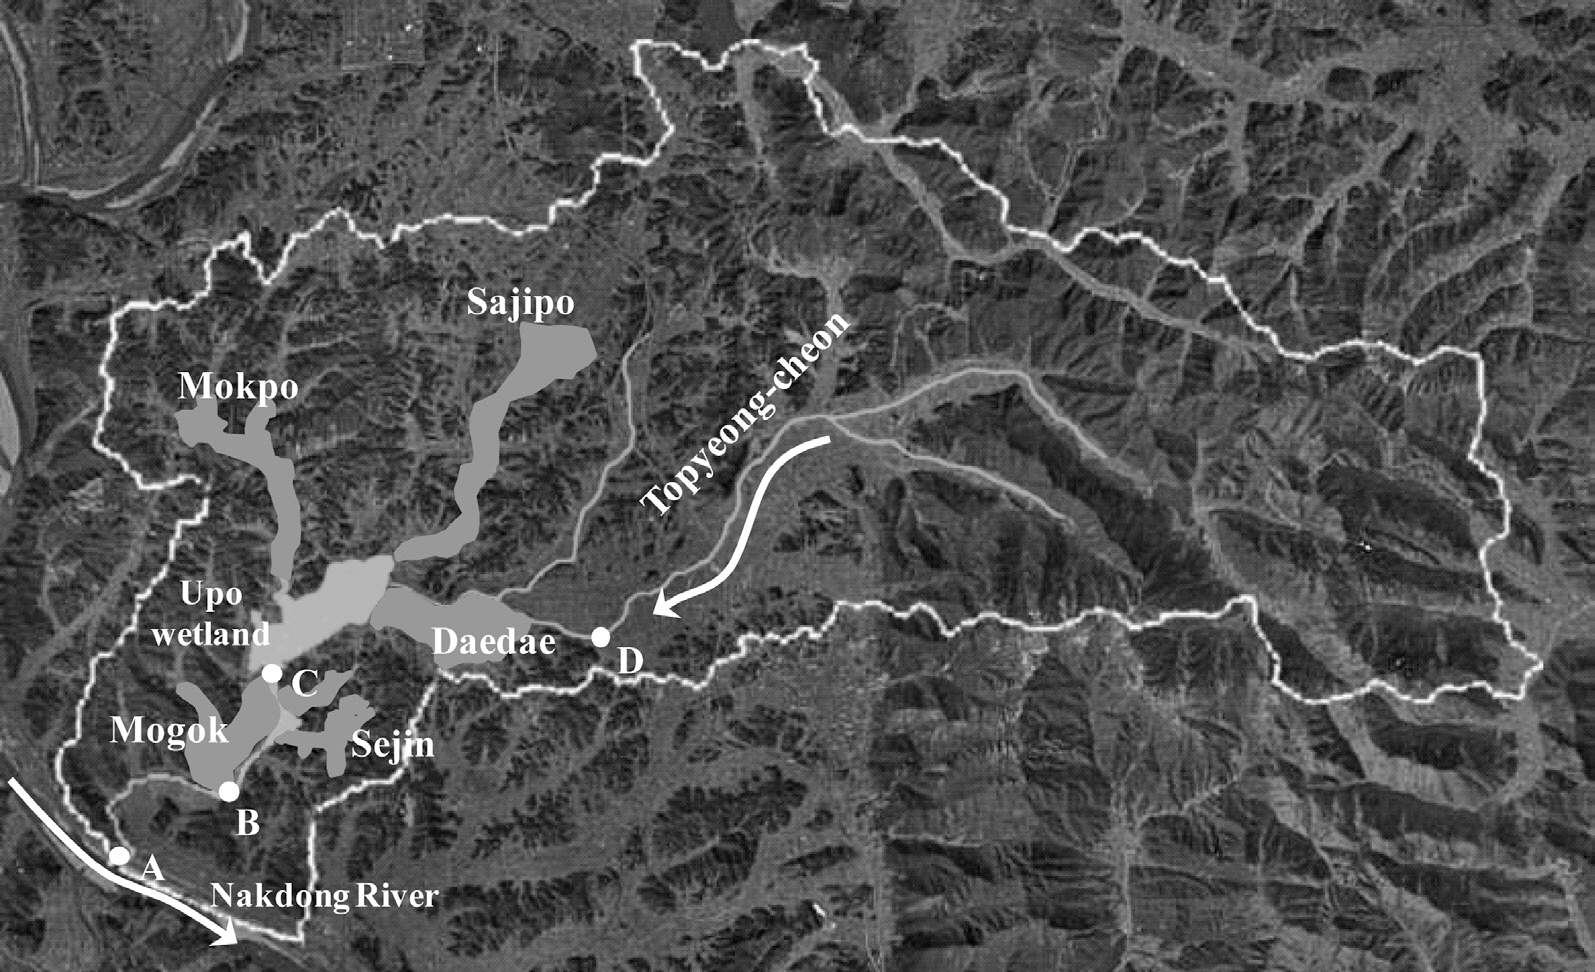
The study area was the Topyeong-cheon stream basin, which is a tributary of the Nakdong River, Korea, and flows into the left bank from the estuary about 108 km upstream, as shown in Fig.1. The basin area is 123.97 km2, and the stream length 29.570 km. The average annual precipitation in the area is 1,112.5 mm, which is lower than the average rainfall in Korea, being only approximately 87 percent of the average annual precipitation of 1,283 mm. Currently, the wetland area located in the Topyeongcheon stream basin is registered as a Ramsar wetland, and has four wetlands, including the Upo wetland, with a total area of 2,132,926 m2, composed of areas of 1,278,285, 530,284, 364,731 m2 and 139,626 m2 for Upo, Mokpo, Sajipo and Jjokjibeol, respectively.
A plan is currently underway for the construction of a wetland with the purpose of flood prevention and use as a wetland ecosystem in the Topyeong-cheon stream basin. The wetland to be constructed is located in the basin area surrounding the Upo wetland, as shown in Fig. 1. Of the areas to be constructed, those at Mogok, Sejin and Daedae, with areas of 2,806,200, 2,426,400 and 3,627,900 m2, respectively, now used as farmland and wetlands, are to be constructed artificially. Wetlands are also being constructed in Mogok, Sejin, and Daedae because they are used as farmland around the Upo wetland and have been deemed appropriate for additional wetland construction. The Sajipo and Mokpo areas currently have forms of wetlands, but these are not linked to the Upo wetland, but are separated in such a way that they are not directly linked to the Topyeong-cheon stream. Therefore, these areas were selected for construction of and use as wetlands by their direct linking to the stream.
3.1.2. Data Collection
The HEC-RAS(Hydrologic Engineering Center-River Analysis System) and SWAT(Soil Water Assessment Tool) models were used to analyze the reduction in the flood level during the flood season and to analyze the water balance during the non-flood season in wetlands to be constructed. First, the data needed for the HEC-RAS model to analyze the flood control included the stage hydrograph, flow hydrograph and stage-discharge rating curve, which were obtained from the Ministry of Construction and Transportation [11].
The meteorological data required to analyze the water balance via the SWAT model included precipitation, daily maximum/minimum temperatures, wind speed, relative humidity and solar radiation. These data were measured at the Miryang, Jinju and Youngcheon stations, which are located around the Topyeong-cheon stream basin and managed by the Korea Meteorological Administration (KMA). Thus, daily data for 31 years from 1975 to 2005 were obtained.
3.2.1. Wetland Construction Scenarios
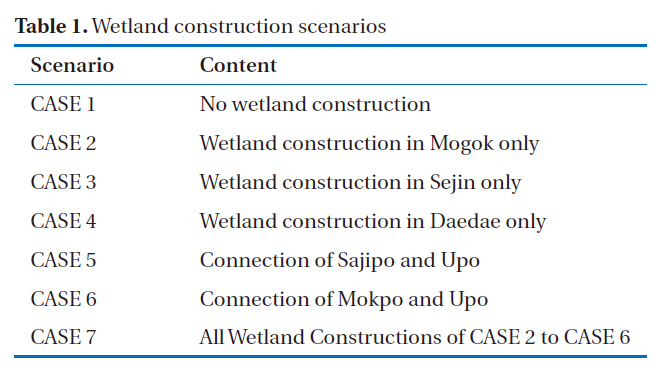
This study assumed wetland construction scenarios for analyzing flood control during the flood season and investigated the water balance with respect to the functions of the wetlands. The assumed wetlands were to be constructed around the Upo wetland located in the Topyeong-cheon stream basin, Nakdong river, Korea, which is a Ramsar site deemed to be of international importance under the Ramsar Convention. The wetlands to be constructed can be connected to the Upo wetland, with their usability during the non-flood season also deemed to be high. The area of the wetland construction around the Upo wetland, shown in Fig. 1, is comprised of five areas; Mogok, Sejin, Daedae, Sajipo and Mokpo. Currently, the Mogok, Sejin and Daedae areas are all used as farmlands and yield special products for the region. Therefore, this study assumed the construction of artificial wetlands in these three areas. The other areas; Sajipo and Mokpo, have maintained the form of their wetlands over time and were previously directly connected to the Upo wetland. However, they are now separated from the main Topyeong-cheon stream by floodgates and a drainage pump facility; therefore, the flood discharge generated during the flood season does not flow into the wetlands. These two areas were assumed to be connected to the main Topyeong-cheon stream in the present state, without any artificial construction, with the flood discharge during the flood season flowing into them. Therefore, seven wetland construction scenarios were assumed in this study, as shown in Table 1. CASE 1 refers to keeping the present state, without any wetland construction. CASEs 2-4 refer to the construction of wetlands in Mogok, Sejin and Daedae, respectively. CASEs 5 and 6 assume connecting Sajipo and Mokpo to the Upo wetland located in the path of the Topyeong-cheon stream. Finally, CASE 7 assumed the application of CASEs 2 to 6.
3.2.2. Construction of the HEC-RAS Model for the Flood Control Analysis
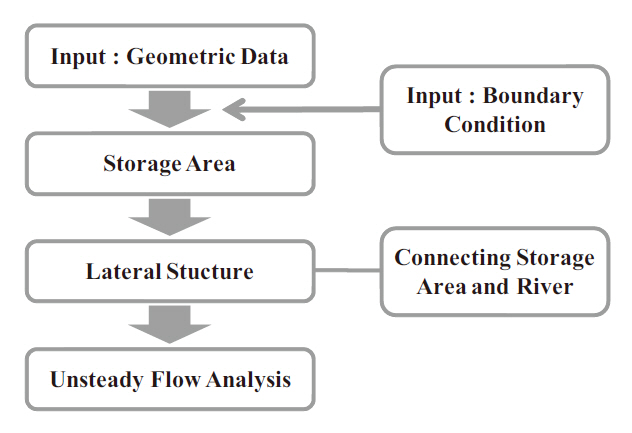
The effect of flood control due to the construction of wetlands was analyzed using the HEC-RAS model. For the analysis, three conditions are required: (1) When evaluating unsteady flow by the HEC-RAS model, the boundary conditions were used as input data. (2) The function of the “Storage Area” provided in the HEC-RAS model was used to construct wetlands. The storage volume of the wetlands can be input as the storage with respect to the elevation level. (3) To connect the constructed wetlands to the river, the lateral structure provided by the HEC-RAS model was used, where a weir was used as the lateral structure.
(1) Boundary conditions
The boundary conditions in the HEC-RAS model can be divided into upstream and downstream conditions. This study used the
[Table 1.] Wetland construction scenarios

Wetland construction scenarios
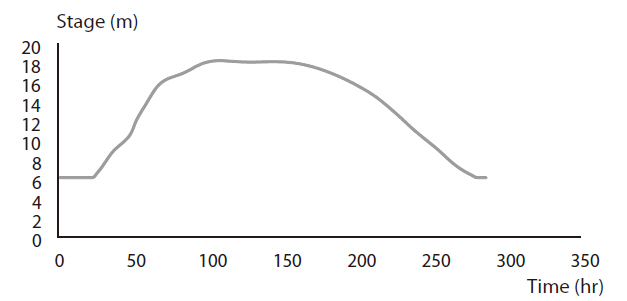
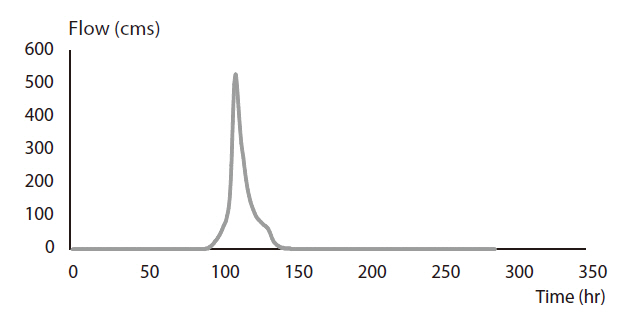
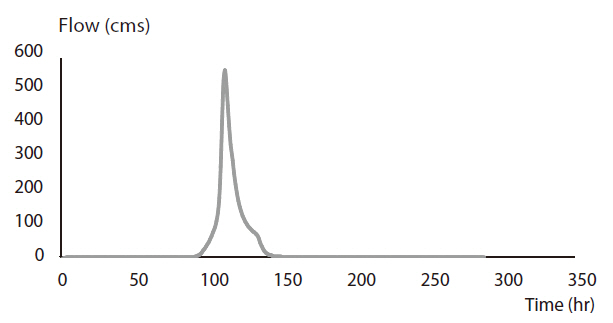
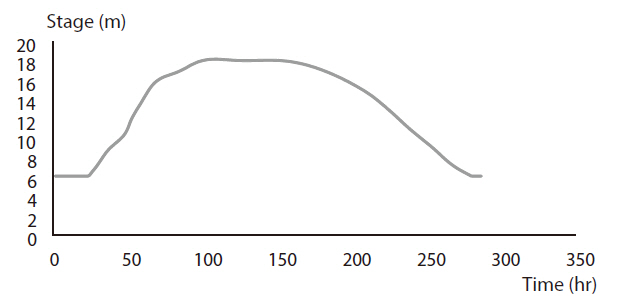
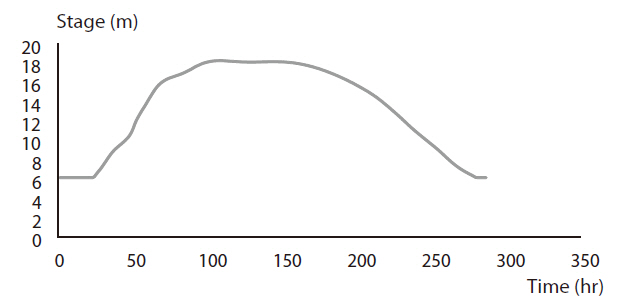
flow and stage hydrographs as the upstream and downstream boundary conditions, respectively. Flow hydrographs are the values resulting from the calculation of flood discharge by combining channel routing and the hydrograph after calculating the flood discharges of each small basin. Also, because the stage hydrograph is greatly influenced by the backwater effect of the Nakdong River, which is the main river of the Topyeong-cheon stream, it was calculated by assuming that a flood had occurred in the Topyeong-cheon stream basin after the water level of the Nakdong River had raised and using the water level of the Nakdong River. Figs. 2-5 show the stage and flow hydrographs for
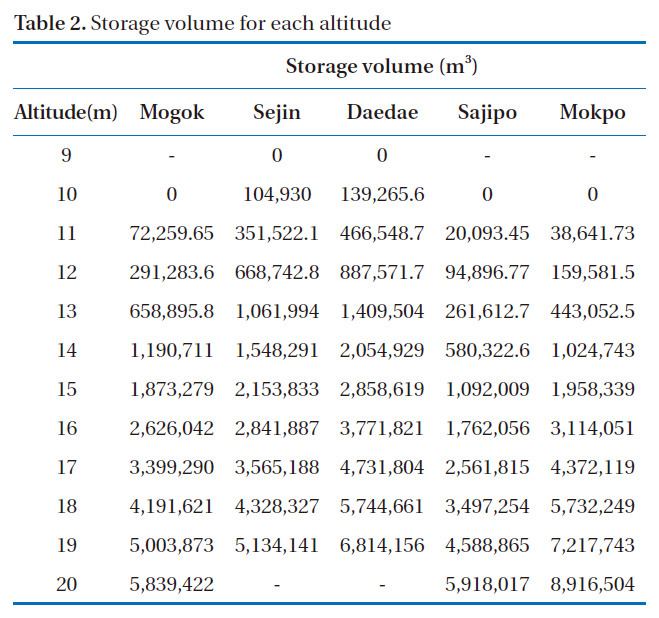
[Table 2.] Storage volume for each altitude

Storage volume for each altitude
80 and 100 year frequencies that were used as a boundary condition.
(2) Storage of the constructed wetland
When constructing wetlands using the HEC-RAS model, the storage volumes of water for each altitude had to be specified for each assumed wetland area, which are shown in Table 2. The altitudes in Table 2 indicate the elevation of each constructed wetland area. The lowest altitudes at Sejin and Daedae were both 9 m, and the lowest altitudes at Mogok, Sajipo and Mokpo were all 10 m. The height of the levee was lower than 20 m and;therefore, the storage volumes for the altitudes from 9 or 10 m to 20 m were obtained, as shown in Table 2.
(3) Lateral structure
To connect the constructed wetland to the channel, the HECRAS model needs a lateral structure, which can be a weir, floodgate or culvert. Of these lateral structures, a weir was used to connect the wetland to the channel. By changing the weir width and height, it was found that the height was deemed to influence the flood level more than the width. Therefore, assuming that the width of the weir to be 90 m, the height of the weir that would produce the greatest flood control was calculated as follows. First, the weir’s initial height was set at 16-20 m, considering that the flood level for the 80 year and 100 year frequency at each site was 18.28-19.26 m in the study area. Then, the weir height was changed by 0.1 m each time to determine the flood control effect, which was obtained when the reduction in the flood level was the highest. The HEC-RAS model can be used for analyzing the flood control due to the construction of a wetland,
3.2.3. Flood Control Effect of the Constructed Wetlands
The effect of flood control due to the construction of wetlands was analyzed using the 80 and 100 year frequencies for each of the seven simulated scenarios. To analyze the flood control, a
weir provided in the HEC-RAS model was used as the connection between the river and the wetland. After determining the weir height that produced the maxima flood control in Mogok, Sejin and Daedae areas, where the wetlands had been assumed to be constructed, the flood control exerted by each wetland with respect to the weir height were compared with changes in the flood level. The Sajipo and Mokpo scenarios, which are already existing wetlands, were then considered. Here, the drainage pump facility and floodgate separating the wetlands from the river were discarded and a weir was installed. In order to restore these two areas as wetlands by their connection to the Upo wetland, the weir height was set at the level of the river bed. Thus, the weir heights for Sajipo and Mokpo were set at 10 and 8 m, respectively. The weir heights for the Mogok, Sejin and Daedae areas were set at the height where the water level reduction was the greatest at major points by changing the elevation by 0.1 m between 16 and 20 m. As a result, the appropriate height of the weir was determined to be 17.1 m for both the 80 and 100 year frequencies in the case of Mogok and Sejin. In the case of Daedae, the elevation was found to be 16.9 m for both the 80 and 100 year frequencies.
Using the weir heights calculated above, a hydraulic analysis was carried out, with the flood control by frequency determined at flood level of each major point. If wetlands were constructed in each study area, flood control, with a maximum of 0.29 m for
[Table 3.] Flood level mitigation (unit: m)
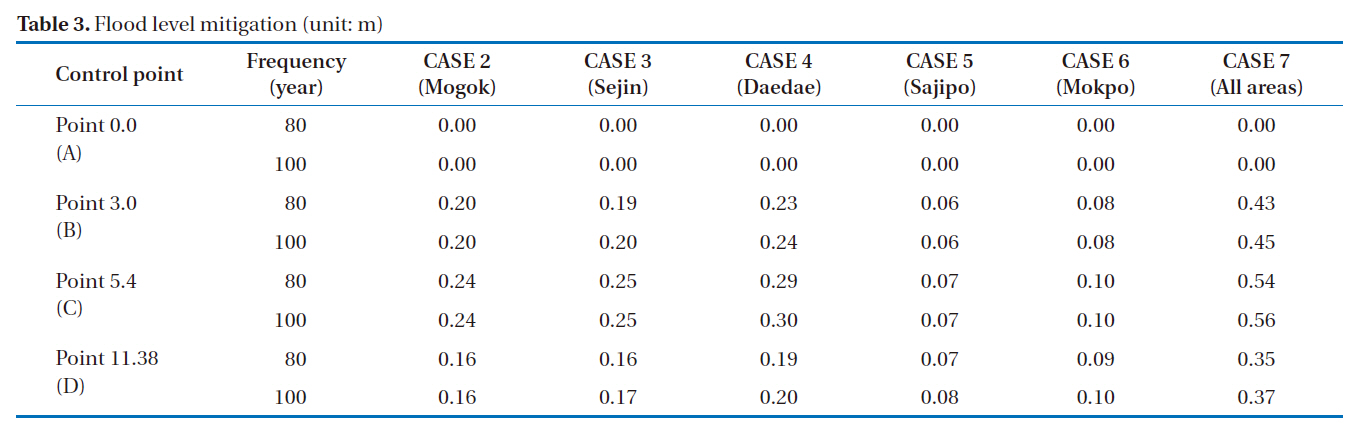
Flood level mitigation (unit: m)
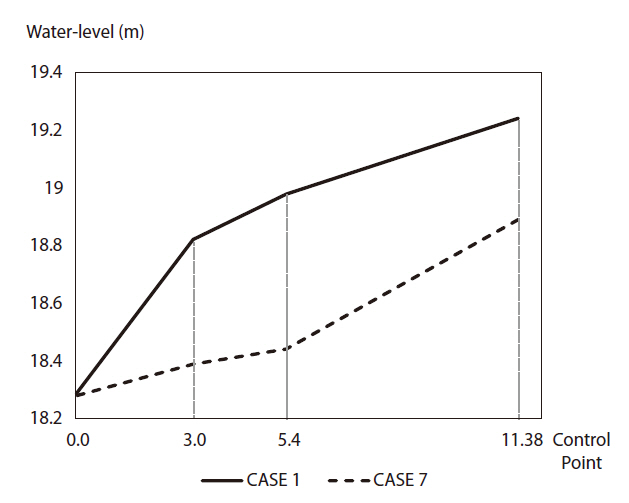
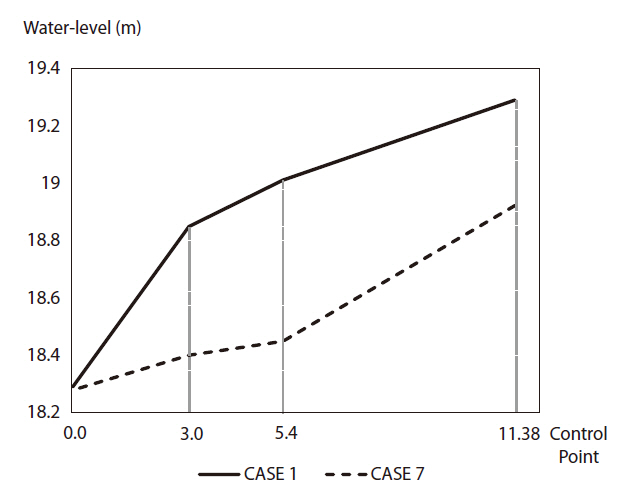
an 80 year frequency and a maximum of 0.30 m for a 100 year frequency, would be obtained. When wetlands are constructed in all five places; Mogok, Sejin, Daedae, Mokpo and Sajipo, the flood levels for the 80 and 100 year frequencies of 0.54 and 0.56 m, respectively, were reduced; thus, these levels would give the maximum flood control effect. Table 3 shows the flood control due to the construction of wetlands at major points. Here, the major points are four sites; point 0.0(A) where the Topyeongcheon joins the Nakdong River, point 3.0(B) downstream of Sejin,point 5.4(C) downstream of Upo wetland and point 11.38(D) upstream of Topyeong-cheon. The locations of these major points are indicated in Fig. 1.
To determine how the water level changes at each major point away from the constructed wetlands, CASE 1, without a constructed wetland, and CASE 7, where five wetlands had been constructed for most effective flood control, were selected from the seven scenarios, with the water-level values at the major points for the 80 and 100 year frequencies are shown in Figs. 7 and 8, respectively.
3.3. Water Balance Analysis for the Constructed Wetlands
3.3.1. SWAT Model Construction
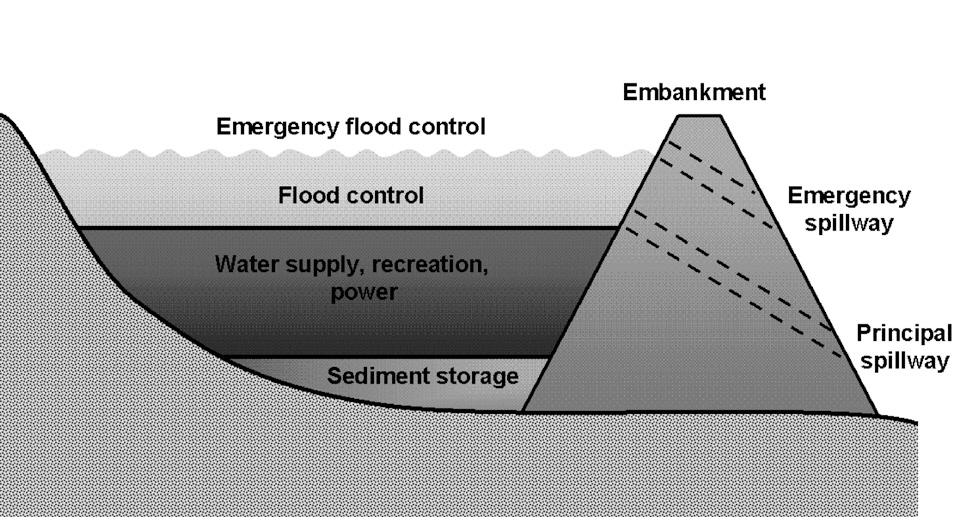
The reservoir runoff computation method of the SWAT model was used to compute the water-balance. The structure of the reservoir in the model is shown in Fig. 9. The surface area of the water body with respect to the reservoir capacity was computed based on the water level and surface area of the water body of an emergency spillway and the principal spillway as follows:
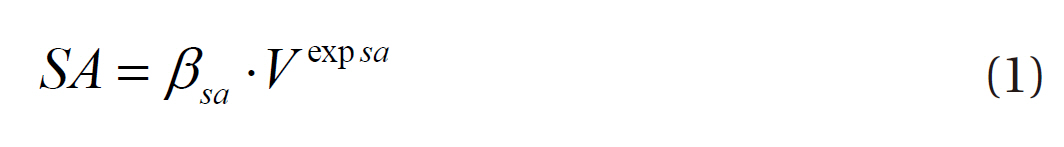
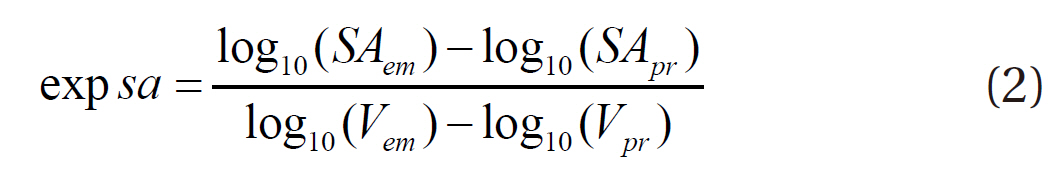
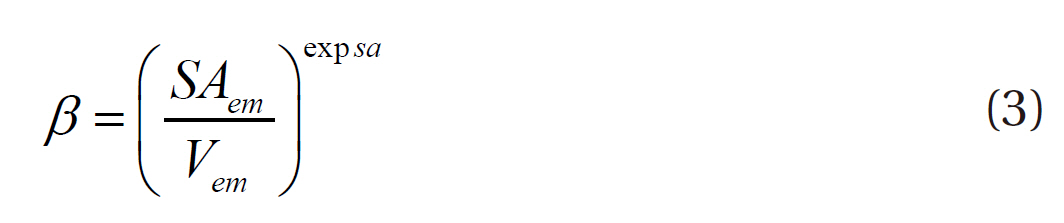
Here, SA is the surface area of the reservoir (ha); V the volume of storage (m3), expsa the exponent;
and
In the SWAT model, the water-balance that computes the reservoir storage was calculated as follows:
Here,
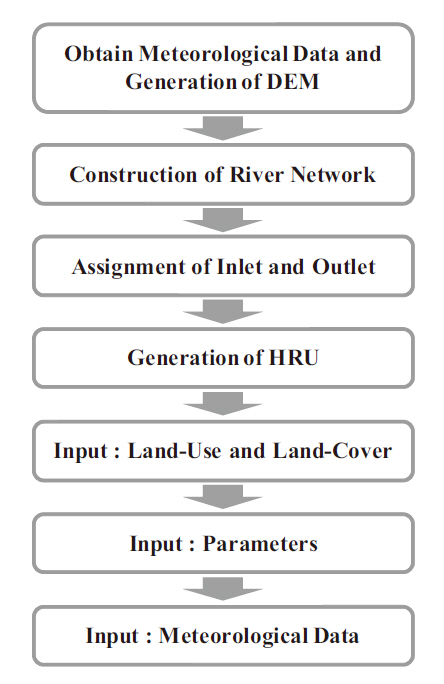
This study considered that the construction of wetlands in Topyeong-cheon stream basin could be used for flood control during the flood season and ecologically during the non-flood season. The basin is located in Upo wetland, the largest inland wetland in Korea, which has been registered as a Ramsar wetland. The process of establishing the SWAT model can be divided into the collection of meteorological data, DEM (digital elevation model) generation, division of the study area, and input of soil and land-use maps (Table 4). Fig. 10 summarizes the overall process of establishing the SWAT model. Because the runoff simulation using the SWAT model is based on the water-balance equation, basic hydrological and meteorological data have to be input, including rainfall, maximum/minimum daily temperatures, air velocity, relative humidity and solar radiation. In addition, data on the location of the observation stations, runoff measurements and reservoir water level may also be necessary in some cases.
3.3.2. Sensitivity and Calibration of Parameters
The reservoir runoff computation method and the impoundment water routing function of the SWAT model were used to compute the water-balance and to assess the maintenance of a flow depth in the constructed wetlands. Detention ponds, which are the constructed wetlands, have to be built for impoundment water routing. When building detention ponds, the initial value of the area meeting the specifications was used as an input. For the initial storage volume value, the HEC-RAS model was used to compute the value corresponding to a two-year frequency. The resulting value for the storage volume is shown in Table 5.
To calibrate the SWAT model, a sensitivity analysis of the parameters was carried out. The goal of this analysis was to identify especially sensitive parameters in the model. Parameters were calibrated by comparing the observed runoff with that simulated by the model.
[Table 4.] Information required for the SWAT model
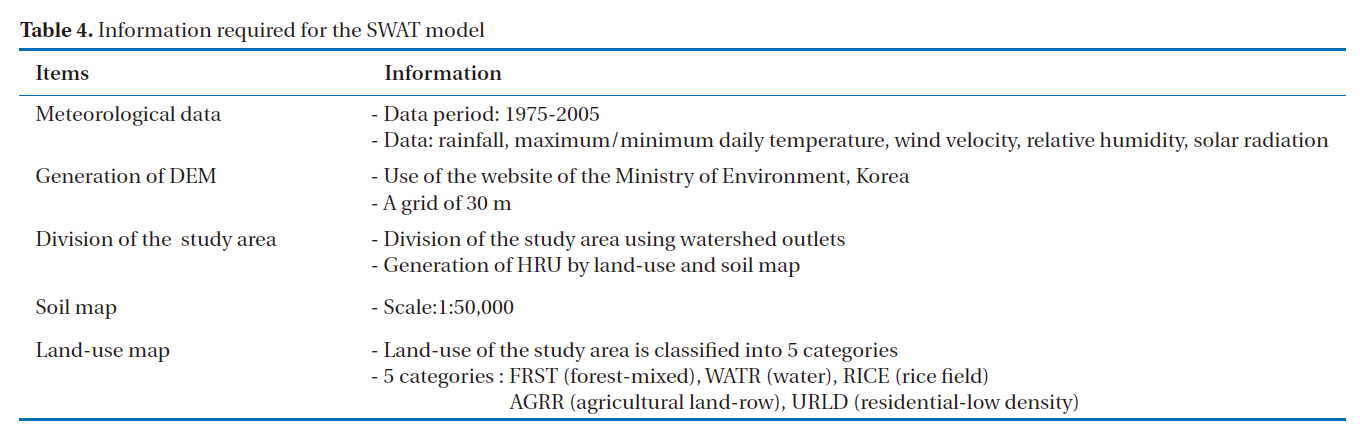
Information required for the SWAT model
[Table 5.] Storage volume for each wetland construction (unit: 1000 m3)
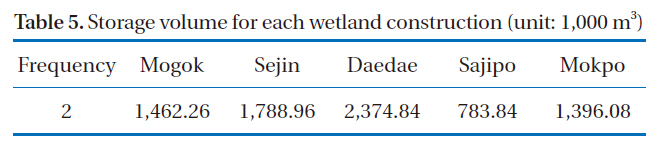
Storage volume for each wetland construction (unit: 1000 m3)
The sensitivity analysis included the SWAT model parameters that affected the runoff and evapotranspiration, groundwater parameters, (HRU)-related parameters and soil-related parameters. A total of 11 parameters were subjected to the sensitivity analysis: four ground-water parameters, one HRU general parameter, two soil parameters, one main channel parameters and three management parameters (Table 6). The results of the sensitivity analysis showed that the CN_2 value, which illustrated the SCS curve number of AMC-II, was the most influential parameter of the management parameters at affecting runoff. The calibrated values are shown in Table 6.
3.3.3. Water-Balance Analysis of Wetlands
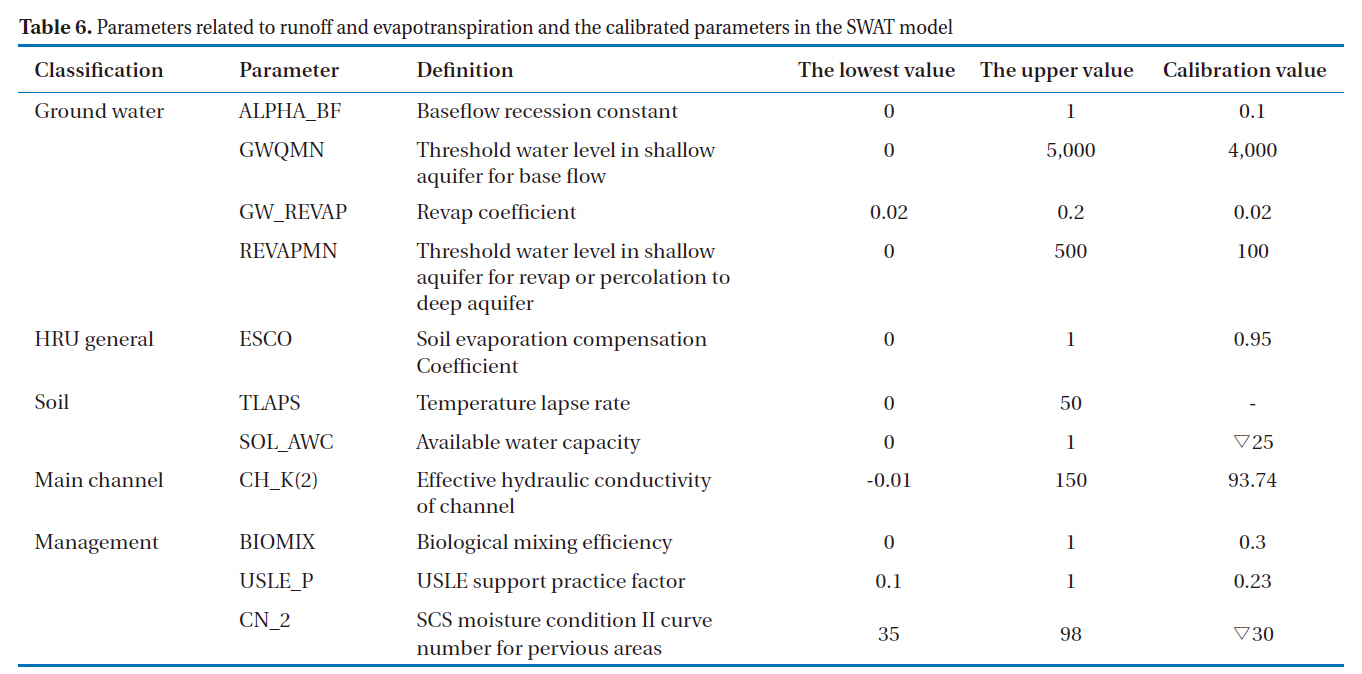
Parameters related to runoff and evapotranspiration and the calibrated parameters in the SWAT model
After the construction of wetlands in the Mogok, Sejin and Daedae areas, water-balance analyses were carried out using the SWAT model to evaluate the possibility of using the areas as wetlands during the non-flood season. The instream flow to wetlands was also analyzed, because a specific water-level has to be maintained throughout the year for the use of the constructed wetlands as an ecological system; therefore, a water-balance analysis was carried out for verification.
The period of the simulation for the water-balance analysis ranged from August 2004 to July 2005. The simulation was carried out with a storage volume corresponding to a two-year frequency as an initial value to evaluate the possibility of using the constructed wetlands ecologically during non-flood seasons.
To assess the outflow and evaporation during the simulation period after the wetlands had been constructed, the outflow and evaporation before and after the construction were compared(Table 7). The values of the evaporation and outflow were the daily averages per unit area for a one-year period. The results showed that the evaporation value was larger after construction; whereas, the outflow value was larger before construction.
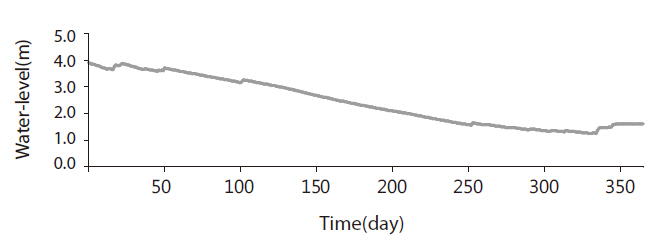
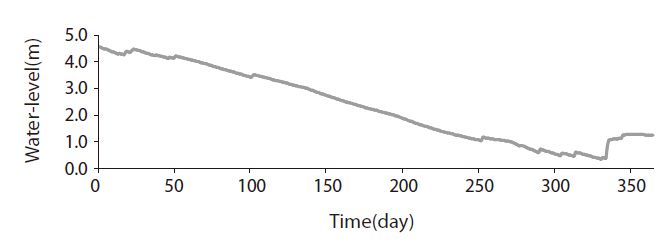
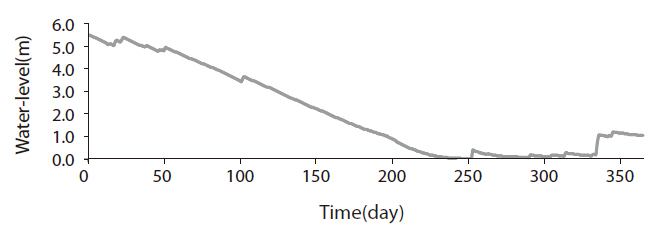
The change in water depth was simulated in each wetland to identify the amount of annual instream flow. The instream flow was affected only by the weather conditions (rainfall, temperature, solar radiation, humidity and wind speed), with no runoff to external areas. The results from the water depth change analyses in Mogok, Sejin and Daedae, where the wetlands were built, are shown in Figs. 11-13.
Graphs of the changes in the water levels at the constructed wetlands show that the most pronounced water level change occurred at Daedae, where the water level decreased from about 5.5 to 0.0 m. In the Sejin area, the water level varied from a maximum of about 3.9 m to a minimum of about 1.3 m; whereas, that at Mogok ranged from about 0.5 m to about 4.6 m.
In this study, the impact of the construction of wetlands on
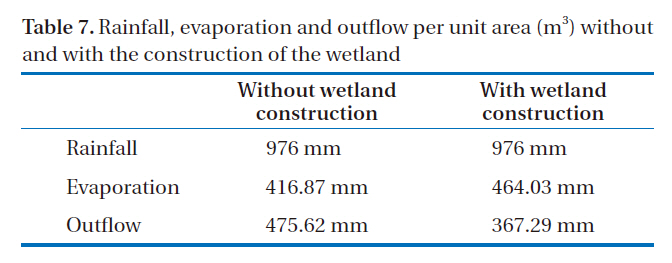
Rainfall evaporation and outflow per unit area (m3) without and with the construction of the wetland
flood level reduction was analyzed, with a hydrological analysis performed to consider the possibility of using the constructed wetlands ecologically during non-flooding periods.
It was initially found that the degree of flood level reduction depended on the height of the weir linking the river channel with the wetland. This means that there is an optimum weir height that maximizes the flood level reduction. If the weir height is much higher than the flood level, the water volume entering the constructed wetland decreases, as the flood inflow cannot properly reach the wetlands. If the weir height is much lower than the flood level, the inflow of flood discharge causes saturation of the constructed wetland before the peak is reached, where no flood level reduction can be expected.
The analysis using the HEC-RAS model showed that the flood level reduction continually decreased in lower river streams, because the runoff entering the flow from subbasins around the river and tributaries increases in the lower parts of the stream. This directly affects the volume of river inflow by increasing the water volume in the downstream areas and reducing the flood level.
For the use of the constructed wetlands as ecological wetlands, the water-balance analysis of the wetlands shows that the amounts of discharge and evaporation were greatly changed by the construction of the wetlands. This noticeable change was due to the storage of rainwater runoff by the wetlands. Apparently, the inflow into wetlands undergoes infiltration and evaporation for a certain length of time, which affects the amounts of discharge and evaporation in the basin.
Simulations using the SWAT model, which consist of analyses of the water level changes to consider the levels of instream flow into the wetlands of the Sejin, Mogok and Daedae areas, showed that the construction of wetlands in Sejin and Mogok would enable a certain water level to be maintained due to the storage of rainfall. In the case of the wetland in the Daedae area, a water level cycle of complete depletion and replenishment was observed. This means that the wetlands in Sejin and Mogok can be used as ecological wetlands during non-flooding periods, because the water volume would be maintained throughout the year. Because temporary complete depletion occurs in the Daedae area, additional study on the wetland management would be necessary for the use of this area as ecological wetlands.
A reduction in the flood level will occur in some cases. Therefore, most of the wetlands can be used as ecological wetlands during non-flooding periods. In this study, the possibility of using constructed wetlands for environmental linkage with the surrounding environment as ecological wetlands has been considered. Therefore, the construction of wetlands for flood prevention can be used for diverse goals during non-flood seasons, provided they coexist harmoniously with the neighboring environment. To diversify the usage of wetlands, it is necessary for diverse studies to be performed on the construction, usage and management of wetlands.