Atmospheric CO2 increases partially as the result of all anthropogenic activities, most notably the usage of fossil fuels (Moore and Bolin 1986) and deforestation (Detwiler and Hall 1988); atmospheric CO2 is expected by some to increase to 760 ppm within the next few decades. The impact of this increasing concentration on ecosystems has been an issue of some controversy among environmentalists for several decades (IPCC 2007).
The effects of increased CO2 have been extensively studied in terrestrial ecosystems (Mooney et al. 1991), usually with a focus on primary production and changes in the physiological characteristics of plants (DeLucia et al. 1999). Generally, increases in plant biomass and primary production have been observed as the result of increased CO2, and were seen in C3 plants rather than C4 plants. The C:N ratio in green leaves was also increased with rising CO2 concentrations, because C components like starch were increased and N contents were reduced as the result of elevated CO2 levels (Cotrufo and Ineson 1996). However, litter chemistry did not change with increases in CO2 levels (Hirschel et al. 1997). Soil environments associated with plant roots were also reported to be affected by elevated CO2. For example, root biomass and growth were also shown to be increased (Cheng and Johnson 1998) in C3 plants. In addition to the observed changes in the physiological characteristics of plants, Carney et al. (2007) previously demonstrated that elevated CO2 could alter the microbial community in forest soil, such that the amount of carbon in the soil could be reduced as the result of enhanced fungal abundance and activity.
This is an Open Access article distributed under the terms of theCreative Commons Attribution Non-Commercial License (http://creativecommons.org/licenses/by-nc/3.0/) which permits unrestrictednon-commercial use, distribution, and reproduction in any medium,provided the original work is properly cited.
Salt marshes are vegetated coastal habitats, and have been recognized as one of the most productive types of ecosystem. Salt marshes contribute to the nutrient balance of adjacent ecosystems by regulating the flux of material between sediment and overlying water (Neubauer and Anderson 2003, Sousa et al. 2008), a process in which microorganisms perform a key role. For instance, despite its small area, accounting for < 2% of the area of the ocean (Duarte and Cebrian 1996), net ecosystem production in salt marshes can support secondary production or respiration of microorganisms in adjacent ecosystems (Duarte et al. 2005). Therefore, the changes in primary production in these vegetated coastal habitats that may eventually be induced by elevated atmospheric CO2 are expected to affect not only these ecosystems themselves, but also the marine ecosystems adjacent to the salt marshes.
It has been previously reported that elevated CO2 increases photosynthesis, shoot density, above ground biomass, and C:N ratios in green leaves in salt marshes in which C3 plants predominate (e.g.
Increased CO2 could affect not only plant physiology and geochemistry in soil, but also physical characteristics in the soil of salt marshes. Enhanced root productivities in salt marsh as the result of elevated CO2 were recently determined to affect the physical stability of the soil in those ecosystems (Langley et al. 2009). Enhanced root productivities were implicated in an increase in soil elevation gains, and thus it may prove possible to compensate for the extent of the threat posed by future rises in sea level to salt marshes.
Responses of microbes to elevated CO2, most notably changes in activity and community structure, have been fairly thoroughly studied in terrestrial ecosystems (Mooney et al. 1991); the results indicated that elevated CO2 levels could alter nutrient cycling and organic matter decomposition capacities. Extracellular enzymes decompose particulate organic matter into smaller organic matter, thereby allowing microorganisms to use it directly. Therefore, decomposition by extracellular enzymes can be considered a rate-limiting step in the decomposition of organic matter (Meyer-Reil 1991, Azam 1998). Elevated CO2 was reported to influence the activities of phenol oxidase, which is related with recalcitrant carbon (Carney et al. 2007) in terrestrial ecosystems. Sulfate-reducing bacteria are important to the biogeochemistry of salt marsh sediments, as sulfate reduction is the principal process relevant to the decomposition of organic matter (Goldhaber and Kaplan 1975, Howarth and Hobbie 1982), one of the hallmark ecosystem functions of salt marsh sediment.
In this study, the impacts of elevated CO2 on extracellular enzyme activities and changes in the community structure of sulfate-reducing bacteria in salt marsh sediment were analyzed in order to determine the effects of elevated CO2 on organic matter decomposition capacity in salt marsh sediments.
>
Sampling and setting growth chamber
Sampling was conducted in May 2005, in a salt marsh located at Hwangsan-do, where
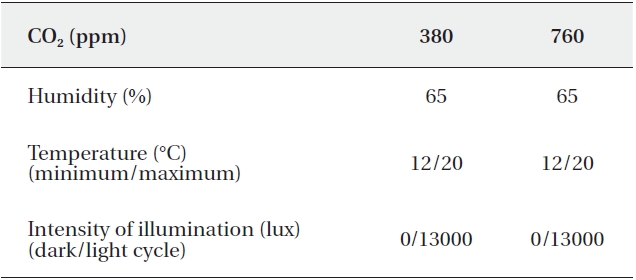
[Table 1.] Operating conditions of growth chambers

Operating conditions of growth chambers
Sediment samples for analyzing each measurement were obtained from surface (depth 0-1 cm) and rhizosphere sediment (4-5 cm) at approximately 2-week intervals. Water content in the sediments were measured after 24 hours of drying at 103℃, and organic matter content in the sediment was measured after combusting the dried samples for 24 hours at 600℃ (loss on ignition).
Extracellular enzyme activities were measured via the methylumbelliferyl-substrate method for β-glucosidase and N-acetylglucosaminidase, and the methylcoumain-substrate method for aminopeptidase (Hoppe 1983, 1993). Substrate solutions for β-glucosidase, N-acetylglucosaminidase, and aminopeptidase were prepared using 4-methyl-β-glucoside (400 μM; Sigma), 4-methyl-N-acetylglucosamine (400 μM), L-leucine-7-amido-4-methyl-coumarin (1,000 μM), respectively. Fluorescence was analyzed via a fluorometer (TD 700; Turner designs, Sunnyvale, CA, USA) with an excitation/emission wavelength of 360 nm/430 nm for β-glucosidase and N-acetylglucosaminidase and 380 nm/440 nm for aminopeptidase.
DNA in 0.5 g of sediment was extracted using an UltraClean soil DNA kit (MoBio, Solano Beach, CA, USA) following the manufacturer's protocols. In order to analyze the community structure of sulfate-reducing bacteria, the
The digested amplicons were then precipitated with 35 μL of 95% ethanol and centrifuged for 15 min at 16,000× g. The DNA pellet was rinsed with 70% ethanol, dried, and resuspended in a mixture of 14.5 μL of deionized formamide and 0.5 μL of DNA fragment length internal standard (TAMRA 500; Perkin-Elmer Life Sciences Inc.). Following electrophoresis, restriction enzyme reactions were conducted with the restriction enzyme
Mann-Whitney analysis was conducted to determine whether there were any significant differences between surface and rhizome soils and between the 380 ppm CO2 treatment and 760 ppm CO2 treatments (SPSS ver. 12.0; SPSS Inc., Chicago, IL, USA ).
>
pH, water content and organic matter content
The results of pH, water content and organic matter content were listed in Table 2. pH in surface soil was analyzed to be 7.12 and 7.14 on average under 380 ppm CO2 and 760 ppm CO2, respectively. In rhizome soil, it was measured to be 7.29 and 7.22 on average under 380 ppm CO2 and 760 ppm CO2, respectively. Both in surface and in rhizome soil, pH was not significantly different by CO2 treatments.
Water content in surface soil was analyzed to be 25.52% and 23.59% on average under 380 ppm CO2 and 760 ppm CO2, respectively, which were not significantly different. However, in rhizome soil, water content of 22.07% on average under 380 ppm CO2 was reported to be significantly higher than that of 20.05% on average under 760 ppm CO2 (Mann-Whitney U test,
Organic matter contents in surface soil were reported to be 4.49% and 4.71% (on average) in the 380 ppm CO2 and 760 ppm CO2 treatment groups, respectively. In rhizome soil, the organic matter contents were measured to be 4.75% and 3.41% (on average) in the 380 ppm CO2 and 760 ppm CO2 treatment groups, respectively. Similarly, no significant differences in pH were detected between the CO2 treatment groups.
[Table 2.] Summarized data for pH, water content and organic matter content
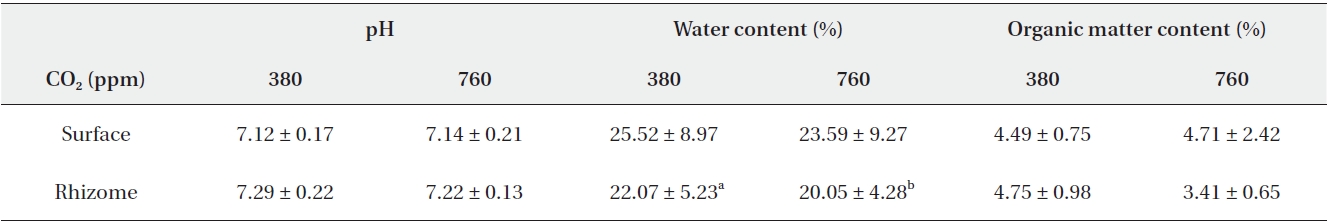
Summarized data for pH, water content and organic matter content
[Table 3.] Summarized P-values of Mann-Whitney analysis
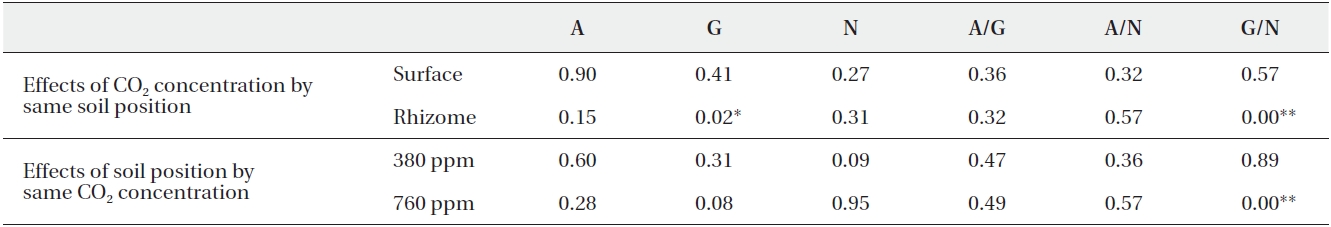
Summarized P-values of Mann-Whitney analysis
>
Extracellular enzyme activities
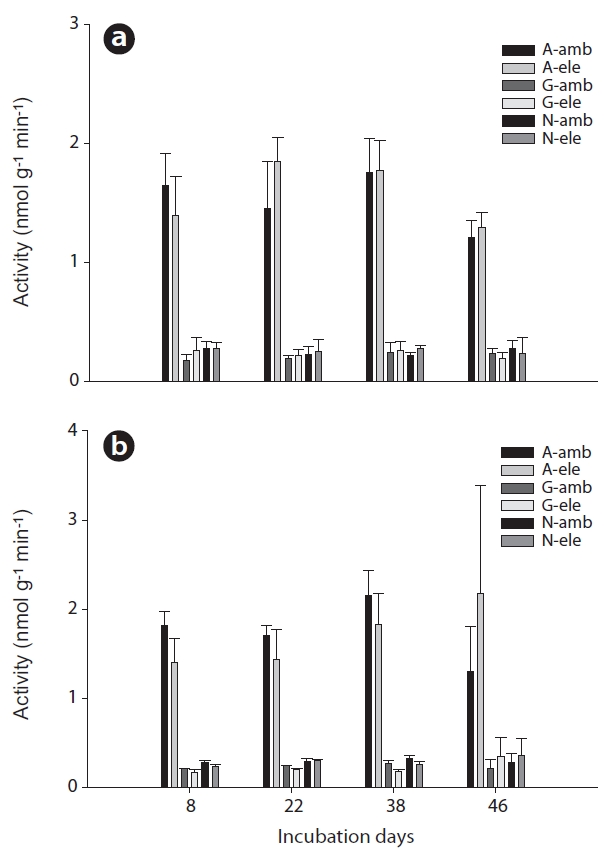
No effects of CO2 on extracellular enzyme activities were noted in surface soils during the total incubation period (Fig. 1a). However, β-glucosidase activities in rhizome soils differed significantly between the CO2 treatment groups (Mann-Whitney U test,
Aminopeptidase activities in surface soil evidenced no consistent pattern associated with CO2 treatment, whereas in the rhizome soil, aminopeptidase activities were higher at a CO2 concentration of 380 ppm than at a CO2 concentration of 760 ppm, although this effect was not significant and was also only observed until day 38 of incubation (Fig. 1a and 1b). As with aminopeptidase, no specific pattern of β-glucosidase activities was noted in the surface soil, but significantly lower activities were noted in the rhizome soil at a CO2 concentration of 760 ppm relative to the 380 ppm concentration (Mann-Whitney U test,
>
The ratio of enzyme activities
The ratio of aminopeptidase activity to β-glucosidase activity was reported to be 7.17 and 7.24 on average at 380 ppm CO2 and 760 ppm CO2, respectively. In rhizome soil, the ratios were (on average) 7.14 at 380 ppm CO2 and 7.74 at 760 ppm CO2 (Table 4). The ratio of aminopeptidase activity to N-acetylglucosaminidase activity in surface soil was measured at (on average) 6.39 at 380 ppm CO2 and 8.33 at 760 ppm CO2. In the rhizome soil, the ratios were (average) 5.87 at 380 ppm CO2 and 5.86 at 760 ppm CO2 (Table 4). The ratio of β-glucosidase activity to N-acetylglucosaminidase activity was 0.92 and 1.09 (on average) at 380 ppm CO2 and 760 ppm CO2, respectively. In rhizome soil, the ratios were 0.82 and 0.77 at 380 ppm CO2 and 760 ppm CO2, respectively (Table 4).
[Table 4.] Descriptive statistics of enzyme ratios
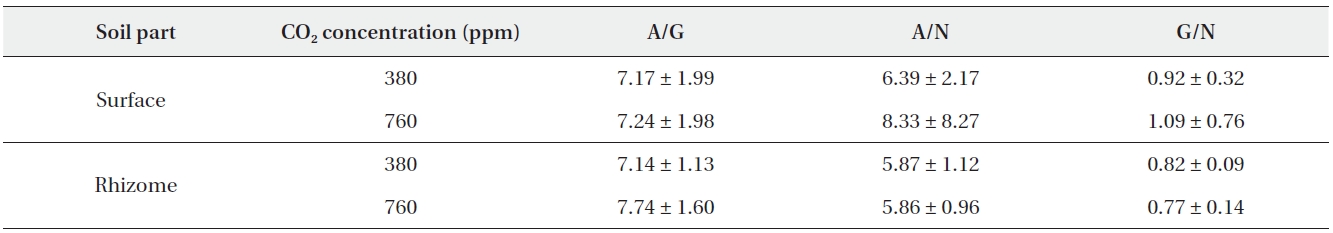
Descriptive statistics of enzyme ratios
No differences in the ratios of extracellular enzyme activities were noted between the surface and rhizome soils at 380 ppm CO2. At 760 ppm CO2, however, only the ratio of β-glucosidase activity to N-acetylglucosaminidase activity differed significantly between the surface and rhizome soils (Mann-Whitney U test,
>
Community structure of sulfate-reducing bacteria
Amplification of the
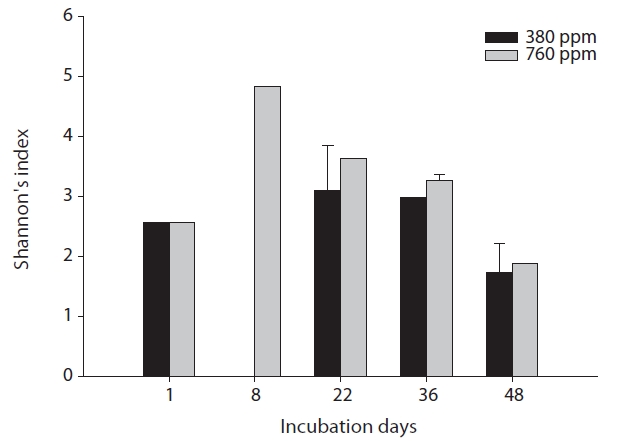
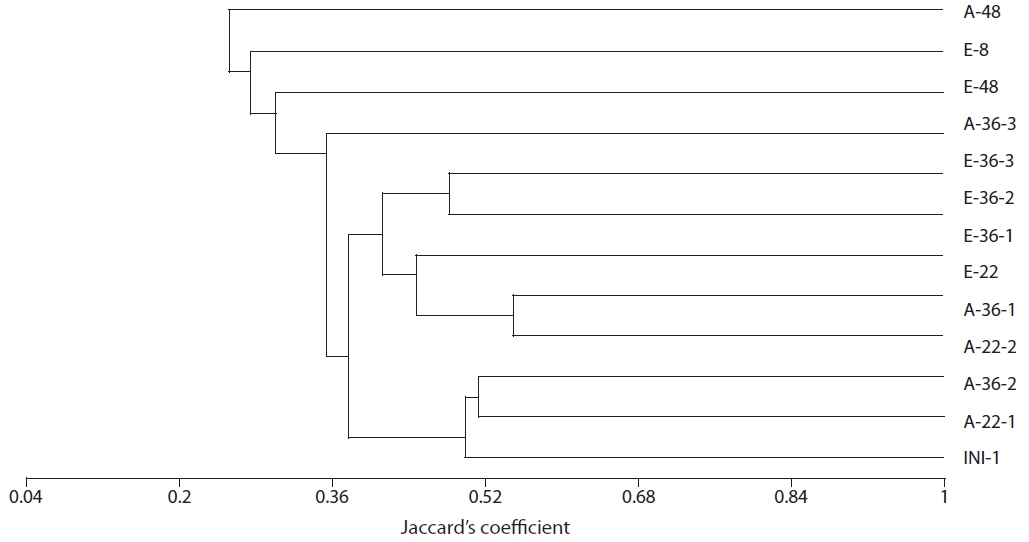
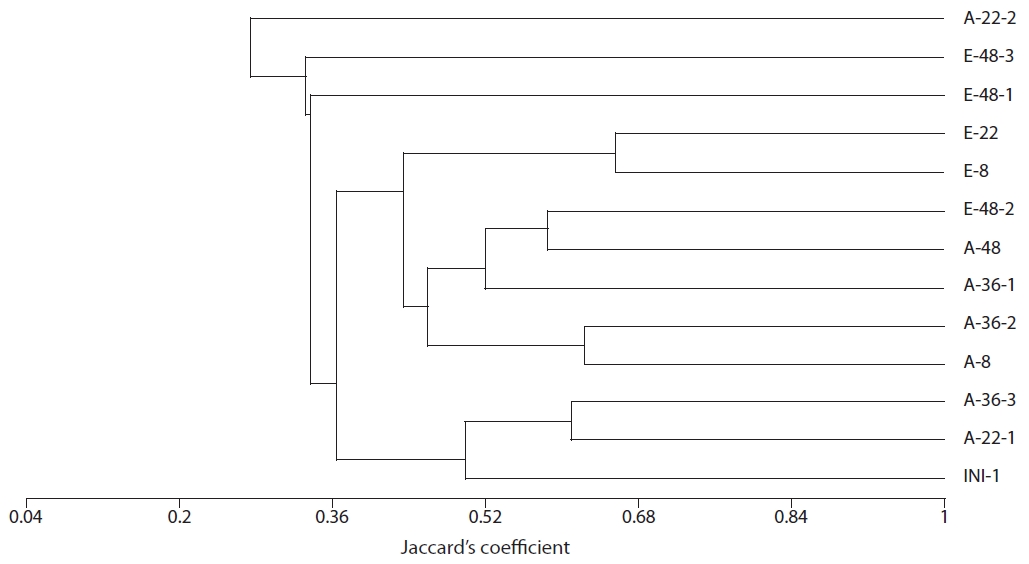
The results of our similarity analysis of sulfate-reducing bacteria showed the effects of atmospheric CO2 concentration on the community structure of sulfate-reducing bacteria more apparently than the diversity index analysis. Both in surface and rhizome soils, the separation of community structure was observed at 380 ppm CO2 and at 760 ppm CO2. Additionally, as incubation continued, the community structure of sulfate-reducing bacteria was increasingly altered (Figs. 4 and 5). It was noted that the patterns of these changes in the community structure of sulfate-reducing bacteria appeared to differ according to the position in the soil from which samples were acquired. In other words, as incubation continued, the separation in the community structure of sulfate-reducing bacteria in surface soil by atmospheric CO2 concentration appeared to be weaker than that in the rhizome soil.
Generally, more labile carbon accumulated in the rhizosphere than in bulk soil, because the products of photosynthesis are partially transported to the rhizosphere (Domanski et al. 2001). Many previous studies have shown that elevated atmospheric CO2 increased labile carbon in the rhizosphere, through which products of stimulated photosynthesis are transported under elevated CO2 levels (Cheng and Johnson 1998), even though this differed according to plant type (C3 or C4) ( Paterson et al. 1996). C3 plant growth and root biomass were enhanced under elevated CO2 concentration conditions, whereas C4 plant growth evidenced declining patterns or no effects (Curtis et al. 1990, Arp et al. 1993, Gray and Mogg 2001). Elevated CO2 also affects the quantity of labile carbon in pore water in wetland soils. Elevated atmospheric CO2 has been shown to induce an increase in dissolved organic carbon (DOC) in wetland soils by increasing root exudates (Freeman et al. 2004) or enhancing the decomposition of soil organic matter (Wolf et al. 2007). According to the study of Keller et al. (2009), DOC in brackish marsh in which C3-sedge predominated was reported to increase under-elevated CO2.
Soil microbial activity can be stimulated by available carbon supply, because soil microorganisms are generally carbon-limited. Higher microbial activities are generally reported in the rhizosphere relative to that detected in other parts of soil (Zak et al. 2000). However, no significant changes in soil enzyme activities by CO2 treatment were detected in surface soil or in rhizome soil. The responses of soil microbial enzyme activities to elevated atmospheric CO2 were generally enhancements (Dhillion et al. 1996, Finzi et al. 2006, Drissner et al. 2007), although the extent of enhancement differed by season (Drissner et al. 2007).
Results from the surface soil were consistent with the results from bulk soil evaluated in previous studies (Zak et al. 2000), while somewhat different patterns were noted in rhizome soil. In rhizome soil, extracellular enzyme activities did not differ by CO2 treatment group; this was attributed to the lack of changes in DOC (data not shown). Increased available carbon in rhizome soil via the enhanced translocation of photosynthetic products was one of the most important factors in increasing microbial activities in rhizome soils (Hungate et al. 2000). However, DOC in rhizome soil did not increase as the result of CO2 treatment in this study, and this would be considered a primary factor in the observed lack of significant changes in extracellular enzyme activities. Nitrogen depletion may be another factor in the lack of significant differences in extracellular enzyme activities by CO2 treatments, as nitrogen is a key factor in regulating the responses of the soil carbon pool to elevated atmospheric CO2 (Hungate et al. 2009). Considering that the pronounced effects of enhanced atmospheric CO2 on soil carbon pool were mainly associated with C3 plants (Long et al. 2004),
Elevated CO2 could also affect alterations in the relative contribution of microbial communities to organic matter decomposition in the rhizosphere. The ratio of β-glucosidase activity to N-acetylglucosaminidase activity in rhizome soil was significantly lower at 760 CO2 ppm than at 380 CO2 ppm, demonstrating that the contribution of fungi to soil organic matter decomposition under elevated CO2 concentrations might prove larger than that of bacteria (Rillig et al. 1998, Treseder and Allen 2000). Previous studies have reported increased fungal biomass and activities in the rhizosphere under elevated CO2 conditions (Rillig et al. 1998), and Chung et al. (2007) previously demonstrated that, even in bulk soil where no plant root effects were detected, fungal activities were increased under elevated atmospheric CO2 conditions. It has also been frequently observed that the increase in specific soil enzyme activities occurs concomitantly with enhanced fungal biomass and abundance. Carney et al. (2007) also corroborated that the proportion of fungi to bacteria rose as the result of elevated CO2 concentrations, which were accompanied by an increase of phenol oxidase activities partly produced by fungi (Hammel 1997). Fungi decompose recalcitrant organic matter more voraciously even than bacteria; therefore, enhanced fungal activity might be expected to affect substantially the carbon cycles in salt marshes, by reducing carbon storage in sediment.
Successful amplification of
Although the physicochemical properties of sediment were not determined to be significantly affected by 2 concentration, the separation of sulfate-reducing bacteria by elevated 2 was detected. This might be explained by changes in the quality of available carbon sources for sulfate-reducing bacteria. In this study, specific ultra violet absorbance (SUVA), an indicator of recalcitrant DOC with aromatic rings, did not differ significantly by 2 treatment group (data not shown). Therefore, elevated atmospheric 2 was not likely to provide carbon sources to hamper microbial activities. Instead, organic acids, such as propionate and lactate, which are major carbon sources in regulating changes in the community structure of sulfate-reducing bacteria (Kleikemper et al. 2002), might be influenced by 2 treatments. DOC is composed of various carbon sources, and is one of the main factors controlling the processes of organic matter decomposition processes, such as sulfate reduction, in marine sediment (Leloup et al. 2005). Organic acid is another important component, and the rates of production and consumption of organic acids were frequently sufficiently different to determine whether the net flux of organic acids is reflective of production or consumption (McMahon and Chapelle 1991). Similarly, organic acids in sediment might be consumed too rapidly to be detected in the changes in DOC evaluated in this study.
Even though sulfate reduction rates were not measured in this study, changes in the community structures of sulfate-reducing bacteria indicated that sulfate reduction might be affected by elevated 2. Keller et al. (2009) demonstrated that sulfate reduction rates in brackish marshes were enhanced by elevated 2. However, in this study, factors that enhanced sulfate reduction rates, such as DOC, were unaffected by 2 treatments. Thus, elevated 2 was not considered likely to enhance sulfate reduction rates in this study.
According to the results observed herein, elevated 2 appeared not to affect the capacity of organic matter decomposition in salt marsh sediment vegetated with
In this study, extracellular enzyme activities in salt marsh sediment were found not to be affected by elevated 2. However, the relative contributions of fungi and bacteria to organic matter decomposition were apparently altered under elevated 2 conditions. Additionally, the community structure of sulfate-reducing bacteria was also altered by elevated 2. Therefore, elevated atmospheric 2 may affect microbial diversity rather than microbial activity; alternatively, the response of microbial diversity to elevated 2 may be more rapid than that of microbial activity.