Soil respiration (RS) is an important component of the annual carbon (C) balance of forests, as RS is the second most important C flux after gross primary production and is the largest respiratory C flux at the ecosystem scale. Interest in the rate-controlling factors of RS is growing because of the potential for climate change to increase the flux of CO2 from ecosystems to the atmosphere (Raich and Potter 1995). Information regarding the relationship between the RS rate and the variables that drive it is also necessary for the development of the models of value for the assessment of climate-change effects and for the interpretation of the processes involved.
The RS rate is characterized by sizeable seasonal fluctuations owing to seasonal changes in root and microbial respiration. Although several biotic and abiotic factors influence root and microbial activity, the control exerted by soil temperature (ST), and in some cases soil water content (SWC), is generally dominant. In the absence of
water stress, variations in RS account for the majority of the seasonal and diurnal variations in RS rates. In areas in which water stress occurs frequently, RS rates may not be correlated with ST, but rather with its SWC (Rout and Gupta 1989).
Microbial communities and plant root systems are particularly sensitive to changes in ST (Killham 1994). Both specific RS rates and microbial and root biomass are affected positively by the evaluated ST, and in the majority of ecosystems a positive correlation between the RS rate and ST is observed (Killham 1994), resulting in sizeable seasonal fluctuations in the flux rates. There is, however, currently no consensus regarding the exact form of the relationships (Lloyd and Taylor, 1994). The RS rate has been modeled using linear (Witkamp 1966, Anderson 1973), power (Kucera and Kirkham 1971), and sigmoid (Schlentner and van Cleve 1985, Janssens et al. 1999, Matteucci et al. 2000) relationships with ST. Exponential relationships, most especially the Q10 relationship, are more frequently utilized to predict the RS rates from ST (Raich and Potter 1995, Boone et al. 1998, Davidson et al. 1998).
However, ST is frequently correlated poorly with the RS rate, and SWC may be the best predictor of RS rates (Rout and Gupta 1989, Holt et al. 1990, Keith et al. 1997). SWC may negatively affect RS rates when it becomes either very high (poor aeration and reduced CO2 diffusivity) or very low (desiccation stress) (Janssens et al. 2003). Even in ecosystems characterized by abundant rainfall, the RS rate generally peaks in spring and after rainfall events (Matteucci et al. 2000, Lee et al. 2002). Field observations have shown a more variable relationship between the SWC and RS rates. The response of the RS rate to SWC has been successfully described using linear (Rout and Gupta 1989, Holt et al. 1990), exponential (Keith et al. 1997, Davidson et al. 1998), and polynomial functions (Bunnell et al. 1977, Schlentner and van Cleve 1985, Carlyle and Than 1988). However, Pinol et al. (1995) found SWC to be significant at one of their sites. Davidson et al. (1998) also suggested that SWC and ST controlled RS as independent or confounded factors in a temperate mixed hardwood forest. Thus, these empirical models are site-specific, and only a few attempts have been made thus far to apply them to other locations.
Moreover, Hanson et al. (1993) and Janssens et al. (2003) determined, when including a moisture response function, that the empirical model fit the data better and more parsimoniously explained the temporal variability. However, only a relatively few studies have thus far evaluated empirical regression models, including SWC, in RS. The principal objectives of this study were to evaluate the relationship between RS rates versus ST and SWC using hourly and daily data collected for 1999 and 2001 in a cool-temperate deciduous broad-leaved forest, and to determine the empirical regression models for the prediction of RS.
The study site is located on the northeast slope of Mt. Norikura, Gifu Prefecture, in central Japan (36°08’ N, 137°26’ E, 1,430 m asl). The area is classified as cool-temperate and is located in a transitional zone between the Pacific side and the Japan Sea side of Japan. From 1980 to 2002, the annual mean air temperature was 6.1°C and the annual mean precipitation was 2,275 mm (Takayama Experimental Station, Gifu University; 1,342 m asl). The total rainfall varied from year to year, with a rainy season in June and a typhoon season in September. The site is covered with snow from December to April. The annual mean snowfall is approximately 600 cm, and the maximum snow depth is 100 to 180 cm (data from Takayama Research Station).
Approximately 50-year-old secondary, deciduous broad-leaved forest composed mainly of Quercus crispula Blume and Betula ermanii Cham. grow at the site. In areas with brown forest soils (Dystric Cambisols) (Food and Agriculture Organization 1999), the forest floor vegetation consisted of Sasa senanensis Rehd., a bamboo. The trees produce leaf buds at the beginning of June, and the leaves begin to senesce in early October. The leaf area index of the forest is approximately 3.5 between the end of June and the end of September (Yamamoto et al. 1999).
The study site has also been one of the long-term flux monitoring sites in the AsiaFlux network established in 1993, with the cooperation of the National Institute of Advanced Industrial Science and Technology and Gifu University. The site description in this study has been previously detailed by Lee et al. (2006).
The soil CO2 flux was measured at four points in the study site from September 1999 to September 2001. The soil respiration rate was determined via an open dynamic chamber technique similar to that described by Lee et al. (2002). During the spring growing season and the summer, measurements were taken every 2 weeks. During
the autumn, measurements were made once per month, with just a few accidental interruptions (e.g. the electricity failed during a rainstorm). The open-flow IRGA method was utilized for the flux measurements. Ambient air (50 cm from the soil surface) was passed through the chambers at a rate of 0.5 L/min. The carbon dioxide concentrations of the air being pumped into and withdrawn from each chamber in turn (N = 4) were measured via IRGA. One measurement cycle of 25 minutes was repeated for 24?48 hours. Methods for the soil respiration measurements have been detailed by Lee et al. (2002). The measuring system setup was comprised of one reference line and four identical sample lines, an IRGA in absolute mode (Li-6252; Li-Cor Biosciences, Inc., Lincoln, NE, USA) and a data logger (Model NR250; Keyence, Tokyo, Japan). The reference and sample lines were pneumatically independent of one another. In this system, the ambient air entered the chambers at a flow rate of 1.2-1.6 L/min during the summer, and 0.8 L/min during the winter. One measurement cycle of 25 minutes was repeated for 24-48 hours. During the CO2 analysis, air flow to the IRGA was maintained at a rate 0.5 L/min lower than the chamber flow-through rate, and water vapor was removed prior to analysis with a perma-pure drier (MP-110?72P, ZBJ02502?72P; Fuji Electric Co, Ltd., Tokyo, Japan). The data logger recorded the electric output from the IRGA. Four chambers were placed 4-5 m apart. Each chamber consisted of two parts. The lower body, which featured two ports for the inlet and outlet of air, was a 15-cm-high PVC cylinder with an internal diameter of 21 cm. When the bottom edge of the cylinder was pushed 4 cm into the soil, the bottom circumscribed an area of 346 cm2. The upper part, a 2.5-cm-high PVC lid, was placed on the top of the body immediately prior to the commencement of the measurements. Surface litter was contained within the chambers. However, great care was taken to avoid live or standing dead vegetation.
ST was measured in each chamber during the flux measurement at 5-10 cm below the top of the forest litter layer, which was approximately 4-8 cm below the surface of the mineral soil, depending on local variations in the thickness of the litter layer. Continuous ST measurements were conducted at two points near the flux measuring points at 30 minutes intervals (1, 10, 20, and 50 cm below the top of the litter layer) using copper-constantan thermocouples over the entirety of the study period. SWC was measured every 30 minutes by time-domain reflectometry (Model CS612; Campbell Scientific Inc., Logan, UT, USA). Two 15-cm long rod-balanced probes were placed horizontally at soil depths of 15 and 40 cm below the top of the litter layer, as described by Davidson et al. (1998).
It is likely that ST and/or SWC in the surface soil layers fluctuates more widely than in deeper soil layers. In a previous study conducted at in our site, Mo et al. (2005) reported that the temperature of the upper soil may better predict daily soil carbon efflux than the temperature of the deeper soil, as the upper 20 cm of the soil could contribute greatly to the RS rate, owing to the fact that it contained more than 90% of the roots (Lee et al. 2003) and a greater proportion of the microbial biomass (Mishima 2002). In the present study, therefore, ST at 10 cm depth and SWC at 15 cm depth were used to derive the empirical regression models of the RS rates.
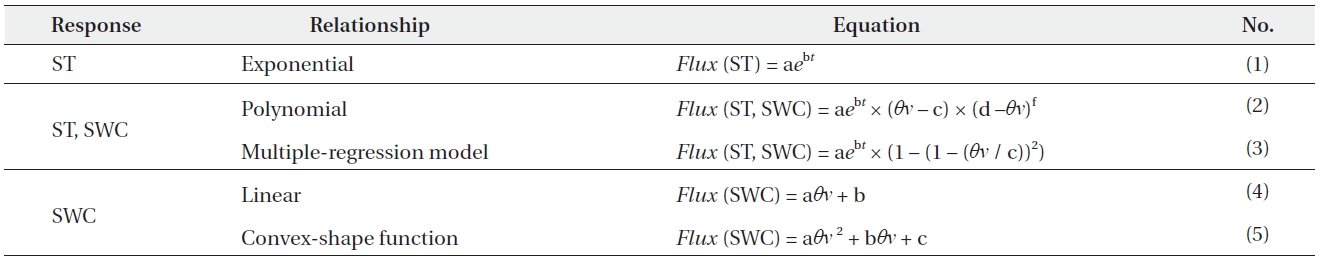
Table 1 shows the list of ST and SWC response functions of the RS rate that have been applied in the empirical models. In order to evaluate the ST response function, we fitted an exponential relationship (Eq. [1]) using the data of hourly and daily mean RS rates. To evaluate the SWC dependence, we selected the two SWC response functions, linear (Eq. [4]) and convex-shape relationships (Eq. [5]). To evaluate the empirical regression models used to predict RS, we conducted comparisons with a simple exponential regression (Eq. [1]) and two polynomial multiple-regression models (Eq. [2] and [3]) that included two variables (ST and SWC) that utilized hourly

List of temperature and moisture response functions of soil respiration rate that have been applied in empirical models
data for RS. Regressions using ST are denoted by t, and SWC is denoted by θν.
The significance for all statistical analysis was accepted at P = 0.05. All statistical analyses were conducted using StatView ver. 5.0 (SAS Institute Inc., Cary, NC, USA).
>
Observed RS rates during 1999-2001
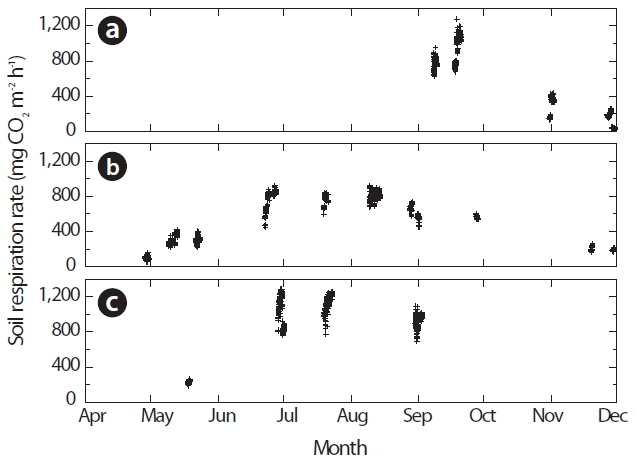
From September 1999 through September 2001, the RS rates increased from May to August and then decreased during autumn (Fig. 1). In 1999, the RS rate was 600-900 mg CO2 m?2 h?1 in early September, peaked at 700-1,300 mg CO2 m?2 h?1 in late September, and decreased to 30-300 mg CO2 m?2 h?1 in November (Fig. 1a). In 2000, the RS rate was 20-200 mg CO2 m?2 h?1 in late April, increased to 200-400 mg CO2 m?2 h?1 in May, peaked at 400-900 mg CO2 m?2 h?1in June and August, and decreased to 200 mg CO2 m?2 h?1 in November (Fig. 1b). In 2001, the RS rate was 180-230 mg CO2 m?2 h?1 in May, peaked at 700-1,300 mg CO2 m?2 h?1 in June, and decreased to 700-1,100 mg CO2 m?2 h?1 in September (Fig. 1c). The RS rates tended to be lower in 2000 than other years, possibly because of the slightly lower soil temperatures in 2000 (Lee et al. 2003).
In the Japanese cedar (Cryptomeria japonica D. Don) forest in our study watershed, Lee et al. (2008) reported that the temporal variation in RS from soil and snow surfaces was measured continuously with an open dynamic chamber system. They investigated that the mean values of RS rate obtained by all six chambers ranged between 255 and 1,529 mg CO2 m?2 h?1, with lower values in mid-May and at the end of November and higher values between the beginning of July and the middle of October. In a previous study conducted at our site, Mo et al. (2005) also reported that the daily average RS rate was 245 mg CO2 m?2 h?1 in late April, increased to 455 mg CO2 m?2 h?1 in mid May, peaked at 642 mg CO2 m?2 h?1in late August, and decreased to 232 mg CO2 m?2 h?1 in November. Therefore, our values were comparable to the values reported by Mo et al. (2005) and Lee et al. (2008).
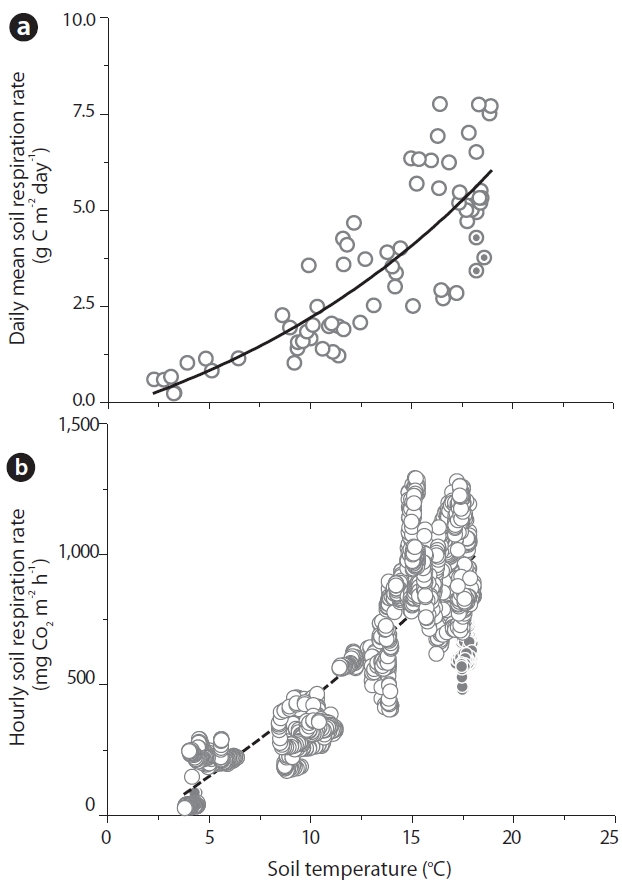
A temperature function used for the prediction of RS was derived on the basis of 3 years of the Takayama Forest study. According to the daily mean data, Fig. 2a shows the relationship between the RS rates (g C m?2 day?1) and ST was expressed as follows:

This regression accounted for 69% of the variation in the respiration measurements, primarily representing the seasonal changes in RS at this site (N = 66). According to the hourly data, Fig. 2b shows the relationship between
the RS rates (mg CO2 m?2 h?1) and ST was expressed as follows:

Fig. 2b shows that the relationship between RS rates and ST on hourly data was also highly significant (R2 = 0.71, N = 2,050). These results demonstrated that ST was the primary factor driving temporal variations in RS.
In general, the daily mean RS rates were positively well correlated with ST, but no significant correlations were noted to exist between the ST and RS rates on the periods of a day based on the hourly RS data. In our study site, no significant correlations were noted between the ST and hourly RS rates recorded on a rainy day (Lee et al. 2002). They indicated that post-rainfall increases in the RS rate represent approximately 16-21% of the annual soil carbon flux.
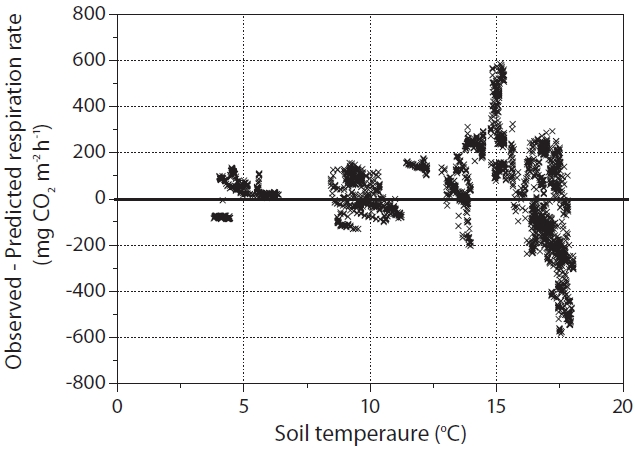
Fig. 3 shows that at ST > 15°C, there was considerable scatter in residuals both above and below the predicted RS line for the function of ST (using the Flux hourly (ST) equation). It appears likely that values above and below the predicted RS line affected the SWC and/or rainfall conditions. Generally, it is fairly clear that ST was the main factor when ST < 15ºC (Figs. 1 and 3). It has been reported that when the ST was not limited, the SWC affects RS. Murayama et al. (2003) also reported that the variation in ecosystem respiration was relatively great when ST > 15ºC; this was attributed to SWC and rainfall events occurring at our study site. They suggested that a single exponential or Q10 functional relationship of biological respiration to ST does not appear to be an adequate representation of biological respiration processes over the entire growing season, at least those occurring at this study site. Lloyd and Taylor (1994) also reported that the assumption of an exponential Q10 relation between RS and ST is invalid and systematically results in underestimated fluxes at low temperatures, and overestimated fluxes at high temperatures.
Long-term continuous monitoring of RS rates in situ is also urgently necessary to clarify the major sources of uncertainty in our ecosystem carbon balance. Opens and closes were automatic, and the measurements are based on an open-flow dynamic method (AOCC), providing continuous and semicontinuous measurements for investigating the temporal variations in RS (e.g., Suh et al. 2006, Lee et al. 2008). The major advantages of continuous chamber systems are the availability of a series of data gathered over a long period of time, and measurements conducted under relatively undisturbed condi
Differences (observed ? predicted RS) in hourly soil CO2 efflux (RS). At soil temperature (ST) > 15°C, considerable scatter in residuals both above and below the predicted RS line for the function of ST (using the Flux hourly (ST) equation)
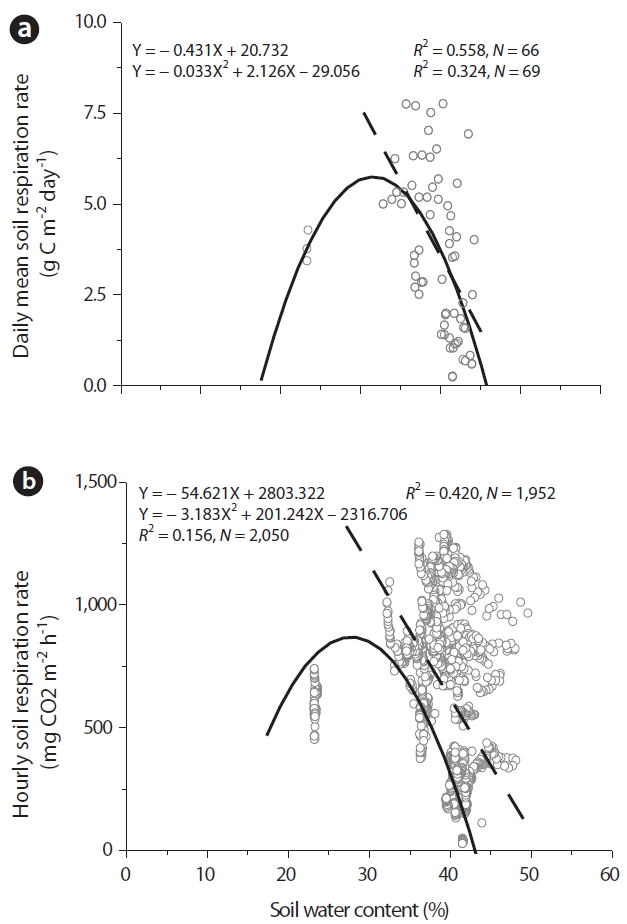
We evaluated the relationships between soil respiration and SWC. In this investigation, when SWC ranged between 30 and 50% (without drought stress), we applied a linear function (Eq. [4]). When SWC ranged between 20 and 50% (with drought stress), we applied a convex-shape function (Eq. [5]).
SWC evidenced significantly negative correlations to the daily mean and hourly RS without drought stress. A SWC linear function accounted for approximately 56% of the RS rate on the daily mean data (P < 0.001, N = 66). With regard to the hourly data, we noted a significant linear relationship (R2= 0.42, P < 0.0001, N = 1,952) with SWC. A convex-shaped function with optimal SWC on all data (with drought stress) explained approximately 32% of the daily mean data (P < 0.001, N = 69) and 16% of the hourly data (P < 0.001, N = 2,050). The relationship between SWC and RS was described using a linear function, rather than a second-order polynomial function for water stress conditions (Fig. 4).
RS rates achieved maximum values at SWC levels of approximately positive or convex-type relationships between SWC and RS rates are rarely observed in actual field conditions, except during short-term drought or saturation conditions(Davidson et al. 1998, 2000) or hot-dry summer climate conditions (Xu and Qi 2001). A second-order polynomial function with optimal SWC explained an additional 16 to 32 % of the temporal variability in RS that could not be accounted for by ST alone. Our results indicated that SWC generates considerable scatter in residuals both above and below the predicted RS line for the function of ST. Kang et al. (2003) indicated that spatial variability in RS is better explained with SWC than ST. Moderate drought may also partially explain the inter-annual variability in the RS rate (Epron et al. 1999). Even in forests with less pronounced drought stress, in which drought occurs either infrequently or moderately, the inclusion of moisture regressions in empirical models will increase the degree to which the models fit the data.
To estimate ST × SWC versus the RS model, we used the functions of Eq. (2) and (3) (Table 1). This model showed that the RS rates increased with ST and were suppressed under dry or wet conditions.
Firstly, we utilized a multiple polynomial regression
(Eq. [2]) of our previous study (Lee et al. 2002) using the hourly data recorded on sunny days (without rainfall effect) (Table 1). The data on rainy days and those obtained within 24 hours after the last rainfall were excluded from this calculation, thus eliminating the effects of rainfall on the RS.
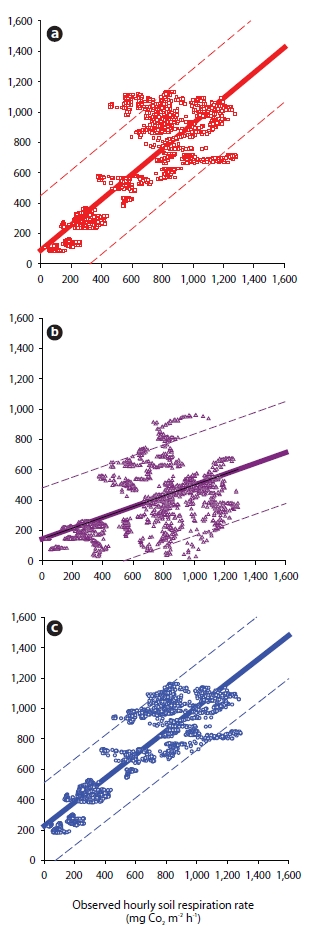
The model explained approximately 96% of the variance in the daily soil carbon fluxes calculated from ST and SWC on sunny days during August 1999 to November 2000 (Lee et al. 2002). However, no significant relationship was detected between the observed and predicted RS rates using all datasets. In order to validate the regression model, we used all of the data collected between September 1999 and September 2001. There was considerable scatter in residuals both above and below the predicted RS line of the ST × SWC model (Y = 0.35X + 145, R2 = 0.34) (Fig. 5b).
Second, we applied the other multiple polynomial function (with rainfall effect, period April-November 2000 and May-November 2001) (Lee et al. 2005) using the hourly all-dataset according to equation (3) (Table 1).

The ST × SWC model derived for the Eq. (3) function was also a good predictor (Y = 0.78X + 228, R2 = 0.78), although not as good as a model derived specifically for the function Eq. (2) (Fig. 5c). The addition of a SWC function to the temperature-only model significantly increased the predictive power (Y = 0.83X + 89, R2 = 0.71 for Eq. (1), Fig. 5a) (R2 = 0.78 for Eq. (3), Fig. 5c).
Similarly, Savage and Davidson (2001) demonstrated that an empirical model utilizing both ST and SWC had good explanatory power in the Harvard forest (R2 = 0.64 for temperature-only model and R2 = 0.70 for ST × SWC). Hanson et al. (1993) also demonstrated that the inclusion of SWC increased the predictive power of their model at four of their five sampling sites (R2 from 0.49-0.60 increased to 0.67-0.73).
In the current study, Eq. (3) was best explained by temporal variations, as it provided a more unbiased fit to the data as compared to Eq. (2). The relatively modest increases in R2 values when the SWC functions are added to the temperature-only regression models. The Eq. (2) has many more site-specific parameters than Eq. (3) and was significantly underestimated. The shape of the moisture response curve and the moisture content at which maximum respiration occurs depends on an array of site-specific factors such as soil texture and structure, amount and type of organic matter, and ST (Howard and Howard 1993).
Our values of the coefficients of a and b in Eq. (1) were 59.472 (mg CO2 m?2 h?1) and 0.163. In the Japanese cedar forest, however, the values were 360 (mg CO2 m?2 h?1) and 0.058 (Lee et al. 2008). Similarly, the parametrization of temperature functions is likely to be site-specific and to be confounded by other effects, such as interactions with water content. Temperature functions predicted seasonal variation in RS fairly well, but variations in precipitation and SWC were identified as the key to understanding inter-annual variations. We will need to analyze the data of two consecutive wet years to determine whether or not high respiration rates persist during both years or if the high respiration rates only occur during the first wet year after a dry year. Our on-going measurements may also afford us other opportunities to investigate a broad range of interannual variability.


![Relationships between soil CO2 efflux (RS) and soil water content in daily-based data (a) and hourly-based data (b). The solid line represents the regression curve constructed from the whole dataset (with drought stress). The dashed line represents the linear function (without drought stress). The list of regressions (Eq. [4] and [5]) that were fitted to the data from daily means and hourly soil respiration rates and the obtained parameter values. Regressions are listed in Table 1.](http://oak.go.kr/repository/journal/10287/STHHCL_2010_v33n2_165_f004.jpg)
![Relationship between the observed soil CO2 efflux (RS) and predicted soil CO2 efflux (RS) hourly data in temperature dependent on the exponential function (Eq. [1], a) and two polynomial multiple-regression models (Eq. [2], b and Eq. [3], c). The solid and dash lines represent the linear function and confidence limit (95%).](http://oak.go.kr/repository/journal/10287/STHHCL_2010_v33n2_165_f005.jpg)