Global positioning system (GPS) is used to precisely decide the user position and time information. Delay and refraction take place as the GPS signal passes through the ionosphere and troposphere before it reaches the user. Analysis of the causes of such errors allows inverse estimation of the total electron contents in the ionosphere and the amount of water vapor in the troposphere. For this reason, GPS is widely used in not only positioning but also various applications such as study of ionosphere and troposphere. Particularly, the meteorological study of the troposphere has been continuously carried out since 1990s using the GPS signal delay error (Bevis et al. 1992, Moon et al. 1999). In Korea also, the GPS-derived precipitable water vapor (PWV) has been studied and applied to various meteorological cases including typhoon (Song et al. 2003), local severe rain storm (Lee et al. 2007) and fog (Lee et al. 2008).
On the other hand, GPS is applied to not only shortterm meterological phenomena but also climate research using long-term data. Since the GPS full operation capability was officially declared by the United States Air Force Space Command (AFSPC) in 1995, some of the GPS stations have restored the observation data over more than 15 years and the PWV derived from such GPS data are used for the study of climate change. Jin et al. (2007) analyzed the zenith tropospheric delay data from 150 international GPS stations from 1994 and 2006 and showed the relative trend in the northern hemisphere and the southern hemisphere and in the coastal areas and the interior areas. Wang & Zhang (2009) derived GPS PWV at about 400 sites in the world over the period of 1997 and 2006, dividing the data into the entire world, the northern hemisphere and the southern hemisphere and analyzing PWV diurnal variations. Nilsson & Elgered (2008) showed that PWV changed from -0.2 mm to +1.0 mm in 10 years by using the data from 33 GPS stations located in Finland and Sweden.
Since the long-term trend analysis of the GPS-derived PWV has been usually carried out in the global scale, local studies are not sufficient yet. In Korea, no long-term GPS PWV change analysis has been conducted, but more than 10 years of GPS data are available since the GPS observation started in the late 1990s. These long-term observation data can be used as the research data for the analysis of the recent water vapor change trend over the Korean Peninsula by the climate change.
In this study, we analyzed the PWV change trend in last ten years using the data from the domestic regular GPS stations in Seoul, Daejeon, Mokpo, Milyang and Sokcho operated by Korea Astronomy and Space Science Institute (KASI). This article consists of following chapters: Chapter 2 briefly describes the procedure to derive the atmospheric PWV from the GPS signals. Chapter 3 summarizes the comparative analysis of the GPS-derived PWV in three sections. Firstly, in Section 3.1, the PWV data derived from GPS were compared with the PWV data observed with a radiosonde to examine the credibility. To verify the overall tendency, we used the GPS PWV at the Daejeon Station derived from the tropospheric products of the International GNSS Service (IGS) in the National Center for Atmospheric Research (NCAR) Earth Observing Laboratory (EOL) and the PWV over the five stations observed with the Atmospheric InfraRed Sounder (AIRS) loaded on Aqua, the remote-sensing satellite of U.S. National Aeronautics and Space Administration (NASA). Section 3.2 presents the analysis of the entire trend over the 10 years and the seasonal trend of the GPS-derived PWV. The data derived from each station was used for the trend analysis over the entire period, whereas the average of the PWV from the five stations was used for the seasonal trend analysis. In Section 3.3, the GPS PWV was compared with temperature which is one of the major meteorological elements and the trends and correlation were examined. Lastly, Section 4 presents the final conclusionsof this study.
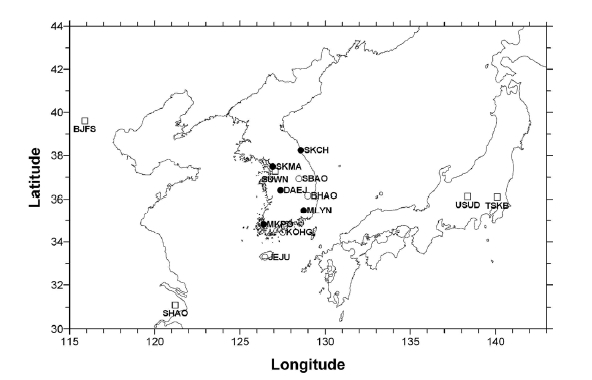
We used the data from the five regular GPS stations (Seoul, Daejeon, Mokpo, Milyang, and Sokcho)1 of KASI over the period of January, 2000 to December, 2009. These observation stations are where the meteorological data that are necessary for the GPS PWV derivation are observed in close proximity. For the continuity of the meterological data, we used the weather stations data. The GPS data from the IGS observation stations located in and around the Korean Peninsula such as Suwon, Beijing, Shanghai, Usuda and Tsukuba observation stations were also used in order to define the double difference reference coordinate system for the improvement of the accuracy (Fig. 1).
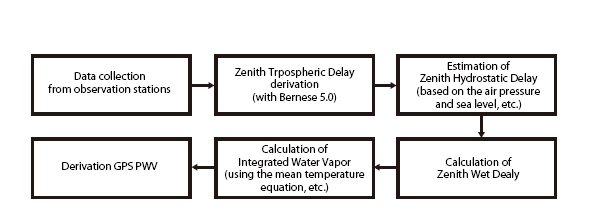
Fig. 2 is the schematic diagram of the procedure to derive the GPS PWV from the collected data. To derive the zenith tropospheric delay (ZTD) of each observation station, the software Bernese 5.0 developed by University of Bern, Switzerland, was employed (Dach et al. 2007). Bernese is regarded as one of the three top high-accuracy
data processing softwares with GIPSY-OASIS developed by the Jet Propulsion Laboratory, NASA, U.S. and GAMIT developed by Massachusetts Institute of Technology (MIT). This software is used not only in the major IGS analysis centers but also in more than 500 institutes in the world. Based on the difference between the derived ZTD and the zenith hydrostatic delay (ZHD) estimated by the modeling equations, the zenith wet delay (ZWD) was calculated (Elgered et al. 1991). The ZWD was expressed as the integrated water vapor (IWV) by using the mean temperature equation, etc. (Bevis et al. 1992). The mean temperature equation has different models depending on the areas where the meteorological observation was carried out and thus it can be a cause of error when it is improperly applied to an area where the climate conditions are different. Hence, models that are appropriate to each area are developed and applied. In this study, we applied Korean mean temperature equation, Tm ? 0.907 Ts + 16.5 (Ha et al. 2006), which was developed recently using the long-term domestic meteorological observation data and the radiosonde data. Here, Tm is the mean temperature, Ts is the local air temperature at the observation station, and the unit is the absolute temperature K. Finally, the GPS PWV was calculated by dividing the IWV by the density of water. Here, the unit of GPS PWV is mm, the IWV is kg/m2 and the density of water is approximately 1,000 kg/m3.
In general, the GPS PWV is more dependent on the atmospheric pressure difference than the air temperature difference. According to Jones (2008), the IWV was changed by about 0.8 kg/m2 as the air temperature changed by 10℃, while it was changed by about 3.6 kg/m2 as the atmospheric pressure change by 10 hPa. Correction of the atmospheric pressure is needed between the GPS receiver and the meteorological observation instrument that are at different positions. In particular, correction of the atmospheric pressure is necessary for the Daejeon Observation station since there is the spatial difference with the meteorological observation station by about 3 km horizontally and about 30 m vertically. The following equation was used to correct the atmospheric pressure as that of the GPS receiver level (Ninomiya 2003).
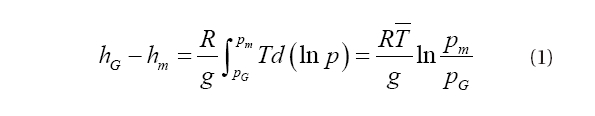
Here,
1)Locations of the regular GPS stations of KASI Seoul: in the Korea Meteorological Administration (KMA), MeteorologicaAdministration street, Dongjak-gu, Seoul Daejeon: in KASI, Daedeok Avenue, Yuseong-gu, Daejeon Mokpo: in the Mokpo Branch Office of KMA, Yeonsan-dong, Mokpo-si, Jeonnam Milyang: in the Mokpo Branch Office of KMA, Naei-dong, Milyang-si, Gyeongnam Sokcho: in the Sokcho Branch Office of KMA, Toseong-myeon, Goseong-gun, Gangwon
While the GPS PWV was derived for every one hour, four-hour interval samples were taken to perform the 10 years of trend analysis. Among the derived results, the data that were not appropriate to the trend analysis because of the abnormality in the meteorological data, GPS antenna, receiver or communication network were excluded.
3.1 Comparative verification of the GPS PWV
3.1.1 Comparative verification with the radiosonde data
For the credibility verification of the derived GPS PWV, the results from the Sokcho Observation Station where the GPS and radiosonde observation were carried out at the same site were compared and analyzed. Baek et al. (2007) showed that the correlation coefficient of the GPS-derived PWV and the radiosonde measurements was 0.98. Since the 166th day (June 15) of 2001, the upper air observation has been carried out at the Sokcho Weather Station twice a day (00 and 12 UTC). The open data of the Department of Atmospheric Science (http://weather.uwyo.edu/upperair/sounding.html) in University of Wyoming, U.S. were used as the radiosonde PWV measurement data. The data from the initiation of the observation to December 2009 were compared and verified.
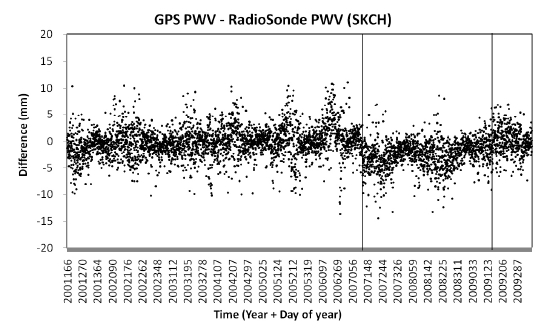
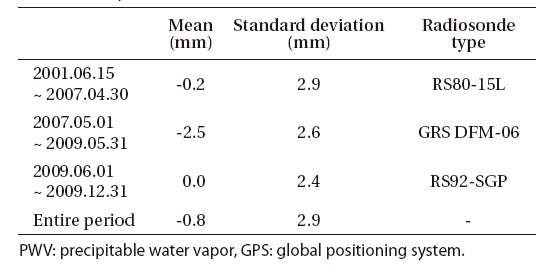
Fig. 3 shows the difference between the GPS PWV and the radiosonde observation values. The average difference between the measurements of the two instruments over the entire period was -0.8 mm and the standard deviation was 2.9 mm. This indicates that the data satisfied the necessary condition by Gutman & Benjamin (2001) that the error range of the results should be less than 3 mm so as to apply the PWV derived from GPS to the data assimilation. It is found in Fig. 3 that the difference between the two values was greatly biased for two times on the 121th day (May 1) of 2007 and the 152th day (June 1) of 2009 when the radiosonde observation instruments were substituted (KMA 2007, 2009). The average and standard variation of each period are summarized in Table 1. The periodic pattern of the difference between the measurements by the two instruments is found in Fig. 3 and it was usually during the summer seasons. It is presumed that the difference between the measurements by the two instruments becomes greater in summer because of the dry bias of the radiosonde measurements due to the solar heat (Wang et al. 2002, Turner et al. 2003, Wang & Zhang 2008) and the humid atmospheric condition.
3.1.2 Comparative verification of the trend
In order to verify the trend of the derived GPS PWV, it was compared with the PWV derived from other systems. The targets of the comparison were the GPS PWV data derived from NCAR EOL and the PWV data measure with AIRS. In the case of the GPS PWV data of EOL, we used the data for the Daejeon Observation Station among the open data of GPS PWV derived by NCAR EOL based on the tropospheric products from the IGS observation station
[Table 1] Difference between the radiosonde PWV and the GPS PWV and radiosonde type in each period.

Difference between the radiosonde PWV and the GPS PWV and radiosonde type in each period.
station in the world (http://www.eol.ucar.edu/deployment/field-deployments/field-project/gpspw, accessed May 2010). In the case of the AIRS PWV data, we have extracted the PWV data observed in the area between the latitude ±0.1° and longitude ±0.1° according to the coordinates of the five GPS stations from the data observed with AIRS that was loaded on Aqua, the remote-sensing satellite of U.S. NASA (http://mirador.gsfc.nasa.gov, accessed February 2010). Then, we used the extracted data after averaging them. Because the AIRS observation started from the late 2002, the data since 2003 were used for the trend analysis. For lack of space, we provide a reference for the data extraction procedure (Ha et al. 2009).
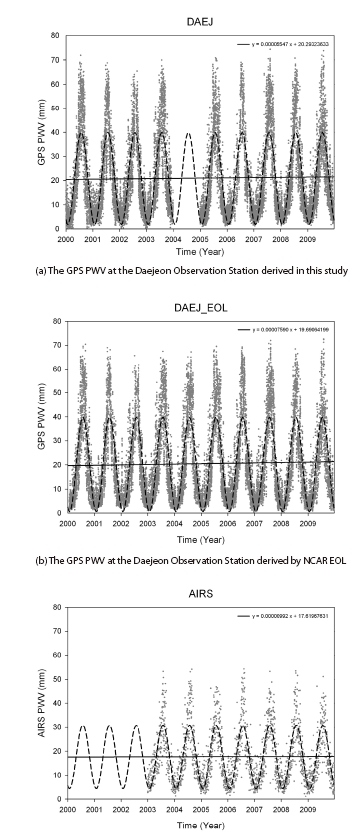
The GPS PWV of the Daejeon Observation Station derived in this study showed the trends that it increased by 0.12 mm each year (Fig. 4a), the EOL results increased by 0.17 mm each year (Fig. 4b), and the mean PWV observed with AIRS at the five stations increased by 0.02 mm in average each year (Fig. 4c). The PWVs over the Korean Peninsula derived from different systems showed the trend that they all increased. In addition, the Daejeon GPS zenith tropospheric delay analyzed by Jin et al. (2007) over the period from 1994 to 2006 also increased every year. The correlation coefficient between the results derived in this study and the EOL results, and that between the results derived in this study and the AIRS were 0.99 and 0.87, respectively.
Fig. 4 shows the respective PWV derived from each system by four-hour interval sampling in time series. The dotted line represents the PWV change depending on time as a sine wave curve fitting, while the solid line is the linear regression of the PWV trend whose equation is presented at the right top. The dotted lines showed constant curves depending on the seasons and they were in a good agreement with most of the observations values. Yet, they were a little bit different during the summer season. It is because only parts of the observation values in summer were larger than those of the models whereas most of the observation values were distributed close to the model values. In the case of EOL, about 85% of the observation values were less than 40 mm, while the observation values higher than 50 mm was less than 10% and those higher than 60 mm were about 2%. The amplitude of the modeling curve of the AIRS observation values (Fig. 4c) was different from the results of other systems (Figs. 4a and b) by about 6.7 mm. It is because the AIRS observation values depend on the observation locations and seasons and the PWV derivation algorithms are different from each other (Raja et al. 2008). Prasad & Singh (2009) reported that GPS results observed in India and the AIRS
results showed the seasonal bias error about 1-4 mm and the root mean square error of 3-8 mm.
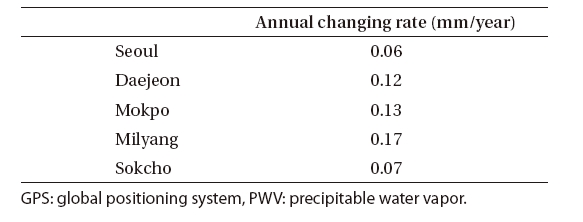
The GPS PWV in the Korean Peninsula distinctively varies depending on the seasons. The periodicity is that it is decreased below 10 mm in winter and it is increased up to about 70 mm (Fig. 4a). The analysis of the periodic change over the ten years showed the trend that the GPS PWV increased by 0.11 mm in average each year. Although the annual changes at the individual observation stations varied from 0.06 mm to 0.17 mm depending on the geographical properties, all of them increased. The annual changes at each observation station are summarized in Table 2.
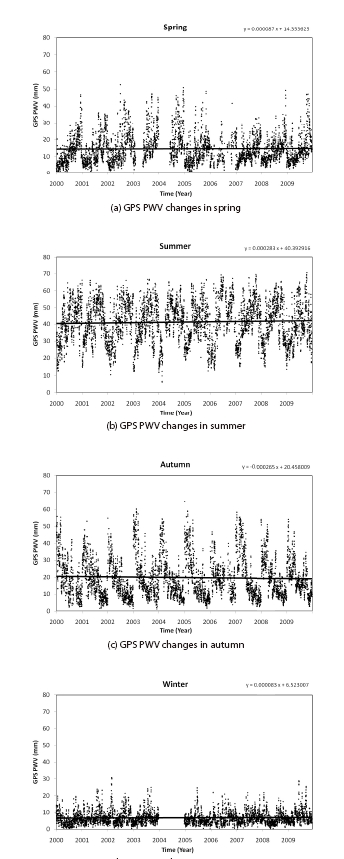
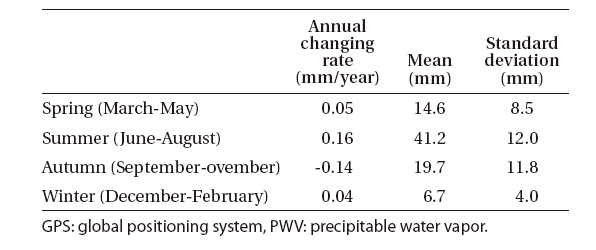
The seasonal trend was analyzed using the mean values of the GPS PWV from the five observation stations and the seasons were distinguished as spring (March to May), summer (June to August), autumn (September to November) and winter (December to February). Fig. 5 is the GPS PWV of each season. The trend over the ten years is presented with a solid line and its linear regression equation is shown at the right top. The GPS PWV increased in spring, summer and winter, whereas it decreased in autumn (Table 3). The annual increment was 0.05 mm/year in spring, 0.04 mm/year in winter and 0.16 mm/year in summer which contributed most to the increasing trend over the entire period. On the contrary, the GPS PWV decreased in autumn by 0.14 mm in average each year, which is assumed to be the result of the largest increase (20.3%) of the precipitation in the autumn of last ten years (1999-2008) when compared with that of the climatological normal (1971-2000) and the reduction of the atmospheric water vapor (NIMR 2009). The ten-year average PWV and the standard deviation were calculated for each season. The average and the standard deviation were 41.2 mm and 12.0 mm, respectively, in summer when the temperature is high, and 6.7 mm and 4.0 mm, respectively, in winter when the temperature is low. This
[Table 2] The annual GPS PWV changing rate in each observation stations.

The annual GPS PWV changing rate in each observation stations.

Seasonal GPS PWV.
is presumably because the quantity of water vapor that can be included in a unit air volume varies depending on the temperature change and the properties of the air-masses that affect the Korean Peninsula in each season.
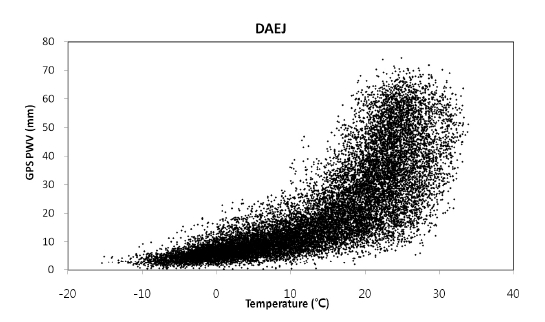
3.3 Relationship between the GPS PWV and air temperature
The atmospheric water vapor is distributed in relationswith various meterological elements. In particular, the water vapor distribution is greatly affected by the air temperature change. In general, when the air temperatureincreases, evaporation is enhanced and the amount of saturated water vapor increases so that the amount of water vapor that can be included in a unit air volume can be also increased.
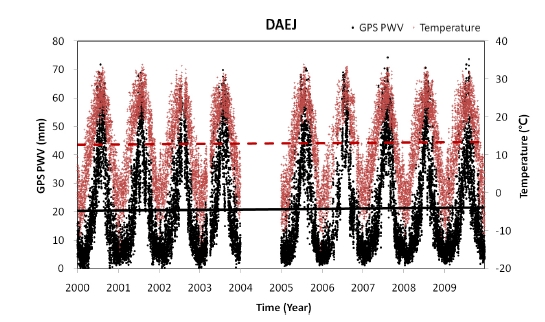
Fig. 6 shows the GPS PWV and the air temperature at the Daejeon Station in time series. The correlation coefficient between them was 0.8. The air temperature at the Daejeon Station showed the trend that it increased by 0.08℃ each year (dotted line) and the GPS PWV increased by 0.12 mm each year (solid line) in the same trend. Fig. 7 shows the correlation distribution between the GPS PWV and air temperature data groups, indicating that the GPS PWV increased as the air temperature increased. However, no direct correlation between the two elements was found. The correlation distribution between the GPS PWV and air temperature was analyzed for summer and winter seasons. The GPS PWV increased by about 1.1 mm as the air temperature increased by 1℃ in summer, while it increased by about 0.5 mm as the air temperature increased by 1℃ in winter, about half of the increase compared with that in summer. It is probably because, different from the Mediterranean climate which is characterized by the hot and dry summer and the warm and rainy winter, the amount of saturated water vapor is increased during the summer in Korean Peninsula which is located at the east of the continent by the hot and humid air-mass that provides a large amount of water vapor and elevates the air temperature, leading to the great change
in the atmospheric PWV. In winter, on the contrary, the amount of the saturated water vapor is decreased by the effect of the dry air-mass and temperature drop, and, consequently, the change in the atmospheric PWV is less.
We analyzed the GPS PWV trend for last 10 years over the Korean Peninsula and verified that it increased by 0.11 mm in average each year. This trend is consistent with the GPS PWV increase trend derived by U.S. NCAR EOL, the PWV increase trend measured with AIRS and the increase trend of the zenith tropospheric delay derived by Jin et al. (2007). The GPS PWV had the seasonal trend that it increased in spring, summer and winter but it decreased in autumn. In particular, the increasing rate in summer (0.16 mm/year) had the greatest effect on the increasing trend over the entire period. In summer when the air temperature is high, the GPS PWV was widely distributed ranging from 10 mm to 70 mm, where as it was concentrated on the level below 10 mm in winter. This is because the amount of water vapor that can be included in the atmosphere depends on the air temperature. In order to verify this, the correlation between the GPS PWV and the air temperature at the Daejeon Observation Station was analyzed and their correlation coefficient was 0.8. In addition, the GPS PWV increase trend depending on time was similar to that of the air temperature increase trend. It was found from the correlated distributions of the air temperature and the GPS PWV that the atmospheric PWV increased as the air temperature increased and the change in the GPS PWV by the air temperature change was greater in summer than in winter. This is because of the properties of the air-masses affecting the Korean Peninsula and the saturated water vapor pressure difference caused by the air temperature change in each season. In particular, the average air temperature in the Korean Peninsula increased by 0.6℃ over last 10 years (1999-2008) when compared with the average air temperature of the previous 30 years (1971-2000) (NIMR 2009). This might have more increased the maximum water vapor that can be included in the atmosphere. It is expected that the utility of GPS PWV as a monitoring tool of the water vapor over the Korean Peninsula can be verified if the GPS PWV derived from long-term data and larger number of observatories is compared and analyzed in depth with air temperature and other climatic elements.