Solar wind-magnetosphere interaction results in variations in the size of the polar cap, which contains open magnetic field lines. Since the size of the polar cap is directly linked to energy stored in the magnetic tail lobe (Kamide et al. 1999), it is an important factor in determining magnetospheric dynamics. Therefore, understanding the manner in which the polar cap size varies in response to solar wind conditions/changes is important.
A number of reports are available in the literature on the effects of the interplanetary magnetic field (IMF) on the polar cap size. For example, Meng et al. (1983) and Meng & Makita (1986) reported that the direction of the IMF Bz is a significant factor for locations of the poleward boundary of the auroral oval; specifically, the polar cap area expands for southward IMF Bz condition. Lee et al. (2010) showed that the IMF By component can also affect the structure of the polar cap.
In this paper, we are interested in determining how the polar cap boundary changes with the impact of the increased solar wind pressure. There is one related previous paper by Boudouridis et al. (2003), who examined a few related events. They suggested that the polar cap size shrinks due to the increased pressure impact, causing the poleward boundary of the auroral oval to move poleward. In our work, we test this suggestion by examining a number of events. We limit our analysis only to the nightside, leaving a similar examination of the dayside for future research. Section 2 describes the data and methodology used in this work. We present two specific events in Section 3, and an overall statistical result in Section 4. Section 5 discusses the results and draws some conclusions.
In this paper, we used the time-shifted ACE data for three years from 2001 to 2003 to identify solar wind pressure increase events. The time shift is obtained from the Weimer mapping technique (Weimer et al. 2003, Weimer 2004). For the study, we have imposed the selection criteria that (i) the dynamic pressure increased by >50% or >3 nPa, and (ii) the increase was maintained for more than 10 minutes. Based on these, we have identified a total of 168 events showing dynamic pressure increase.
For each of the pressure increase events, we defined a one-hour interval before the pressure increase and a 30-minute interval after it. For the defined intervals, we determined locations of the poleward boundary of the auroral oval by using precipitating particle data as obtained by the Defense Meteorological Satellite Program (DMSP) satellites, F12, F13, F14, and F15. The DMSP satellites revolve in polar orbit at an altitude of about 800 km and with a period of about 100 minutes. The poleward boundary of the auroral oval on the nightside is represented by the parameter “b5e”, which is determined by the condition that SSJ/4 detector indicates a precipitating particle energy flux drop of below 3 × 10¹⁰ eV/cm2 s sr (for electrons) or 1010 eV/cm2 s sr (for ions) (Newell et al. 1996). Also, due to the peculiarities of satellite trajectories, the near-complete MLT coverage of the boundary crossing on the nighstide is realized only for the southern hemisphere, but not for the northern hemisphere. The results presented below are therefore only for the southern hemisphere.
In this section we present two specific events to first demonstrate that an enhanced dynamic pressure impact can indeed result in poleward movement of the nightside poleward boundary of the auroral oval.
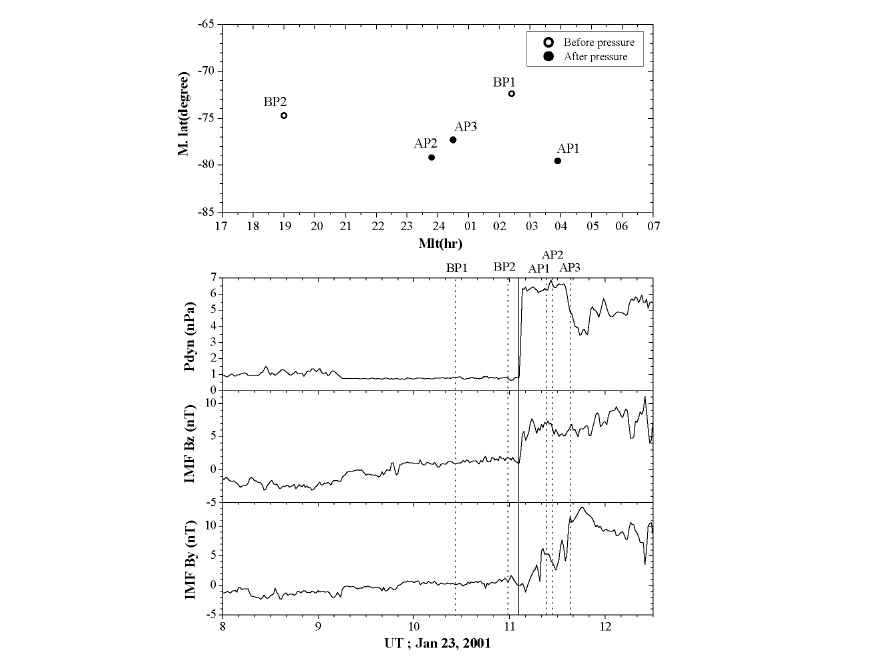
The first example is shown in Fig. 1, where the solar wind pressure front enhanced from ∼<1 nPa to ∼6 nPa, as indicated by the vertical solid line. The accompanied IMF conditions are also shown. The preceding IMF By is practically zero, and the IMF Bz is northward from at least 1 hour prior to the pressure front and afterwards. The top panel is b5e boundary plot, where the two open circles designated as BP1 and BP2 are the values determined at
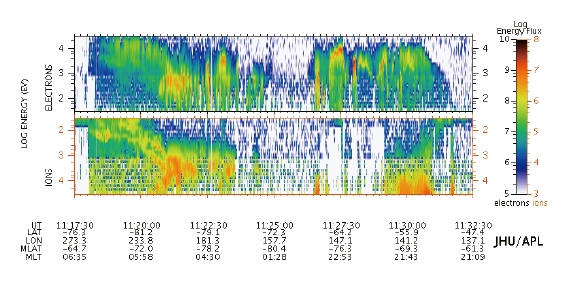
two times before the pressure increase (as marked by the vertical dotted lines in the bottom panels). Likewise, the filled circles as designated as AP1, AP2, and AP3 are those after the pressure increase. Fig. 2 shows the actual particle fluxes (electrons and ions) observed by a DMSP satellite for a limited interval. The relatively low flux region is the polar cap area. It is clearly seen from Fig. 1 that the b5e values are shifted poleward by several degrees after the pressure impact, confirming the suggestion by Boudouridis et al. (2003). We note that the IMF Bz becomes further northward by a few nT at the time of the pressure increase, and the IMF By becomes duskward after the pressure impact. These simultaneous changes of IMF components might have affected the boundary location to some extent, which would otherwise be determined purely by the enhanced pressure impact. However, considering the much more significant increase of the pressure (by a factor of >6), we conclude that the pressure impact effect is almost certainly the responsible factor for the poleward shift of the boundary in this event.
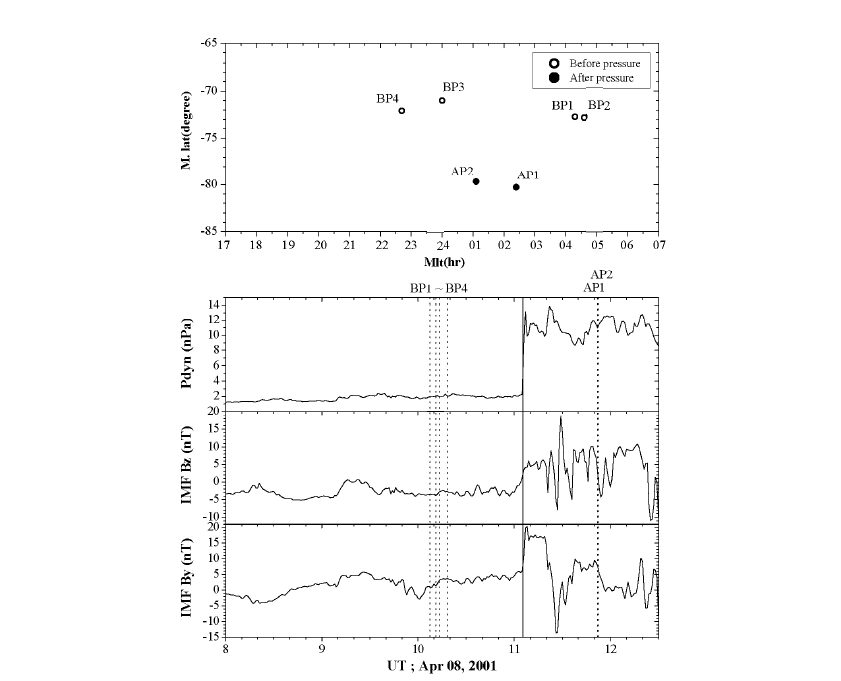
Another example to demonstrate the pressure effect on the boundary location is shown in Fig. 3, in the same format as in Fig. 1. Again the pressure enhancement is very large, increasing from ∼2 nPa to ∼10 nPa. In this case, the preceding IMF Bz is southward and the IMF Bz fluctuates after the pressure increase. The boundary locations prior to the pressure impact, BP1, BP2, BP3, and BP4, lie in between ∼-71° and -73°. It is clearly seen that after the pressure enhancement, the boundary moved poleward by several degrees, again confirming the suggestion by Boudouridis et al. (2003).
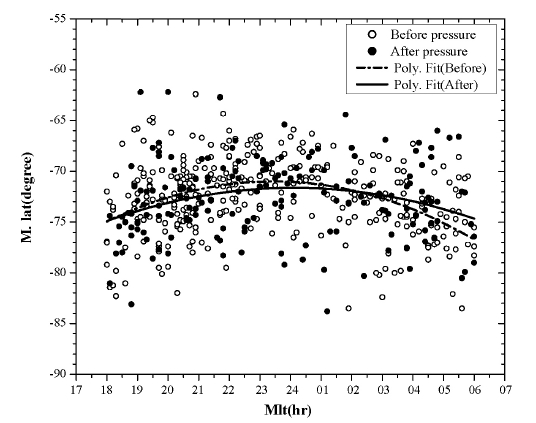
Fig. 4 shows the distribution of the boundary values, b5e, for the 168 events. The values before and after each of the pressure impacts are distinguished by different symbols. The two curves are polynomial fits for each case, respectively. The main features that one can see in Fig. 4 are that (i) statistically, the boundary locations after pressure impacts become more poleward over the pre-midnight through near-midnight MLT regions but it is the other way around nearer the dawn sector, yet (ii) the statistical shift of the boundary value is very small, ∼1 deg or so, and the distribution suffers from a very large scatter. Actually, the standard deviations are ∼3.4 for the distribution before the pressure increase and ∼3.8 for the distribution after the pressure increase, which makes the statistical comparison between the two not very meaningful.
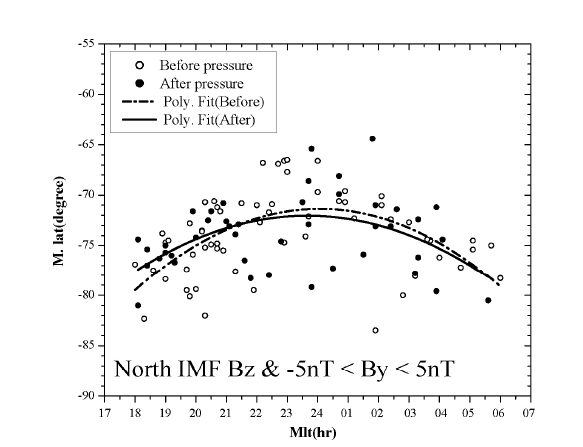
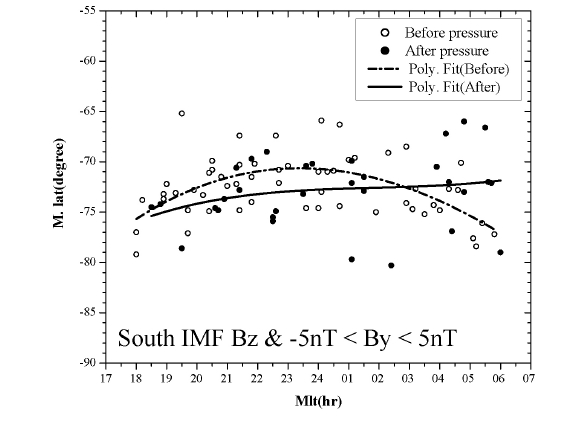
There may be more than one reason for the large scatter in the b5e distribution in Fig. 4. One possibility that one should check is the possible preconditioning effect by IMF Bz state proceeding each pressure increase time. We therefore separate the results in Fig. 4 into two cases: The preceding IMF Bz is northward and southward, respectively, the results of which are shown in Figs. 5 and 6, respectively. Furthermore, according to the recent work by Lee et al. (2010), the IMF By intensity and direction can affect the shape and structure of the polar cap. Thus in Figs. 5 and 6, we limited the graph to events where the preceding IMF By ranges between -5 nT and +5 nT. In other words, only the cases of a low IMF 'By' value (-5 nT < By < 5 nT) were chosen, in order to minimize the possible IMF By effect.
From both Figs. 5 and 6, one can see an overall trend of poleward movement of the b5e boundary distributions after pressure impacts, consistent with what Boudouridis et al. (2003) suggested. However, the trend is not strong enough, and the distribution still suffers from a large range of scatter (in these two cases, the standard deviations are ∼2.6 [before] and ∼3.6 [after] for the southward IMF Bz case, and ∼3.5 [before] and ∼3.3 [after] for the northward IMF Bz case). Clearly, other factors must still play a role in determining the boundary locations.
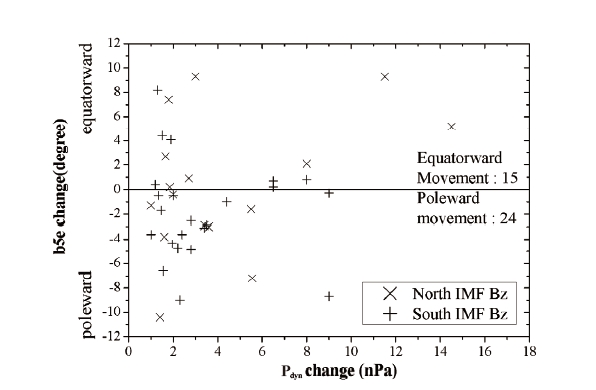
One of the other possible factors that might affect the boundary locations is the amount of the Pdyn increase. Fig. 7 shows the amount of b5e change as a function of the pressure increase. We limited the study to the events for which a DMSP satellite crosses the poleward boundary of the nightside oval at a similar MLT zone before and after a pressure increase, which is, however, not well realized in many cases. Specifically, we have imposed the condition that the MLT difference is less than 2 hours between the crossings before and after the increase time of a specific pressure increase event. Fig. 7 indicates that the number of events is larger for poleward movement (24) than for equatorward movement (15). This result has no strong dependence on IMF Bz polarity. This result therefore indicates that statistically, an enhanced solar wind pressure causes an effect of poleward movement of the boundary in many cases, but not always.
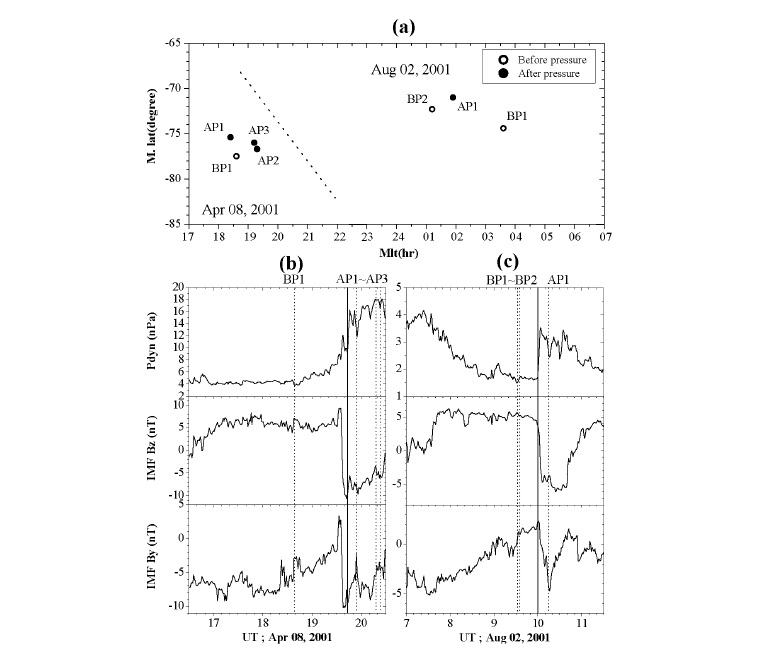
Although the results presented above “overall” or at least in more than half of the cases seem to support the possible shrinkage of the polar cap size by enhanced pressure impact, they also indicate that the boundary locations can be complicated by factors other than the pure pressure effect. One possible situation is demonstrated in Fig. 8.
Two separate events are presented in Fig. 8. In both events, the pressure enhancement is accompanied by a simultaneous southward turning of IMF Bz. The boundary values are shown in the top panel for both events
(the slanted dashed line is drawn simply for the sake of making a visual distinction between the two events). It is clear that in both events, the boundary values after the pressure impact actually moved a bit equatorward rather than poleward. This clearly implies that the pure pressure effect that would alone have induced a poleward shift of the boundary has been overwhelmed by the more significant southward turning of IMF Bz, which can induce an equatorward shift of the boundary.
In this paper we investigated the response of the poleward boundary of the nightside auroral oval to impacts of solar wind dynamic pressure enhancements. The boundary values were represented by b5e values as obtained from the DMSP satellite particle observations. We confirmed that the basic effect of an enhanced dynamic pressure impact is to shift the poleward boundary of the auroral oval more poleward. However, we also found that such an effect can be complicated by other factors. We have suggested that one possible complication can be caused by a simultaneous southward turning of IMF Bz. Another possible factor affecting the boundary location is the initial state of the dynamic pressure preceding the dynamic pressure increase front, which would be an influential factor (i.e., a preconditioning factor) in setting the polar cap boundary prior to any impact by solar wind. It is also possible that the boundary movement can depend on the degree of the pressure increase. An even more complicated situation can be a possible occurrence of substorm around the time of pressure impacts. Therefore, depending on which factor(s) dominates over the pure pressure impact effect, the magnetospheric polar cap could adjust its boundary location either poleward or equatorward in response to the impacts of solar wind pressure enhancement.
Finally, there are two issues that are worthwhile to comment on. First, it is not unreasonable to assume that the poleward shift of the poleward boundary of the auroral oval occurs in both nightside and dayside regions in response to a pressure impact, implying shrinkage of the polar cap size. In fact, this was shown to be the case in the work by Boudouridis et al. (2003), although we have focused on the nightside only in the present paper.
Second, the shrinkage of the polar cap means a reduction of the available tail lobe energy, which therefore can be an influential factor on tail dynamics, such as substorm occurrence. The expansion of the polar cap implies the opposite situation, of course. This therefore means that depending on which factor, dynamic pressure effect or simultaneous IMF change effect or anything else, is dominant, the response of the magnetosphere can lead to different modes of dynamics. This may be related to the recent suggestions by Lee et al. (2007) regarding why some solar wind changes trigger substorms and why some others do not.