Global positioning system (GPS), one of the global navigation satellite systems, has played its fundamental roles of providing positioning information and precise timing in last two decades. Recently, it is used for monitoring and understanding of the earth system, based on the further advanced geodetic technology (Afraimovich et al. 2000, Yin et al. 2004). GPS is also one of the powerful tools in understanding the regional and global ionosphere variation characteristics. The ground GPS infrastructure, including more than 400 of the international GPS reference stations uniformly distributed in the world as well as more than tens of thousands of the regional GPS reference stations, plays an important role in the research of the ionosphere. Recently, the study of calculating the vertical spatial-temporal distribution of the ionosphere total electron content (TEC) has been actively carried out by installing GPS receiver at low earth orbit-satellites. Like this, GPS is more widely applied thanks to the more precise technology and research.
GPS basically provides two signals in the L-band. The mean frequency of L1 signals is 1,575.42 MHz and that of L2 signal is 1,227.60 MHz. According to the GPS modernization plan, some of the satellites transmit L5 signal (1,176.45 MHz). Since different signals are simultaneously received at the ground station, the TEC can be accurately estimated. Different delays are caused when the GPS signals pass through the ionosphere. Thus, using this information, the ionosphere TEC can be estimated. If a single, specific signal is received and processed on the ground, the ionosphere TEC cannot be accurately estimated (Gao & Liu 2002, Hernandez et al. 2000).
Delays in GPS signals are caused by the free electrons in the ionosphere. Since such a delay error directly affects the position error and navigation of the GPS user, modeling and monitoring of the ionosphere is significant. Especially, modeling of the ionosphere is also used for the monitoring of the communication system and the space environment. Estimation of the ionosphere TEC value using GPS observation data has been studied since mid- 1990s until now, and it has become more accurate by the interconnected verification with various observation equipments such as wide-range ionosonde and incoherent scatter radar (ISR) and the development of models (Fuller-Rowell et al. 1996, Lei et al. 2004). Many of the GPS ionosphere models are based on the spherical harmonics method which is appropriate to understanding a overall variation characteristics of a large-scale structure, that is, the global ionosphere, but not efficient in analyzing various and regional phenomena in a small scale (Schaer 1999, Wielgosz et al. 2003). Thus, for the accurate modeling of the regional ionosphere, Kriging method, multiquadric method or interpolation method such as the inverse distance weighted method is suitable.
Another important thing in the determination of the ionosphere TEC value is differential code biases (DCB). Each of the GPS frequencies has the hardware bias which affects the accuracy of the ionosphere TEC estimates (Coco et al. 1991, Lanyi & Roth 1988). Mechanical delay is determined in term of relative to the GPS observation data. There are two or more biases among the observation data of which magnitude range from several nano-seconds to tens of nano-seconds. The DCB determined by the GPS satellite and the receiver depends upon the GPS satellites, and the measurements vary depending of the GPS receivers, the type of observation and the characteristics of the hardware.
The International Ionosphere Analysis Center calculates the vertical TEC based on the grids whose resolution is 5 (E) × 2.5 (N) using the data network of the international GPS reference stations uniformly located in the world and provides the individual DCB values of the GPS satellites and the reference station receivers (Choi et al. 2009). However, the DCB of the reference station receiver should be separately calculated to develop the ionosphere model using the regional GPS reference station network.
In this study, we provide the DCB values of the GPS reference station receivers of the nine Korea Astronomy and Space Science Institute (KASI) according to their types and the result of the comparison. The change of the DCB values before and after the replacement of the GPS reference station receivers is provided and the effect of the DCB values on the TEC estimation is also analyzed.
2. ESTIMATION OF THE IONOSPHERE TEC AND THE RECEIVER DCB
The ionosphere TEC means the quantity of the free electrons on the path where the GPS signal pass through from the satellite to the receiver. It can be expressed as the following Eq. (1).
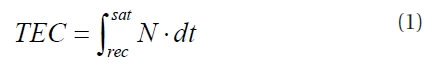
where
The dual frequency receiver used in the GPS reference stations receives the code of the L1 and L2 frequencies and the carrier phase observation data. The


Here,


To increase the ionosphere TEC accuracy and to estimate the absolute value, DCB must be considered. The simplest way to estimate the DCB is to compare the different types of code information received by the same receiver together.
If the respective DCBs of a GPS receiver and the satellite are expressed as

Here,χdenotes the angle between the ionosphere pierce point and the zenith direction.
If the Eq. (6) is rearranged for the slant TEC value from the GPS satellite,

To obtain all the unknowns that should be estimated, the VTEC and the DCBs of the satellite and the receiver, this equation can be expanded in a matrix form as in the Eq. (8) (Choi et al. 2009).
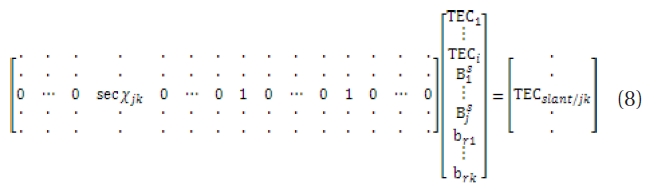
Here, the number of GPS satellites (
Here, the number of GPS satellites (


When SVD is carried out using the Eqs. (9) and (10) above, the equations are decomposed into the basic matrix as in the Eq. (11).
Here,
Here,
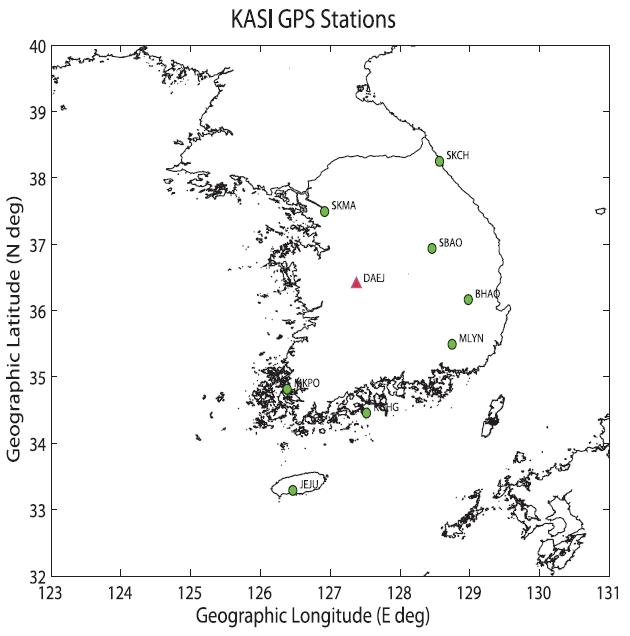
The DCB of a GPS receiver varies depending on the properties of the receiver and the observation type (Schaer 2008). In this study, as shown in Fig. 1, the data from the nine GPS reference station of KASI were used for the calculation and analysis of the ionosphere TEC and DCB over the Korean Peninsula.
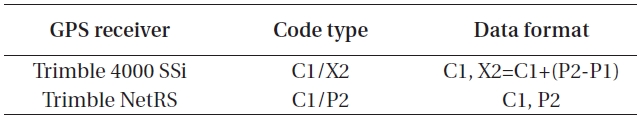
Beginning with the receiver in the Mt. Bohyeon GPS reference station in November, 2004, KASI replaced all the 9 Trimble 4000 SSi receivers in the reference stations with Trimble NetRS. The types and the formats of the observation information are compared in Table 1. To compare the ionosphere TEC and DCB before and after the receiver replacement, the 3-day data from March 2, 2004 to March 4, before receiver the replacement as well as the 3-day data from January 2, 2010 to January 4, after the replacement, were processed. The C1/X1 type in Table 1 is recognized as a Cross-Correlation receiver which is used in Trimble 4000 SSi. The newly substituted receiver Trimble NetRS receives the signals in the non Cross-Correlation type, generating C1 (C/A) code and P2 code. Thus, in this study, the receiver DCBs of the C1/X2 and C1/P2 data types were respectively estimated and compared.
3.1 Estimation of the DCB values of Trimble 4000 SSi receivers
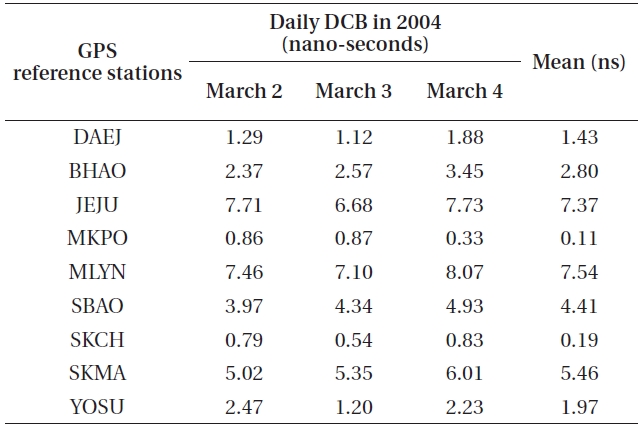
The receiver DCB values were estimated by using the 3-day GPS data observed beginning on March 2, 2004, before the GPS receiver replacement. The receiver DCB values were estimated in one hour of time interval at each reference station and the daily DCB values are calculated by averaging the 24 hours of data. Table 2 shows the daily mean DCB values in ns. The 3-day mean DCB at the Daejeon (DAEJ) international reference station was very small as 1.43 ns. The mean DCBs of the receivers at Mt. Bohyeon (BHAO), Mokpo (MKPO), Sokcho (SKCH) and Yeosu (YOSU) were 2.80 ns, 0.11 ns, 0.19 ns, and 1.97 ns, respectively, all being less than 3 ns. On the contrary, the mean DCBs of the receivers at Jeju (JEJU), Milyang (MLYN), Mt. Sobaek (SBAO), and Seoul (SKMA) were 7.37 ns, 7.54 ns, 4.41 ns, and 5.46 ns, respectively, being relatively large.
[Table 1.] Types and formats of GPS receiver data.

Types and formats of GPS receiver data.
[Table 2.] Estimation of mean DCB of the Trimble 4000 SSi GPS receiver.

Estimation of mean DCB of the Trimble 4000 SSi GPS receiver.
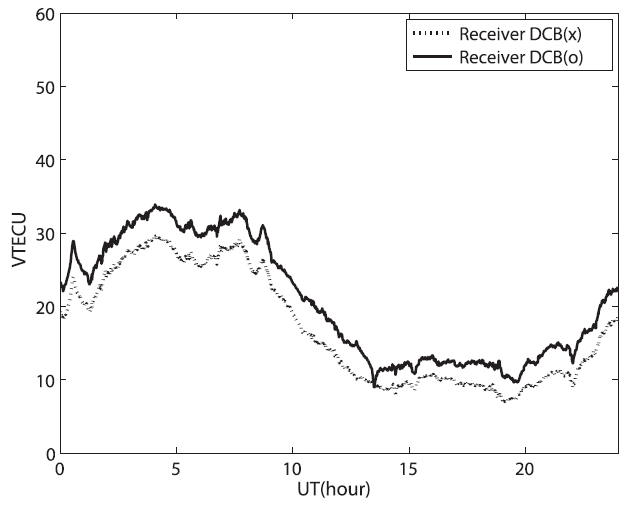
In order to analyze the effect that the receiver DCB values have on the estimation of the ionosphere TEC, all the observation data during the whole day of March 2, 2004, measured at all the 9 GPS reference stations were used for the data processing. The ionosphere monitoring model developed by Choi et al. (2009) was applied for the observation data processing. The ionosphere TEC values over the Korean Peninsula were calculated for the time before and after the application of the receiver DCB values and the result is shown in Fig. 2. For the receiver DCB values, the values estimated for the corresponding date were applied. To consider the effect of the receiver DCB only, the DCB of the GPS satellite was excluded from the data processing in this study.
Fig. 2 shows the variation of VTEC over the Korean Peninsula in one whole day. It is the TEC values calculated from the data observed with Trimble 4000 SSi receiver of the C1/X2 type. The overall TEC increased by 5 TECU (TEC Unit) after the application of the receiver DCB when compared with that before the application. The 1 TECU can be converted into 0.16 m of distance, approximately. Hence, the actual difference of 5 TECU is equivalent to the error accumulation of about 0.80 m of geometric distance between the GPS satellite and the receiver. Since such error can greatly affect the positioning accuracy of the GPS user, it should be taken into account.
3.2 Estimation of the Trimble NetRS receiver DCB
The ionosphere TEC and the receiver DCB values were estimated by processing the 3-day GPS measurements from January 2 to January 4, 2010. Table 3 shows the mean receiver DCB values of each of the reference station in the 3 days. The receiver DCB values of the Trimble NetRS were much larger than those of the previous Trimble 4000 SSi.
For all the three days, the mean DCB values of the replaced receivers in the DAEJ reference station were larger than 20 ns which were about 15 times higher than those before the replacement (mean 1.43 ns). The processing of the 3 day of data showed that the receiver DCB does not vary significantly. A remarkable point was that even the same type of receiver could show very different DCB values as in the cases of the receivers in MKPO and MLYN reference stations. The receiver in the MKPO reference station showed lager DCB by approximately 6 ns than those in other reference stations. In contrast, the DCB of the MLYN receiver was more than 7 ns less. There has been reported that the difference of DCB in the same receiver is generally caused by the regional location or the receiver temperature. Considering that MKPO and MLYN reference stations are concentrated in the limited region of Korean Peninsula as other reference stations, it can be presumed that the difference in the receiver temperature is related with the difference of the DCB. The mean DCB values of the receivers at the rest of the reference stations were almost similar to the mean DCB, except those of MKPO and MLYN.
[Table 3.] Estimation of mean DCB of the Trimble NetRS GPS receiver.
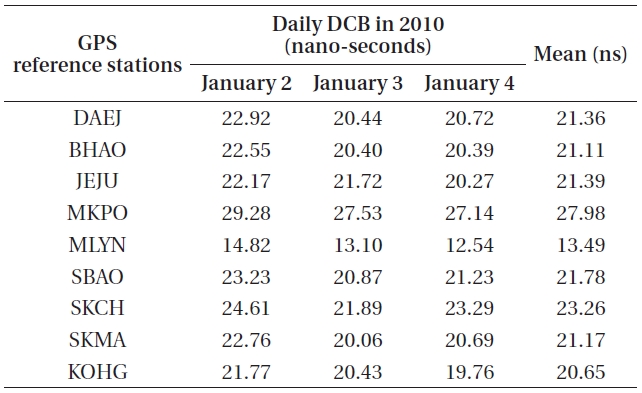
Estimation of mean DCB of the Trimble NetRS GPS receiver.
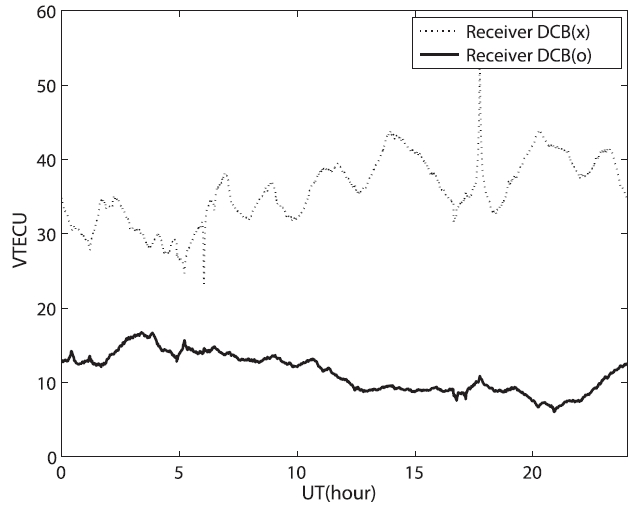
Fig. 3 shows the variation of the ionosphere TEC over the Korean Peninsula on January 2, 2010. The variation of VTEC was presented by dividing the previously estimated receiver DCB values into the times before and after the application. Carefully looking at the variation of the TEC before the application of the receiver DCB values, no specific ionosphere TEC variation characteristic is found as in Fig. 2, rather, a very irregular pattern is found. However, when the estimated receiver DCB values are applied to the re-estimated TEC values, the variation in the ionosphere TEC can be recognized, though the overall values are less than those before the application. This result implies that the receiver DCB values have a great effect on the estimation of the ionosphere TEC.
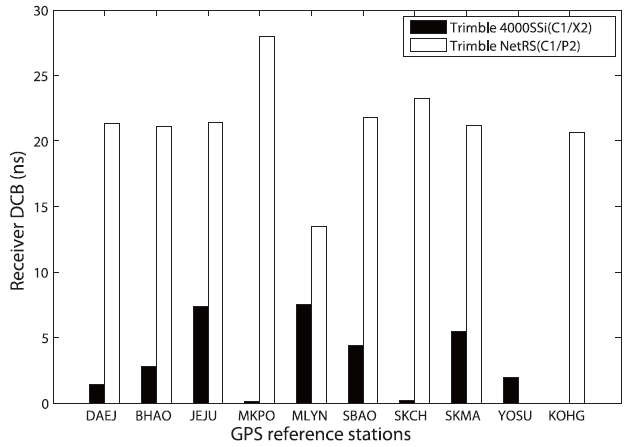
Fig. 4 is the comparison of the mean DCB values estimated before (Trimble 4000 SSi) and after (Trimble NetRS) the receiver replacement at the reference stations. After the receiver replacement, the DCB values of the receivers were increased in all the reference stations. There is no comparison available for YOSU and Goheung (KOHG) since the receiver was replaced when the GPS reference station was moved from YOSU to KOHG.
Through the study in this article, it was found that the DCB values vary depending on the types of receivers, the observation types and the external factors. In addition, the estimation of the absolute TEC value became possible by applying the DCB values to the estimation of the ionosphere TEC.
The purpose of this study was to analyze the effect of GPS receiver DCB values on the estimation of the ionosphere TEC. The DCB values of the 9 GPS receivers operated by KASI were individually calculated before and after the replacement. The estimation was based on the processing of the 3-day observation data for each of the receiver to improve the reliability of the estimated receiver DCB values. The receiver DCB values were calculated by applying the weights depending on the elevation angles of the GPS satellites and the SVD method for every one hour. The final DCB values were calculated by averaging the data of 24 hours.
The observation data processing result showed that the 3-day mean DCB values of the receivers before the replacement, that is, Trimble 4000 SSi, varied from the minimum 0.11 ns to the maximum 7.54 ns. To analyze the effect of the receiver DCB values, they were applied to the estimation of the ionosphere TEC, showing that the DCB values affected the TEC over Korean Peninsula by 5 TECU, approximately.
In addition, after the receiver replacement (Trimble NetRS), the mean DCB values larger than about 20ns were calculated except those of a few reference stations. It was found that the receiver DCB values can cause a very large error in the estimation of the ionosphere TEC. As presented in Fig. 3, since the Trimble NetRS receivers have very large DCB values, the DCB values must be considered in estimating the ionosphere TEC.
We expect that the estimated DCB values depending on the types of the receivers in this study can contribute to enhancing the accuracy of the ionosphere TEC in all over the Korean Peninsula. Particularly, it is expected that the data in this paper will contribute to the research of the ionosphere TEC by means of GPS not only in Korea but also in other countries.
This study was supported by the 2009 Join Research Project of the Korea Research Council of Fundamental Science and Technology, Ministry of Education, Science and Technology.