The equipment that is used in radio astronomy has been changed to digitalized high-speed broadband systems due to the development of digital technology (Takahashi et al. 2000, Thompson et al. 2001). In addition, each of the observation countries now shares the interface by introducing internationalized standards rather than developing their own observation systems. Korea Astronomy and Space Science Institute has also designed, fabricated, and introduced the newest observation system since the initiation of the Korean very long baseline interferometer (VLBI) network (KVN) project in 2001 (Kim et al. 2004). The unique feature of the KVN observation system is that the VLBI standard interface (VSI, http://www.vlbi.org/vsi) was adopted as the interface for all the systems for the first time in the world, so that the connection interface could be shared among the systems for easy system integration. Since 2002, KVN has participated in the international joint consortium composed of MIT Haystack Observatory, USA, which has led the VSI standards, and other countries, and KVN has developed the Mark5B high-speed recoding/playback system (Oh et al. 2004, Whitney 2004). The developed high-speed recoding/playback system played an important role in substituting hard disk for the tape that had long been used for the recording of conventional radio astronomical observation data. In addition,
new network technology was combined with the system for the transmission of the observation data to the data processing center. The developed Mark5 system consists of a StreamStor RAID (http://www.conduant.com) board, which is able to process the data in stream type, and a special board in VSI standards for data input and output, added to the conventional mass storage server system. The system has evolved in the versions of Mark5A, Mark5B, and Mark5C. As the Mark5B system is used in many observatories in various countries, it is also used as high-speed recoding/playback system in KVN. The Mark5B system can be used as a recorder or player by downloading software for recording or playback to the field-programmable gate array (FPGA) of the VSI board. However, the VSI function of the Mark5A or Mark5B system is not fully utilized since the conventional observation systems in many observatories still have the Mark4 correlator type for the back-end system and the correlation process system (Oh et al. 2004, Whitney et al. 2004). In particular, while the VSI function is perfectly supported by the control operation software when the Mark5B system is used as a recorder, it is not supported when the system is used as a player. It can be said that KVN is the only system where the VSI function is perfectly used when applying the Mark5B system as a player. Thus, in this study, the playback control software needed when the Mark5B system is used as a player was developed through collaboration with the MIT Haystack Observatory. To verify the performance of the developed playback control software, we conducted a test, with the recorded data from the VLBI test observation, performed in between the KVN Yonsei Radio Astronomy Observatory and KVN Ulsan Radio Astronomy Observatory. The observation data used for the playback control software test were for the spectral line celestial body and continuum celestial body observed at 22 GHz band. Transferred to the correlation center, the observation data were played with the Raw VLBI Data Buffer (RVDB) system, a synchronization playback process system, in the Mark5B high-speed player. Then, they were played with the VLBI correlation subsystem (VCS) of Korea-Japan Joint VLBI Correlator, KJJVC (Oh et al. 2009) in RVDB. The correlation test was continued by playing the data with the Korea-Japan Joint VLBI Correlator and VCS of KJJVC (Oh et al. 2009) in RVDB, which resulted in normal autocorrelation and cross correlation. To verify the validity of the playback control software, a part of the data was taken before the playback with the software correlator (Yeom et al. 2009) and compared with the correlation process test results, which showed the same result as that of the correlation carried out with VCS. In this paper, we describe the development of the Mark5B system playback control software and the performance test results.
This article consists of the following sections: section 2 overviews the Mark5B system; section 3 briefly considers the data output module (DOM) of the Mark5B system; section 4 describes the playback control software developed by this study; section 5 discusses the performance test results of the developed the playback control software; and finally, section 6 concludes this article.
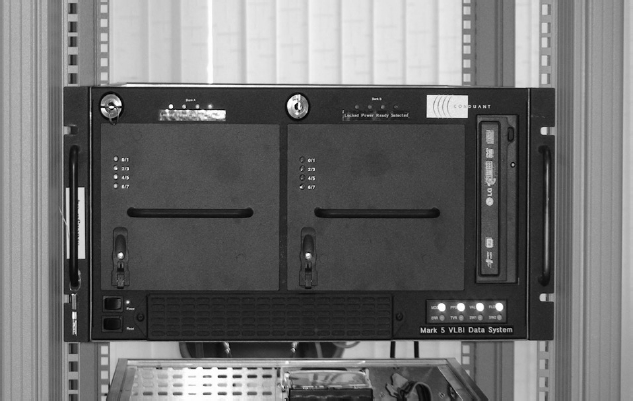
As shown in Fig. 1, the outer appearance of the Mark5B high-speed recorder system (Whitney 2004) is identical to that of the Mark5A. However, the biggest difference is that the Mark5B high-speed recorder system employs VSI as the interface board that is for the input and output of data. The constitution of the Mark5B system is briefly described below.
The Mark5B system is comprised of a StreamStor board for RAID composition, an I/O board in VSI standards, and two packs composed of eight hard disks. The input and output system of the Mark5B is briefly described below. Different from the Mark5A, the Mark5B system functions as the recording and playback are separated. The recording and playback functions are also mentioned below.
The DIM of Mark5B synchronizes the clock with 1 pulse per second (PPS) signal included in the input signal, and uses it as the standard clock signal. The DIM also sets the parameters when general data are acquired, monitoring the operation during the data acquisition. It also extracts the phase calibration (phase-cal) signal needed for the correlation system later. In addition, the DIM tests the data transmission and reception by generating the test vector and ramp signals for the examination of the Mark5B system and receiving the test vector signals. The input data processing status can be checked through the front panel data port (FPDP) (VITA Standards Organization 1998) bus adopted in the Mark5B I/O board. The DIM also includes the module to control PDATA, the visual information in the form of the American Standard Code for Information Interchange (ASCII) stream.
Different from the DIM, the DOM of the Mark5B is the system that usually has the correlation mode of the other Mark5B recording mode and is used to playback the data. There are two operation modes. One is the DOM station unit (SU) mode, which is the mode used for the SU operation of the Mark 4 correlator that is now used at the MIT Haystack Observatory (http://www.haystack.edu) in the USA, and the Max Planck Institute for Radio Astronomy (MPI, http://www.mpifr-bonn.mpg.de)/ Joint Institute for VLBI in Europe (JIVE, http://www.jive.nl) in Europe, etc. The other is the general VSI mode, playing the data recorded in hard disk drive (HDD) by means of VSI interface together with the visual information. This mode is used in KVN. The DOM may include the visual process module, depending on the users, to play the PDATA, the visual information recorded in the DIM. Here, QDATA and PDATA have the same type, differing only in their names.
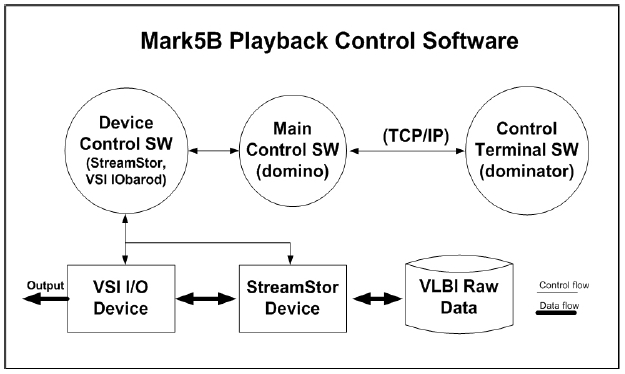
Fig. 2 shows the simple control operations when the Mark5B system is used as a player. The playback control software in Fig. 2, similar to the recording mode, has the dominator which is the control terminal exchanging commands through the Transmission Control Protocol/Internet Protocol (TCP/IP) (IEEE Standard Association 2002) communication. Domino, the main part of the playback control software, initializes the devices control software that interprets the input command and controls the hardware, and outputs the response to the operation command to the control terminal. After the hardware device is initialized by the input command from Domino and turns to the operation status, it plays the role of outputting the data stored in the hard disk according to the data playback command.
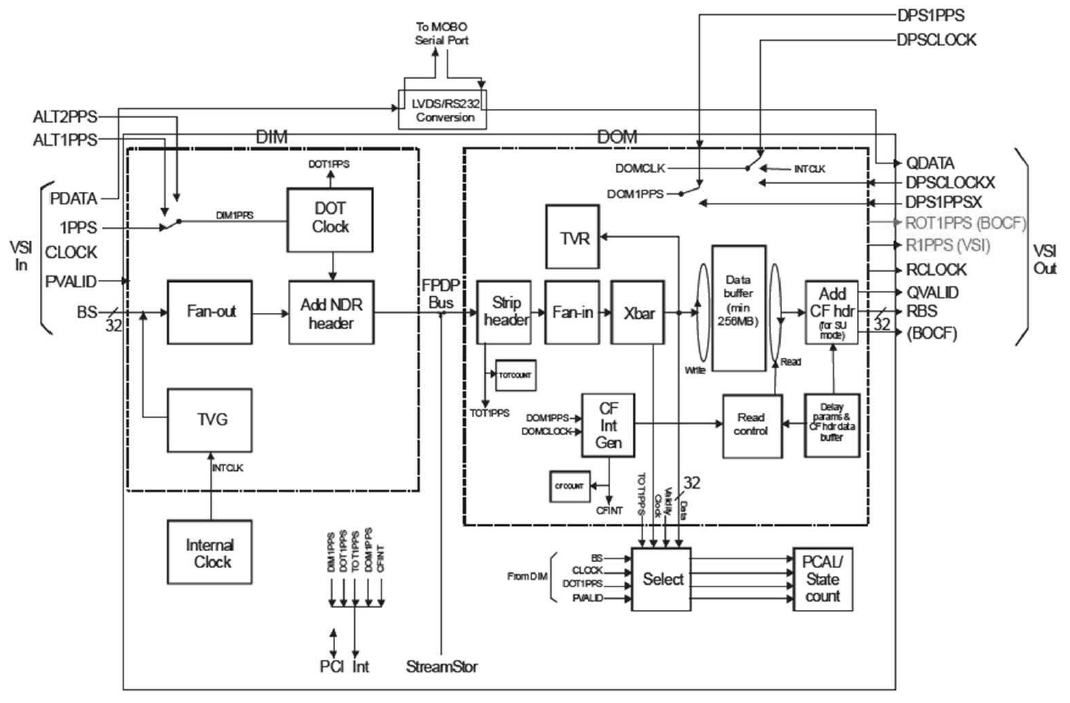
The Mark5B system was designed to meet the VLBI Standard Hardware Interface (VSI-H) (International VLBI Service 2002) standards. Fig. 3 is the module diagram of the Mark5B system presented according to the VSI-H standards. As introduced in Section 2, the Mark5B system is composed of the DIM and DOM. This section introduces the system, focusing on the DOM, and briefly describes each of the DOM signals shown in Fig. 3.
As in Fig. 3, the two representative signals used in the digital processing system (DPS) are as follows (International VLBI Service 2002):
DPSCLOCK: This is the clock signal from the DPS with the clock frequencies of 32 MHz at 1 Gbps and 64 MHz at 2 Gbps. It serves as the standard frequency of the DOM.
DPS1PPS: This signal is similar to the 1 PPS signal setting the DOT clock in the DIM, generating one signal in precisely one second intervals. It is used to synchronize the DOM clock inside the requested observe time (ROT).
The definitions of the representative signals that are used in the output data ports from the DOM module to the DPS in Fig. 3 are as follows:
Reconstructed bitstream signal (RBS0<>;RBS31): This is the signal from which a valid sample of bitstream is precisely reconstructed to output the input signal from the DIM or the data recorded in HDD pack to the RBS bus line of the DOM.
RCLOCK: This is the clock signal that is the output together with the RBS with the clock frequencies of 32 MHz at 1 Gbps and 64 MHz at 2 Gbps. This is identical to the CLOCK signal in the recording mode of the DIM.
R1PPS: This is the reconstructed 1 PPS signal that is to be output with the RBS.
ROT1PPS: This is the signal that is generated one time per second, precisely, and used in the beginning of the correlator frame (BOCF) mode, not in the VSI mode.
QVALID: This is the 1 bit global signal, like RBSn, indicating whether the reconstructed output data are normal in the DOM or not.
QDATA: This is constructed in the form of a standard 8-bit ASCII serial data stream and able to transmit a maximum of 2,048 bytes between individual R1PPS or ROT1PPS.
Requested observe time (ROT) clock signal.
The DOM has internal a ROT clock signal. This ROT clock signal has the standard time with which the reconstructed data are synchronized. The characteristics of the ROT clock signal are as follows:
ROT clock sets the present time of the system in one second unit, synchronized with the given DPS1PPS signal.
Once the ROT clock is set, it counts the DPSCLOCK cycle to maintain the time by itself. In other words, the next DPS1PPS signal is ignored before the ROT signal is reset.
3.2 DOM data playback function
Control Interface: The DOM control interface supports the two-way communication through RS-232 (recommended standard) and Ethernet that control and monitor the operation of the DOM.
High-speed/low-speed modes data playback: The VSI-H standards regulate the DOM output bit rate (fRBSI) to be operated in high-speed/low-speed mode depending on the DIM input rate (fBSI) in arbitrary systems (International VLBI Service 2002). This is possible by varying the ROT Clock increment for each DPSCLOCK cycle, which is the same with variation of the DPSCLOCK by the DPS. In addition, the speed of RCLOCK, ROT1PPS, R1PPS, and RBSn is all varied by synchronization.
Delay offset: In a storage-based DPS system, data are recorded in the mobile storage media and played later. The delay offset function of the DOM allows data sorting control in the DPS. In such a storage-based DPS System, VSI-H is regulated to include the function that the DOM can compensate the delay of RBS by a ROT clock, as shown in Fig. 3. A delay is presented in the bit offset. This allows the sorting for the data delay to be done in the DPS. If the delay offset is set as none other than zero, the RBSn bitstream, R1PPS, and QVALID signal outputs are delayed as much as the set value on the basis of ROT1PPS rising time. If the delay offset is zero, ROT1PPS and R1PPS are identical to each other. QVALID indicates that the valid data with exact delay are being output from the DOM.
When data are played in VSI-H standards, the DOM mode operation sequences are as follows:
First, through the control interface, the DOM is set to play the subset randomly required by the valid bitstream sent by the DIM. Second, through the control interface, a command is given to ROT clock so that it can be set as the UTC integer second of the time presented in the next DPS1PPS signal. At the same time, the delay offset is set together. Once the ROT clock is set, it counts the DPSCLOCK cycle to maintain the time by itself, ignoring the following DPS1PPS signals before the ROT signal is reset. Third, the DOM gives the command, through the control interface, to initiate the transmission of the bit-offset presented by the ROT clock or the input bitstream selected by being synchronized with the ROT clock. If the output data, as well as the delay offset, are played, precisely synchronized with the ROT clock, and valid, the QVAILD signal is logically TRUE. Finally, at the end of the valid playback data, the DOM commands, through the control interface, to stop the data transmission.
The Mark5B playback control software developed in this study refers to the DOM operation sequences explained above.
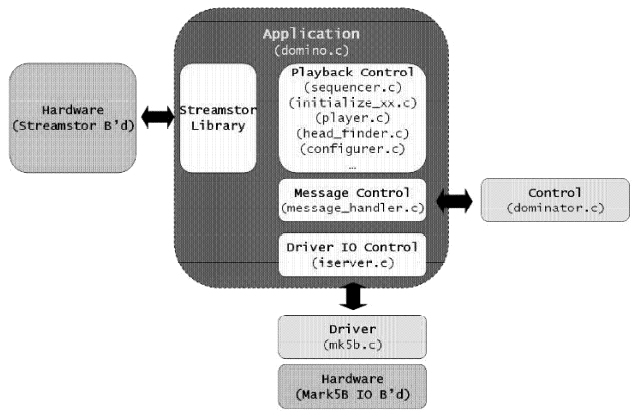
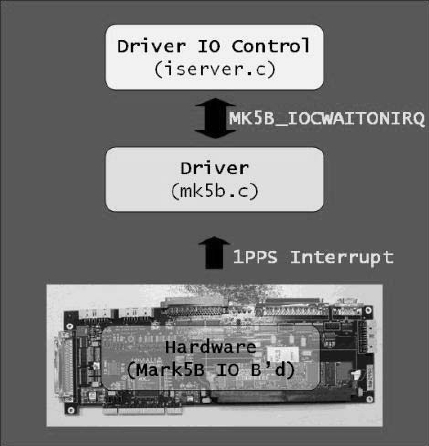
The Mark5B high-speed playback software checks the DPS1CLOCK and DPS1PPS signal in the VSI board at the execution of the software. When the two signals are unavailable, the playback control software immediately stops the execution. While the design standards regulate that these two signals are provided from the inside and outside, the software was modified so that the two signals are to be provided from the inside of VSI board. The reason for this modification is that the synchronization between Mark5B systems is not necessary since a few numbers of Mark5B players are linked with the RVDB system, although a mater clock is needed for a player in a data processing center to play data into data servers, such as the Raw VLBI Data Buffer (RVDB) system. Here, the DPS1PPS signal can be checked in the application through the Linux driver and sent following the flow in Fig. 5. The DPS1PPS input to hardware passes through PCI interrupt and calls the interrupt service routine of the driver.
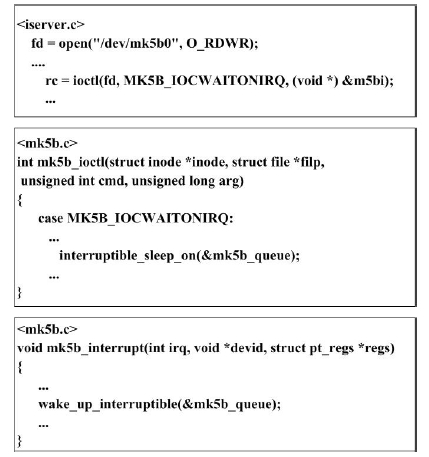
The interrupt checking process between the Linux driver and application can be seen from the source code in Fig. 6. First, iserver.c allows mk5b.c, the Linux driver file, by using the ioctl( ) function, to execute MK5B_IOCWAITONIRQ. The driver remains in infinite wait mode before the interruptible_sleep_on( ) function is called and the interrupt is input. Iserver.c also remains in infinite wait mode since it is not returned from iserver.c, the application, to ioctl( ).
The mk5b_interrupt( ) in the Linux driver is the interrupt service routine by DPS1PPS generated from the VSI board. The interrupt service routine returns the interrupt_sleep_on( ) function set in mk5b_ioctl( ) by using wake_up_interruptible( ) function. The data transmission between the Linux driver and hardware is performed by repeating the routine, synchronized with the DPS1PPS signal.
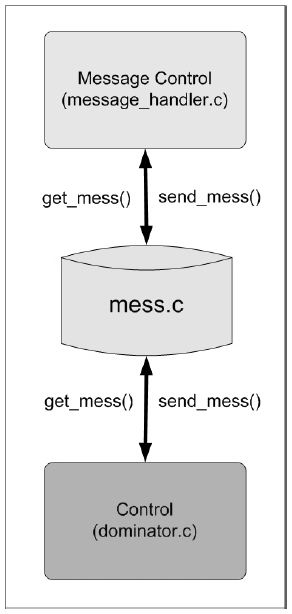
As shown in Fig. 7, dominator.c, the user interface, and the Mark5B playback control software transmit and receive commands and data by using the massage function. The message transmission and reception function is located in mess.c and it sends message by using the send_mess( ) function. In addition, the message reception is done by means of the get_mess( ) function.
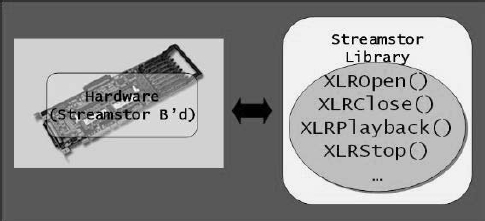
As shown in Fig. 8, control and data transmission and reception between StreamStor RAID and the application is conducted by using the StreamStor library. The functions defined in xlrapi.h, xlrdbcommon.h, and xlrtypes.h can be used. Basically, the functions such as XLROpen( ), XLRClose( ), and XLRPlayback( ) can be used to control the StreamStor RAID board.
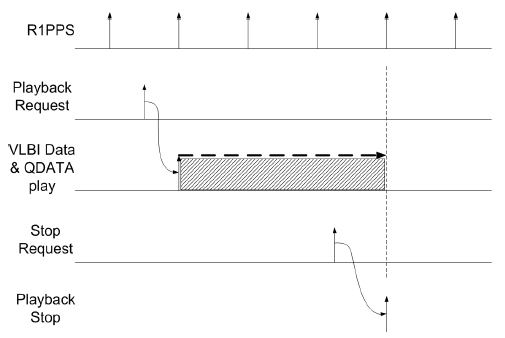
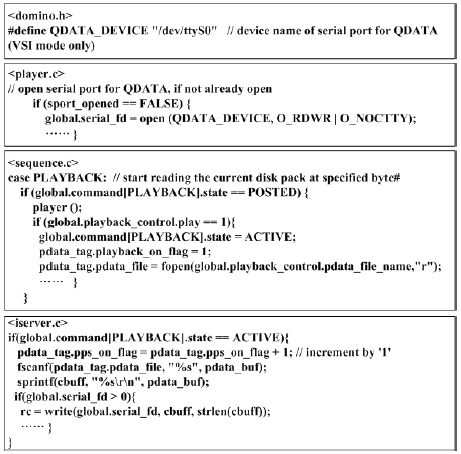
The Mark5B playback control software realized the module to play the visual information PDATA that is recorded in the DIM mode, together with the data in the DOM mode with the data. The visual information QDATA timing chart in the DOM mode is shown in Fig. 9. The visual information QDATA for playback in Fig. 9 is output to the output port with the data, by being synchronized with the R1PPS signal as it is waiting for the data playback by DPSCLOCK. Since the visual information PDATA recorded in the DIM mode is saved in the form of a file in the Mark5B DOM mode, the software was designed so that the recorded visual information in one second unit can be read and played after the file is synchronized with the R1PPS signal, the data playback command is input to the DOM, and the visual information QDATA file is loaded. Fig. 10 simply shows the source code designed for the control of QDATA, the visual information. As shown in Fig. 10, to synchronize the QDATA visual information with the data and play it in VSI mode, a serial port is defined in domino.h and the serial port defined in player.c is opened to allow data output. In addition, when PLAYBACK is activated in sequence.c, the PDATA file recorded in the DIM mode is opened and the one-second unit of visual information is played into the VSI output port with the data by the PDATA file that is read by iserver.c.
The Mark5B playback control software developed in this study was designed to play the VLBI recorded in the Mark5B recording media, as well as the visual information QDATA, through the VSI output port, except the high-speed/low-speed playback mode and delay offset function introduced in section 3.2. The high-speed/low-speed playback mode and delay offset function will be further realized in the future.
5. PLAYBACK SOFTWARE PERFORMANCE TEST AND THE RESULTS
5.1 Observation data and test method
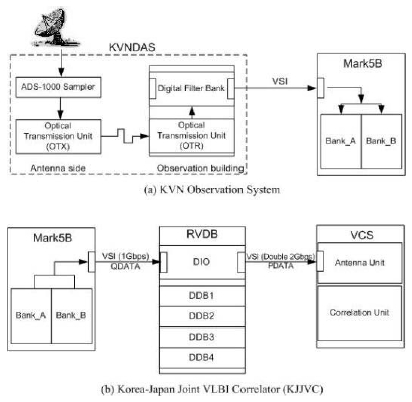
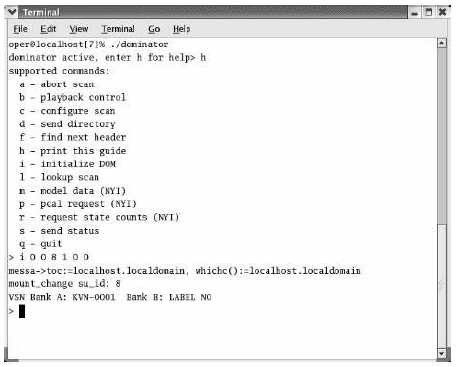
Fig. 11 is the playback control software run-screen of the Mark5B high-speed playback system developed in this study. To verify the performance the software, a playback test and correlating test were conducted with the VLBI test observation data from three observatories of KVN (Yonsei, Ulsan, and Tamna). The observation data used in the experiment are shown in Table 1. Out of the KVN VLBI test observation data, the data from KVN Yonsei and KVN Ulsan were used for the Mark5B playback control software test. The observation data used in the test were for W49Nm, a line celestial body, and NRAO150, a continuum celestial body. As in the experimental scheme in Fig. 12a, they were observed with a 22 GHz receiver and the data passed through a digital filter of 16 MHz band and was recorded by the Mark5B high-speed recorder as 16 channel-data. The observation data were transferred to the Mark5B high-speed recorder of KJJVC, as shown in Fig. 12b, and played in RVDB, and then input to VCS, the correlator for correlation processing (autocorrelation and cross correlation). To compare the correlation results of the data played by the Mark5B playback control software, a data sample was randomly extracted from Mark5B and correlated (autocorrelation and cross correlation) with the software correlator (Yeom et al. 2009) without the playback.
5.2 Test results and discussion
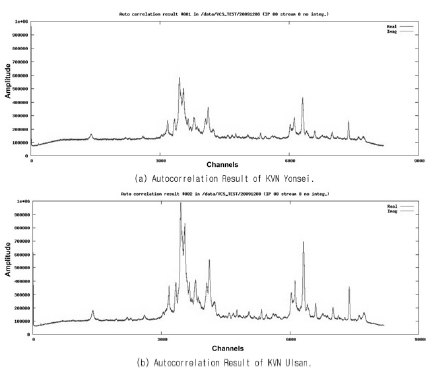
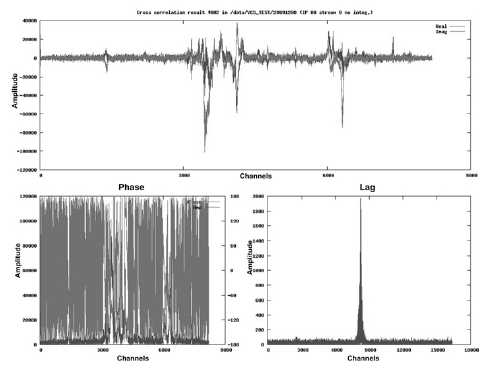
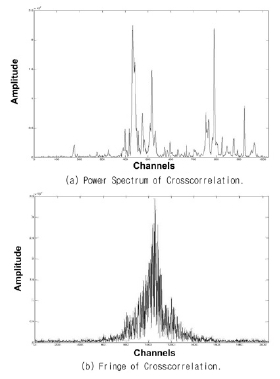
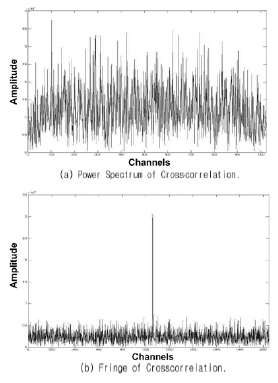
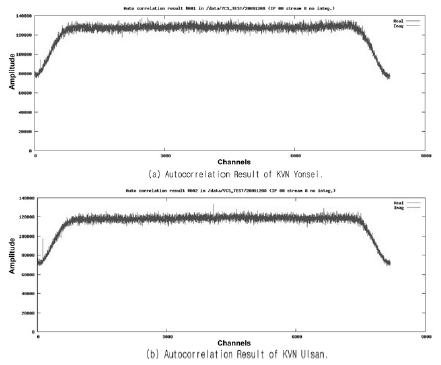
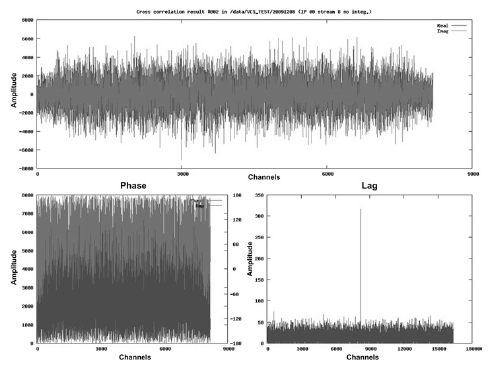
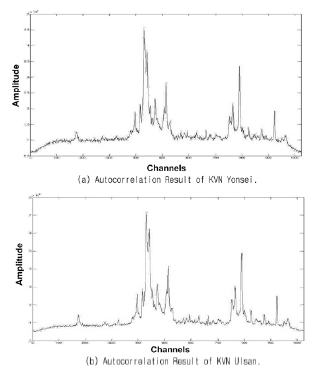
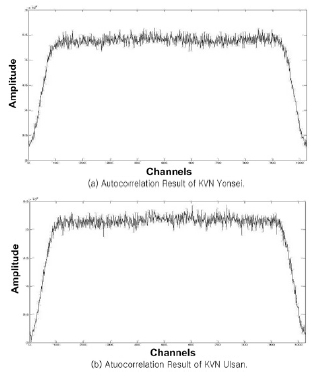
Observation data were played to RVDB in Mark5B by using the Mark5B playback control software developed in this study, and then input to VCS for correlation processing. The autocorrelation and cross correlation results of W49Nm, a spectral line celestial body, are shown in Figs. 13 and 14, respectively. The autocorrelation and cross correlation results of NRAO150, a continuum celestial body, are shown in Figs. 15 and 16, respectively. The autocorrelation and cross correlation results of W49Nm, a spectral line celestial body, with the software correlator, following the random data extraction from Mark5B for the comparison with the results from playback by the playback control software, are shown in Figs. 17 and 18, respectively. The corresponding autocorrelation and cross correlation results of NRAO150, a continuum celestial body, are shown in Figs. 19 and 20, respectively.
[Table 1.] Observation data information to verify test result.
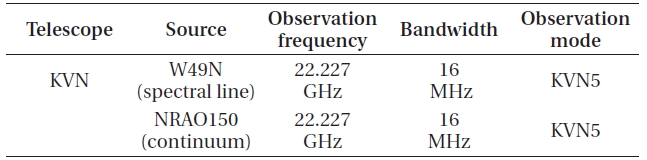
Observation data information to verify test result.
The correlation results by VCS in Figs. 13 and 14 show strong spectrum just as the characteristic of the W49N celestial body that has strong spectrum. In particular, in the cross correlation result in Fig. 14, a strong fringe was found in the lag range of KVN Yonsei and KVN Ulsan baseline. As in Figs. 15 and 16, the correlation results of NRAO150, a continuum celestial body, showed the spectrum shape of a continuum celestial body with the characteristic of a KVNDAS digital filter band (Oh et al. 2007). In Fig. 16, the cross correlation result showed a fringe was found in the lag range of KVN Yonsei and KVN Ulsan baseline. The results of the correlation conducted with the software correlator by random data extraction for comparison were similar to the correlation results following the playback of the data by the playback control software, which can be understood by comparing the results in Figs. 13 and 14 with the results in Figs. 16-18, as well as Figs. 19 and 20. In addition, in the experiment that was performed to check the normal processing of the visual information QDATA, the correlation was conducted through VCS by referring to the visual information QDATA, which indicated that the visual information processing module worked normally. The correlation results that were obtained by playing the observation data with the developed playback control software were compared with the correlation results by the software correlator for the comparison of the spectrum shapes. The reason is that, although the software correlator used for the comparison was developed for the development procedure of VCS, its hardware resource was insufficient to carry out the experiment under the conditions that were the same with those of a VCS hardware correlator. Thus, the x-axis and y-axis values are different in the VCS correlation results, since various parameters were randomly set only to check whether the output spectrum shapes were similar or not.
Using the playback control software developed in this study, correlation processing was conducted in the VCS, the hardware correlator, of KJJVC through data playback. The correlation results by the software correlator showed that the developed playback control software was valid. Moreover, regarding the visual information processing, which is important in VLBI observation, by the abovementioned correlation experiment results, it was verified that visual information QDATA that was recorded during the observation in between the Mark5B high-speed player and RVDB system were normally transmitted together with the observation data playback.
In this study, the playback control software was developed for the Mark5B high-speed player, which is a part of the Korea-Japan Joint VLBI Correlator. The Mark5B system can be applied as either a recorder or a player depending on the FPGA program setting. When the Mark5B system is used as a player, the SU mode can respond to the Mark4 type system and the VSI mode can respond to the VSI standards. While the recording/playback software for the SU mode has been already developed and widely used, only the recorder software has been developed for VSI, and thus, we have developed the playback control software for the VSI mode of the Mark5B player. The developed playback control software includes the application part for data playback, the part for VSI input/output board, the part for StreamStor RAID board, and the user interface part, in addition to the part for visual processing of the observation data. To verify the performance of the developed playback control software, actual observation data was played into RVDB with the developed Mark5B playback control software and correlated in the VCS correlator. For the comparison, sample data were randomly extracted from the observation data and correlated with the software correlator. It was confirmed that the Mark5B playback control software developed in this study was valid by verifying that the VCS correlation result and the software correlation results were identical. In addition, it was also confirmed that the visual information and the observation data were played by the RVDB System when the data recorded are played together with the visual information. In the future, the user interface will be improved by adding the TCP/IP module for the communication with the control terminal and integrating the GUI programs, and the high-speed/low-speed playback mode for data playback, as well as delay offset, will be added.
This work was supported by the Korea Astronomy and Space Science Institute (KASI) through Korea-Japan Joint VLBI Correlator and Receiver Development program funded by Republic of Korea government.