Chlorophyll a fluorescence is a convenient, non-destructive, rapid and quantitative probe of several aspects of oxygenic photosynthesis (Ralph and Burchett 1995, Baker and Oxborough 2004, Ralph and Gademann 2005). It is particularly sensitive to the functioning of photosystem II (PSII), providing information on photosynthetic performance and protective responses via rapid, non-intrusive measurements (Ralph and Burchett 1998, Adams and Demmig-Adams 2004, Sharon and Beer 2008). A sensitive pulse amplitude modulation (PAM) fluorometer has been used as an effective tool to understand how seagrasses cope with stresses, such as excess light, ultraviolet (UV) radiation, hyper-salinity, desiccation, thermal stress and heavy metal ion stresses (Ralph and Burchett 1995, Ralph and Burchett 1998, Figueroa et al. 2002, Campbell et al. 2006, Koch et al. 2007, Kahn and Durako 2009). One of the most informative chlorophyll a fluorescence parameters is the maximum quantum yield (Fv/Fm), which is theoretically independent of chlorophyll concentration. Because it is measured on dark-acclimated samples, Fv/Fm is also independent of electron transport (Beer and Bjok 2000, Ralph and Gademann 2005, Beer et al. 2006). Fv/Fm is, therefore, a robust indicator of photosynthetic stress, and has been used to diagnose thermal stress, hyper-salinity, desiccation and other environmental stresses (Campbell et al. 2006, Koch et al. 2007, Kahn and Durako 2008, Biber et al. 2009, Kahn and Durako 2009). Additionally, PAM fluorometry provides a measure of chlorophyll a fluorescence using rapid light curves (RLCs), in which the electron transport rate (ETR) can be determined for plants exposed to ambient light conditions (Beer et al. 2006, Campbell et al. 2008, Collier et al. 2009). RLC-derived parameters including photosynthetic efficiency (α), saturating irradiance (Ek) and maximum electron transport rate (ETRmax) have been widely used to quantitatively compare RLCs for chlorophyll a fluorescence (Ralph and Gademann 2005, Bitet al. 2007, Campbell et al. 2007, Collier et al. 2009). Therefore, these RLC-derived parameters such as α, Ek and ETRmax also can be used as physiological indicators of plant stress.
When transplanting seagrasses, transplants may establish by adapting to new transplant environment in their physiology, morphology and growth (Zimmerman et al. 1995, Moore et al. 1996, van Tussenbroek 1996, Horn et al. 2009). Their photosynthesis will also be affected to some extent by transplanting shock, which can be indicated by characteristics of chlorophyll a fluorescence (Figueroa et al. 2002, Lamote and Dunton 2006, Koch et al. 2007, Kahn and Durako 2008, Horn et al. 2009, Kahn and Durako 2009). Although PAM fluorometry has been widely used to identify physiological stresses imposed on seagrasses, few studies have been done to investigate the physiological responses of seagrasses to transplanting (Horn et al. 2009). In this study, the Fv/Fm, and the RLC-derived parameters (α, Ek and ETRmax) of both transplants and reference plants were measured using a Diving-PAM fluorometer. At the same time, their morphology, shoot leaf weight and productivity of both transplants and reference plants were also measured to assess the establishment success of transplants. The objective of this study was to investigate the transplant establishment processes through measuring chlorophyll a fluorescence parameters as well as the morphology, biomass and productivity of both transplants and reference plants. We hypothesized that the measurements of chlorophyll a fluorescence parameters would provide valuable information for assessment of establishment success of Zostera marina transplants.
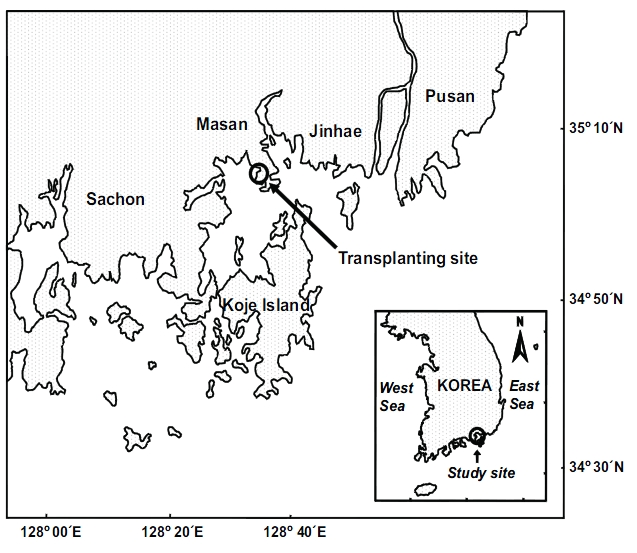
Transplantation was conducted in Jindong Bay (35°05.6'N, 128°33.9'E) on the southern coast of Korea (Fig. 1). Seagrasses were once widespread in this bay, but significant seagrass decline has occurred due to human activities such as seashore road construction, reclamation, fishery activities, and increased nutrient loading during the past decades. Recently, small Z. marina patches have been observed inthe bay. Thus, the environment conditions in this bay are probably suitable for seagrass growth. The mean water depth at the study site was about 1.5 m relative to the mean sea level, and the sediment was loamy. The tidal regime is semi-diurnal with a 1.5 m tidal range (Tide tables for coast of Korea, National Oceanographic Research Institute of Korea). Z. marina shoots used for transplantation were collected in the natural Z. marina beds in the vicinity of the transplant site. The remaining shoots in the natural Z. marina meadows were used as reference plants.
Seagrass transplantation was conducted in October 2008. Z. marina shoots were collected individually by hand to minimize damage to the donor bed. Special care was taken to avoid damage to the belowground tissues. Intact shoots were selected and their rhizomes were trimmed with a knife to the same length. Before transplantation, the collected shoots were immersed in seawater to avoid desiccation. At the transplant site, Z. marina shoots were planted by scuba divers within 24 h after shoot collection. Eelgrass plants were hand-planted using the staple method, in which two eelgrass shoots were attached to one V-shaped metal staple and anchored to the sediment (Park and Lee 2007). Sixteen planting units were planted in each 1 × 1 m plot, and thus an initial transplant density was 32 shoots m-2. Shoot density in the reference site ranged from 82-182 shoots m-2 during the experimental periods.
After transplantation, transplants and reference plants were sampled with a 2-5-week interval for about 5 months. The measurements of the chlorophyll a fluorescence parameters including Fv/Fm, α, Ek and ETRmax were made using a Diving-PAM fluorometer at the second new leaf of both transplants and reference plants. The leaves were dark-adapted for about 6 min using leaf clips, followed by a saturating pulse, and then Fv/Fm was determined as described previously (Ralph et al. 1998, Ralph and Gademann 2005). The RLCs were measured using the pre-installed software routine, where the actinic illumination was increased in eight steps from the initial quasi-darkness (Ralph and Gademann 2005).
The RLCs of Z. marina leaves obtained from the Diving-PAM fluorometer were calculated using a default absorption factor (0.84), which is the instrument’s default value determined for terrestrial plants. Leaf absorption factor values of Z. marina were measured using the light meter of the fluorometer immediately after chlorophyll a fluorescence measurement (Beer et al. 1998). The average absorption factors for transplants and reference plants were used to calculate the ETRs.
To calculate the values of characteristic parameters of RLCs such as α, Ek and ETRmax, the RLCs were fitted to a curve, an empirical equation of Platt et al. (1980). Data were exported from WinControl into Sigmaplot 10.0 (SigmaStat, LaJolla, CA, USA) where the "Regression Wizard" was used to fit a curve to the RLCs:
where P is the photosynthetic rate (ETR) at irradiance Ed, Ps is a scaling factor defined as the maximum potential ETR, α the initial slope of the RLC before the onset of saturation, Ed the down welling irradiance (400-700 nm), and β characterizes the slope of the RLC where PSII declines (Henley 1993).
The parameters ETRmax and Ek were estimated using the following equations (Ralph and Gademann 2005):
After chlorophyll a fluorescence measurements, five transplants and five reference plants were collected for measurements of morphological characteristics.
Plant samples were rinsed with tap water and cleaned of sediments and epiphytes using a razor blade. Z. marina morphological characteristics were measured and then the Z. marina shoots were separated into leaf and belowground tissues. All the leaf tissues of each shoot were dried at about 60℃ to a constant weight.
At each sampling event, the leaf marking technique (Zieman 1974) was also applied for leaf productivity measurement. Ten to 12 haphazardly chosen shoots were marked through the bundle sheath about 3 cm above the meristem using a hypodermic needle. At the next sampling event after a period of about 3-5 weeks, the marked plants were retrieved, taken to the laboratory, cleaned as described above for biological measurements, and then all leaves were separated into old and newly produced parts and dried as also described above. Leaf productivity was measured by dividing the dry weight (DW) of the newly produced leaf parts of a shoot by the time interval (in days) since the shoot was marked.
Statistical analyses were performed using SPSS version 16.0 (SPSS Inc., Chicago, IL, USA). Data were tested for normality and homogeneity of variance to meet the assumptions of parametric statistics. If these assumptions were not satisfied, data were log transformed. Differences in Fv/Fm, α, Ek and ETRmax, shoot morphology, shoot weight and productivity among sampling times and between transplants and reference plants were tested for significance using a two-way analysis of variance (ANOVA). When significant differences were observed among the variables, the means were analyzed using the Student-Newman-Keuls test to determine where the significant differences occurred. All values were reported as the mean ± standard error.
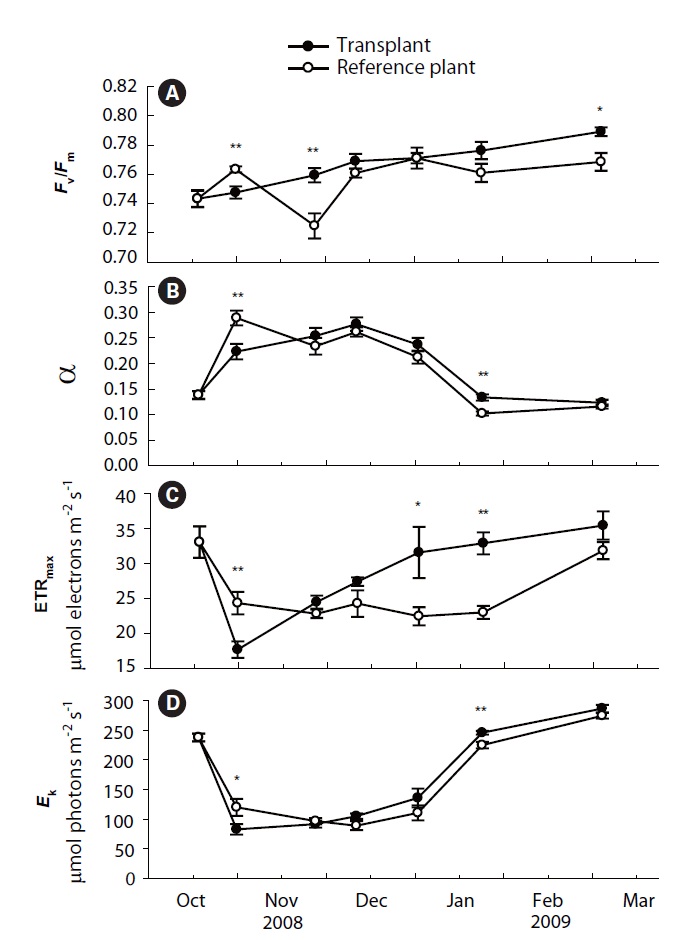
Values of Fv/Fm, α, ETRmax and Ek of transplants and reference plants varied significantly over time (all p < 0.001), and significant differences were also found in these measurements between transplants and reference plants except for α (Table 1, Fig. 2). Fv/Fm of transplants increased steadily during the study period, ranging from 0.74 ± 0.01 to 0.79 ± 0.00, while that of reference plants fluctuated over time, ranging from 0.72 ± 0.01 to 0.77 ± 0.00 (Fig. 2A). At the first sampling event after transplantation, Fv/Fm value of transplants was significantly lower than that of reference plants (p < 0.01), then it increased and became comparable to, or even higher than that of reference plants from the second sampling event (Fig. 2A).
Photosynthetic efficiency (α) of both transplants and reference plants showed significant (p&;lt;0.01)temporal variations, ranging from 0.12 ± 0.01 to 0.28 ± 0.01 for transplants and from 0.10 ± 0.00 to 0.29 ± 0.01 for reference plants (Fig. 2B). Comparing with reference plants, α of transplants was also reduced at the first sampling event after transplantation, being significantly lower than that of reference plants (p < 0.01). However, the α of transplants also became comparable to, or even higher, than that of reference plants from the second sampling event (Fig. 2B). ETRmax and Ek, also showed significant (p < 0.01) temporal variations (Fig. 2C & D). ETRmax ranged from 17.7 ± 1.2 to 35.4 ± 2.0 μmol electrons m-2 s-1 for transplants, and from 22.4 ± 1.3 to 33.0 ± 2.3 μmol electrons m-2 s-1 for reference plants, whereas Ek ranged from 83.0 ± 8.8 to 286.6 ± 6.4 μmol photons m-2 s-1 for transplants, and from 89.2 ± 7.5 to 274.4 ± 4.7 μmol photons m-2 s-1 for reference plants. At the first sampling event after transplantation, the measurements of ETRmax and Ek of transplants were also significantly lower than those of reference plants (p < 0.01 and p < 0.05 for ETRmax and Ek, respectively) (Fig. 2C & D). Similarly, values of ETRmax and Ek of transplants also became comparable to, or even higher than those of reference plants from the second sampling event (Fig. 2C & D).
Significant differences were found in the number of leaves, shoot height and leaf productivity among sampling times (all p < 0.001), but not in the leaf DW per shoot (p = 0.178) (Table 2, Fig. 3). Two-way ANOVA also showed that significant differences were found in shoot height (p = 0.017), but not in the three other measurements between transplants and reference plants throughout the study period (Table 2). The number of leaves in transplants and reference plants increased over time, ranging from 4.6 ± 0.3 to 6.0 ± 0.2 leaves shoot-1 for transplants and from 4.7 ± 0.2 to 6.5 ± 0.3 leaves shoot-1 for reference plants (Fig. 3A). Highest values of shoot height of both transplants and reference plants occurred in early December of 2008 (i.e., 75.3 ± 2.4 and 83.7 ± 1.8 cm for transplants and reference plants, respectively), whereas lowest values of shoot height occurred in late October 2008 (58.0 ± 1.7 cm) for transplants and at the beginning of the study period (58.1 ± 1.7 cm) for reference plants (Fig. 3B). Leaf weight of both transplants and reference plants varied greatly over time, but no clear changing pattern was found (Fig. 3C). Leaf weight was highest in March 2009 for transplants (1.11 ± 0.04 g DW shoot-1) and in November 2008 for reference plants (1.07 ± 0.09 g DW shoot-1), and lowest in later October 2008 for transplants (0.76 ± 0.05 g DW shoot-1) and in January 2009 for reference plants (0.84 ± 0.09 g DW shoot-1) (Fig. 3C).
Contrary to the other measurements, leaf productivity continuously decreased in both transplants and reference plants during most of the study period, with only a slight rise at the last sampling event (Fig. 3D). Highest values of leaf productivity of both transplants and reference plants occurred in November 2008 (16.5 ± 0.8 and 21.6 ± 0.8 mg DW shoot-1 day-1 for transplants and reference plants, respectively), whereas the lowest values occurred in January 2009 (11.2 ± 0.7 and 10.0 ± 1.8 mg DW shoot-1 day-1 for transplants and reference plants, respectively).
Seagrass shoot morphology and growth usually exhibit seasonal and spatial variations, and, thus, measurements of transplants should be compared with those of reference plants for assessment of the establishment success of transplants (Fonseca et al. 1996, Balestri et al. 1998, Peralta et al. 2003, Tanaka and Nakaoka 2004, Evans and Short 2005, Lee and Park 2008). When transplanting seagrasses, seagrass leaves may be broken, and may also occasionally be exposed to air, hence the photosynthetic performance of transplants decreases during the initial period of transplantation (Seddon and Cheshire 2001, Lan et al. 2005, Horn et al. 2009). In this study, we measured the shoot morphology, leaf weight and growth of transplants and reference plants, as well as their photosynthetic parameters. Significant reductions were observed in all the four measurements of photosynthetic parameters of transplants during the first sampling event after transplantation. Decrease in Fv/Fm was reported in several seagrass species when seagrass was transplanted into shallower sites, which are probably induced by the increased irradiance (Figueroa et al. 2002, Durako et al. 2003, Horn et al. 2009). Irradiance-induced decreases in Fv/Fm are thought to reflect dissipation of excess energy within the light-harvesting antennae or photodamage to PSII (Ralph and Burchett 1995). Ek, α and ETRmax are also thought to be related to environmental irradiance (Ralph and Gademann 2005, Campbell et al. 2007). Reduction in α can occur due to environmental stresses such as high irradiance (Cullen et al. 1988, Bruhn and Gerard 1996). ETRmax and Ek can be reduced by high irradiance or UVtreatment (Bischof et al. 2000, Villafane et al. 2004, Becker et al. 2009). In this study, shoot density in the transplant site was much lower than that of reference population. Lower shoot density can result in higher irradiance condition in transplant site and, consequently, induce the reductions in these photosynthetic parameters. However, these photosynthetic measurements increased and became higher than those of reference plants after a period of time when the shoot density of transplants did not significantly changed. Thus, the reductions in the photosynthetic parameters could not be ascribed to a higher irradiance in the transplant site. Transplant shock might also have played a role in the reductions of photosynthetic parameters (Horn et al. 2009).
Values of the four measurements of photosynthetic parameters of transplants became comparable to, or even higher than, those of reference plants from the second sampling event after transplantation. Increases in the photosynthetic parameters probably imply that photosynthesis of transplants had recovered from transplanting shock after about one month since transplantation (Horn et al. 2009). Shoot height, leaf DW and leaf productivity of transplants were also significantly reduced during the initial period after transplantation, which might also be due to the transplant shock (Lepoint et al. 2004, Evans and Short 2005). However, shoot morphology and productivity took longer time to increase to the levels of reference plants than the chlorophyll a fluorescence parameters. Thus, the transplant recovery time obtained from chlorophyll a fluorescence measurements was different from that obtained from shoot morphology and productivity measurements. Transplant recovery time was about 2.5 months through measuring transplant morphology, leaf weight and growth, while it was only about 1.0 month through measuring the chlorophyll a fluorescence parameters. The recovery time of Z. marina transplants in this study was similar to those obtained by Park and Lee (2007) (1.0-3.7 months) and Evans and Short (2005) (3.0 months), but less than those obtained in other studies (6.0-12.0 months) (Zimmerman et al. 1995, Orth et al. 1999, Fishman et al. 2004). In Posidonia sinuosa transplants, a similar recovery time of 1.0-2.0 months was also reported through comparing ETRmax measurements of transplants and reference plants (Horn et al. 2009).
Recently, chlorophyll fluorescence has been widely used to examine the photosynthetic performance of plants in response to a variety of environmental stresses (Figueroa et al. 2002, Adams and Demmig-Adams 2004, Campbell et al. 2006, Koch et al. 2007, Kahn and Durako 2009). Chlorophyll a fluorescence parameters were also used to assess the photosynthetic recovery of Posidonia sinuosa transplants (Horn et al. 2009). In this study, we assessed the establishment of Z. marina transplants through measuring the chlorophyll a fluorescence parameters as well as the morphology and growth of both transplants and reference plants. When morphological characteristics and growth are used to assess establishment success of seagrass transplants, we need to use destructive sampling method, which may be harmful to the seagrass meadows. Additionally, these methods will take a certain time (e.g., productivity measurement usually takes about several weeks). However, chlorophyll a fluorescence parameters can be measured in situ by scuba divers using a Diving-PAM fluorometer (Ralph et al. 1998, Campbell et al. 2003, Horn et al. 2009). It takes only hours for measuring the chlorophyll a fluorescence in the field and then we can analyze the data for assessing the physiological status of transplants and reference plants. Therefore, the measurement of chlorophyll fluorescence of seagrass leaves using the Diving-PAM fluorometer is a non-destructive and time-effective method that can be used to assess the establishment success of seagrass transplants.