Chaetoceros Ehrenberg, 1844, is the largest and most species-rich genus of marine planktonic diatoms (Rines and Hargraves 1988). To date, approximately 400 species of Chaetoceros have been morphologically described (Hasle and Syvertsen 1997). Some species are responsible for marine algal blooms. High concentrations of Chaetoceros cells may clog the gills of farmed fish and the spiny Chaetoceros setae can penetrate the gill tissue (Rensel 1993). These environmental and economically important effects have spurred many studies on Chaetoceros, which have improved the understanding of their biology, systematics, and ecology (Rensel 1993, Rines and Theriot 2003). In taxonomic and environmental monitoring purposes, discrimination of Chaetoceros species is generally achieved by microscopic observations, considering certain morphological characters such as forms of the chains, shapes of the aperture, and shapes of the valves. Particularly, the fine structures of the diatoms, including Chaetoceros, are observed with scanning electron microscopy. However, it is often very difficult to distinguish between Chaetoceros species (von Quillfeldt 2001) because of small size and their morphological similarity, and they can exhibit morphological changes under different culture conditions. In addition, morphological identification demands specialized in-depth knowledge.
DNA-based molecular tools are sometimes very effective for the species discriminations of microscopic-size organisms like diatoms (e.g., Jung et al. 2010). Recently, the concept of DNA barcoding was introduced to diatom taxonomy (Evans et al. 2007, Kaczmarska et al. 2007). The promise of DNA barcoding is based on a small DNA fragment divergence coinciding with biological species separation (Moniz and Kaczmarska 2009). Several pioneer studies on the diatom barcoding were performed with several molecular markers such as nuclear ribosomal DNA (rDNA), chloroplast rbcL, and mitochondrial cox1 gene (Evans et al. 2007, Moniz and Kaczmarska 2009, 2010). Also, many DNA-based studies have been done with regard to the evolutionary history and phylogenetic relationships of diatoms (Damste et al. 2004, Alverson et al. 2007, Choi et al. 2008).
Of the molecular markers used in taxonomic studies, nuclear rDNA in eukaryotes is typically composed of tandem arrays of a basic unit that contain the transcription unit (e.g., 18S, 5.8S, 28S) and an intervening intergenic spacer region. The different subunits and regions of the rDNA locus have different degrees of sequence variability and varying suitability for comparison at the inter-generic or inter-species level. Recent data indicated that nuclear rDNA is a suitable molecular marker for DNA-based taxonomy or DNA barcoding of diatoms (Alverson et al. 2007, Evans et al. 2007, Kaczmarska et al. 2007, Moniz and Kaczmarska 2009, 2010, Jung et al. 2010). However, DNA-based discriminations should be carefully applied to the strongly diversified diatoms considering their molecular divergences of the rDNA, because they are variable according to different rDNA molecules and taxonomic categories (e.g., Jung et al. 2010). For example, the centric diatoms Cyclotella and Discostella show high divergences of both 18S and 28S rDNA (Jung et al. 2010), while their close relative diatom Stephanodiscus shows highly conserved 18S rDNA sequences within this genus, indicating the non-suitability of the 18S rDNA for their DNA taxonomy (Ki 2009). Taking this into account, it is necessary to evaluate genetic divergences of individual rDNA locus according to taxonomic categories, particularly at the generic level. In the case of Chaetoceros, although their morphological phylogenetic relationships have been studied (Rines and Theriot 2003), few studies on the molecular phylogeny have been attempted to date. Most studies have been carried out through broader diatom phylogenetic analyses (Damste et al. 2004, Choi et al. 2008). Also, little is known of the genetic divergences of Chaetoceros rDNA for DNA taxonomy.
In the present study, we characterized molecular characteristics including genetic divergences and DNA similarity of the 18S-28S rDNA sequences from several selected Chaetoceros. In addition, phylogenetic and statistical analyses were performed to evaluate the usefulness of the 18S and 28S rDNA for the DNA taxonomy of Chaetoceros.
In this study, a total of 32 rDNA sequences from Chaetoceros were used for the extensive analyses. The 18S rDNA sequences were determined from eight Chaetoceros species: C. calcitrans (GenBank accession numbers AY485449, AY625894, EU240879, EU240880), C. curvisetus (AY229895), C. debilis (AY229896), C. gracilis (AY625895), C. muellerii (AY485453, AY625896), C. neogracile (EU090012), C. rostratus (X85391), and C. socialis (AY485446). The partial 28S rDNA were from twelve Chaetoceros species: C. atlanticus (EF423454), C. brevis (EF423469), C. compressus (EF423429), C. costatus (EF423471-4), C. curvisetus (EF423476-7), C. danicus (EF423447), C. debilis (EF423466), C. diadema (EF423433), C. lorenzianus (EF423435-6), C. peruvianus (EF423449), C. pseudo-curvisetus (EF423478-9), and C. socialis (EF423467-8).
Intra-specific genetic variations of Chaetoceros were investigated by comparing DNA similarities and genetic distances of both 18S and partial 28S rDNA sequences. For the extensive analyses, we constructed two data matrixes of the selected 18S and 28S rDNA sequences. These contained eight sequences for 18S and twelve sequences for 28S. Multiple alignments were performed with each dataset using the Clustal W 1.8 (Thompson et al. 1994). The aligned sequences were trimmed at each end to the same length and obvious base errors that were only found in single strands were manually removed. Finally, we used identical positions (e.g., 1,706 out of 1,815 alignment positions for 18S; 757 out of 800 for 28S) of the aligned sequences. DNA similarities of the 18S-28S rDNA were measured separately in BioEdit version 5.0.6 (North Carolina State University). The corrected pairwise (p-) genetic distances were calculated with Kimura 2-parameter model in MEGA 4.0 (Tamura et al. 2007). Sequence characteristics, including parsimony informative (PI) site, were analyzed using MEGA version 4.0. Statistical analyses of the nucleotide comparisons were performed using SPSS version 10.0.7 (SPSS Inc., Chicago, IL, USA).
For the phylogenetic analysis of Chaetoceros, DNA sequences were aligned in the same way used in the sequence comparisons, and unambiguously aligned sequences for the phylogenetic analyses: 1,706 out of 1,806 alignment positions for 18S, and 652 out of 806 for 28S, respectively. As best-fit models for the present 18S, 28S datasets, the General Time Reversible plus Gamma distributed model (GTR+G) was selected for 18S (- lnL = 5046.1) and for 28S (- lnL = 3933.2) from the Akaike Information Criterion in MrModeltest2 (Nylander 2004). Bayesian analysis of the 18S rDNA was implemented in MrBayes version 3.1.2 (Huelsenbeck and Ronquist 2001) using the selected GTR+G model with among-site rate variation, while the rates for variable sites were drawn from a gamma distribution. The Markov chain Monte Carlo process was set at two chains, and a million generations were conducted. Sampling frequency was assigned as every 100 generations. After analysis, the first 2,000 trees were deleted as burn-in and the consensus tree was constructed. For 28S rDNA tree, Bayesian analysis was performed in the same way using the 18S sequences.
In this study, we characterized nuclear 18S and 28S rDNA sequences of Chaetoceros using available DNA sequences (12 sequences of 18S and 20 sequences of 28S) obtained in the public databases. These included nearly complete 18S rDNA sequences and partial 28S rDNA. Particularly, the 28S rDNA, the largest rDNA coding region, contains relatively conserved core segments and 12 hypervariable, divergent (D) domains (Hassouna et al. 1984). The present 28S data contained 28S rDNA D1 to D3 and their adjacent partial core regions.
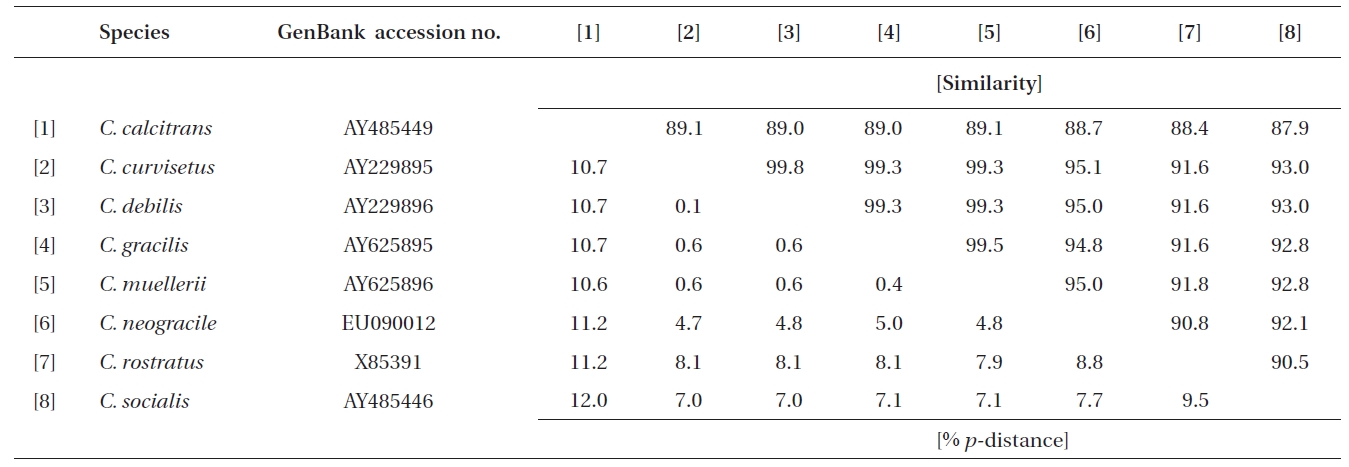
Genetic variations in the rDNA of Chaetoceros intra-species were investigated with the DNA similarity scores. Mostly, high DNA similarities were measured from individual 18S and partial 28S comparisons within the same species (more than 99% similarity). For example, C. calcitrans, including C. calcitrans f. pumilus, had nearly identical genotypes of the 18S rDNA (99.9 ± 0.1% similarity) among four different isolates, and C. muellerii showed 99.8% similarity between CCMP 1316 (GenBank accession number AY485453) and CCAP 1010/3 (AY625896), respectively. Also, we detected high DNA similarity in comparisons of the intra-species 28S rDNA. At present, we detected few genetic variations in the rDNA of intraspecies; however, the present data are quite limited and so generalization should not be done. Further studies are needed to determine the nucleotide sequences of the rDNA of increased number of samples, collected worldwide from different geographical regions.
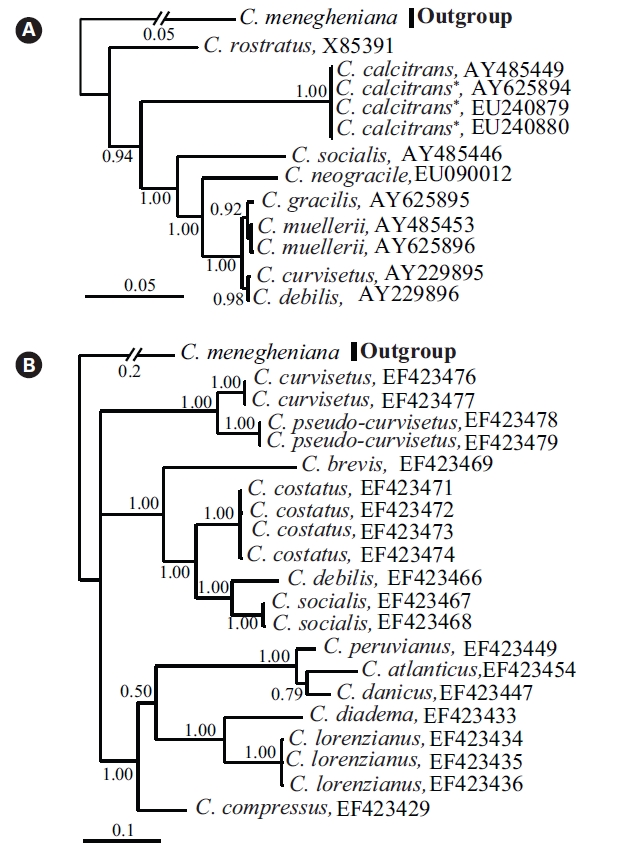
Bayesian trees with the 18S-28S rDNAs showed Chaetoceros spp. studied here were divided according to their taxonomic positions (Fig. 1). In cases of the same species, they formed single clusters (e.g., C. calcitrans, C. costatus, C. muellerii, C. lorenzianus, and C. socialis), which were separate from other species. These were in accordance with the intra-species rDNA comparisons, in which Chaetoceros has the different genotypes of the 18S-28S rDNA among inter-species, but have nearly identical genotypes of the rDNA among intra-species (e.g., C. calcitrans, C. muellerii, C. costatus). The 18S tree (Fig. 1A) showed that C. rostratus formed the early divergent species (1.00 posterior probability [PP]). C. gracilis and C. muellerii as sister species formed a clade with C. curvisetus and C. debilis (1.00 PP). The two later species were not separated by our 18S phylogenetic analysis. On the other hand, the 28S Bayesian tree (Fig. 1B) separated individual species more clearly with long-branches compared with the present 18S rDNA phylogeny. The 28S Bayesian tree showed that Chaetoceros formed a polytomy (1.00 PP), in which species were separated into three clades: one cluster contained with C. curvisetus and C. pseudo-curvisetus, another included C. costatus, C. debilis, and C. socialis, and the other included C. atlanticus, C, diadema, C. brevis, and C. lorenzianus.
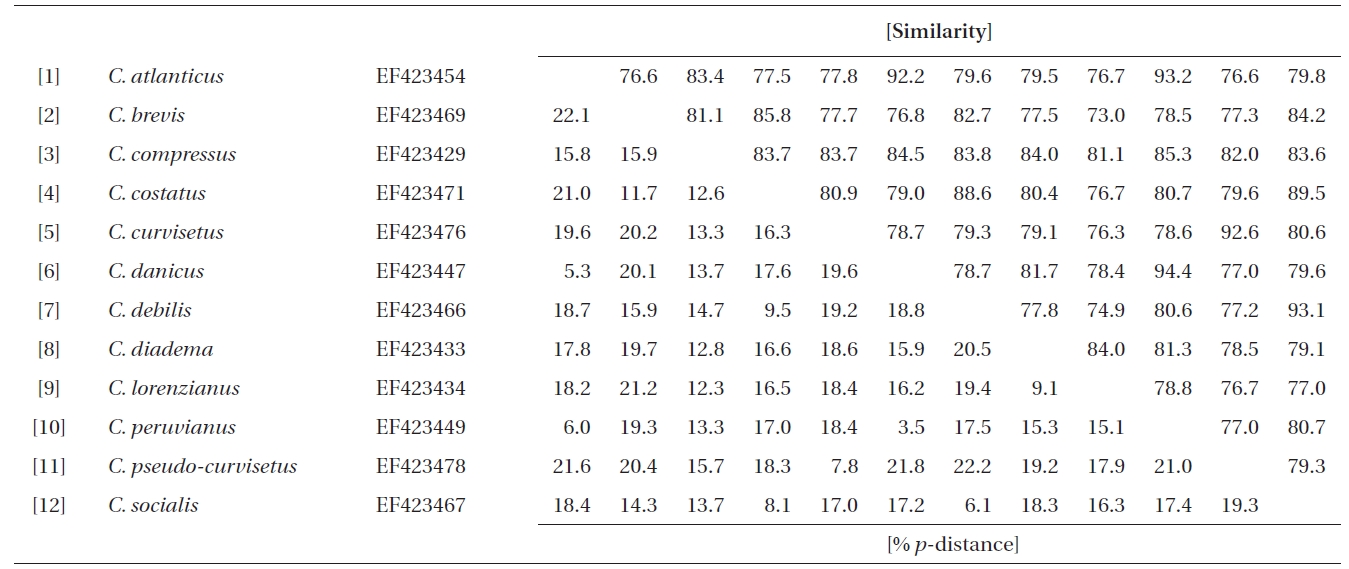
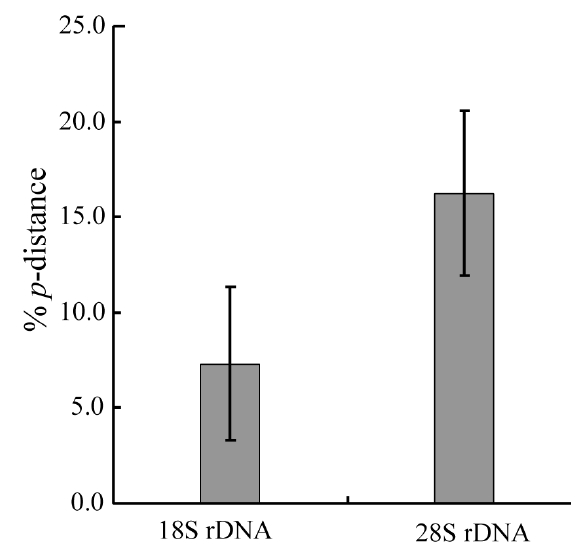
Molecular comparisons and phylogenies showed that sequence variations in the 18S and 28S rDNA within intra-species were not significantly different (Student’s t-test, p > 0.05). Thus, we selected different Chaetoceros (e.g., eight for 18S rDNA; twelve for 28S rDNA) to extensively compare one another. Table 1 summarizes the DNA similarity and corrected p-distance scores between the eight pairs of aligned 18S rDNA sequences. DNA pairs of C. curvisetus, C. debilis, C. gracilis, and C. muellerii were recorded at high DNA similarities (> 99%, or < 0.6% p-distance), indicating that they could not be separated by the 18S rDNA divergences; however the other pairsFig. 2. Nucleotide divergences of Chaetoceros 18S and 28S rDNAs based on corrected p-distances. Values of the p-distances were measured at 7.3 ± 4.01 (n = 36) for 18S and at 16.2 ± 4.34 (n = 66), respectively. showed relatively low similarities (< 95%, or > 4.8% p-distance). On the other hand, the Chaetoceros 28S rDNA showed high genetic divergences in the present analysis. Table 2 displays the DNA similarity and p-distance scores among the 12 compared species. In most cases, DNA divergences were considerably high in the 28S rDNA (81.0 ± 4.6% similarity). The highest similarity (94.4%) was recorded between C. danicus and C. peruvianus, and the lowest (77.2%) was recorded between C. devilis and C. pseudo-curvisetus.
In addition, comparative analysis showed that corrected p-distances of the 18S and 28S rDNAs were 7.3% and 16.3%, respectively (Fig. 2), based on pairwise genetic distance scores (Tables 1 & 2). Statistical testing revealed that divergences of the 28S rDNA were significantly different compared to the 18S rDNA (Student’s t-test, p < 0.05). In further analysis, we found that the 28S rDNA contained more PI sites (28.6%) than 18S rDNA (11.0%). The 28S variation was approximately 2.60-times higher than that of the 18S as judged from the % PI values, and it was also 2.23-times by p-distance in the present data sets. These statistical, parsimonious results showed that the 28S rDNA D1-D3 (> 3.5% p-distance, > 5.4% dissimilarity) had a much greater genetic divergence than the 18S rDNA (> 0.4% p-distance, > 0.5% dissimilarity). These results were generally in accordance with other centric diatoms, Cyclotella, Discostella, and Stephanodiscus (Ki 2009, Jung et al. 2010). These results suggest that the 28S rDNA may be treated as a more suitable marker for species- level taxonomic distinctions of Chaetoceros.