Mass growth of macroalgae in shallow coastal waters is one of the most conspicuous results of eutrophication (Valiela et al. 1997, Nelson et al. 2008). Seagrass decline caused by green macroalgal blooms occurs throughout the world. These extensive mats formed by ephemeral green macroalgae such as
The principal negative effect of
Due to the complex interaction of green-tide forming macroalgae and surrounding environments such as sediment characteristics, composition of plant and fauna, and nutrient cycles within the seagrass beds, it is important to understand which variables control macroalgal abundance and regulate the initiation of macroalgal blooms. The objective of this study was to identify 1) the salinity effect on growth, nutrient uptake and internal nutrient content of
Thalli of
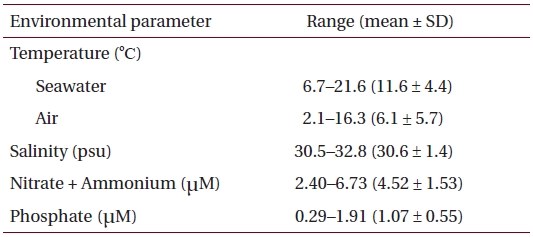
Physico-chemical parameters recorded for six months (October 2001 to March 2002) prior to sample collection in eelgrass beds at Haenam, southwestern coast of Korea
Sample disks for growth and nutrient uptake measurements were obtained by cutting the adult thalli with a 22 mm cork borer and allowing samples to recover from wound-induced respiration. Fresh Ulva has a diffuse pattern of growth, so samples were randomly cut from each thallus. Samples were assessed after collection for photosynthetic yield with a Diving-PAM (Waltz, Effeltrich, Germany), and tissue samples were analyzed for chlorophyll-a, nitrogen (N) and phosphorus (P) levels. Before growth and nutrient uptake were measured, disks were incubated for two days in water from the sampling site to allow adaptation to laboratory conditions. Samples were maintained in a low concentration medium (below 1.34 μM of nitrate and 0.64 μM of phosphate) and were allowed to adapt over three days. At the beginning of the experiment, a nutrient solution (30 μM-N and 8 μM-P) was added to the culture vessel. After waiting 12 h to establish chemical equilibrium, thallus disks were put into the vessel. This condition was confirmed as optimal in a preliminary study, such that the N : P atomic ratio of this condition is approximately 4.67.
>
Growth, nutrient uptake, chlorophyll-a and tissue nutrient analyses
Growth rates under various salinity conditions were measured every 2-3 days for the 7-day experimental period. The disk area was determined using a ruler and replaced in the new medium aquaria for avoiding from depletion of nutrient. Before changing new medium aquaria, water samples were collected to determine changes on nitrate and phosphate concentrations were collected. The specific growth rate (μ) was calculated using the equation: μ= ln (Lt / Lo) / (t2-t1), where t is the time in days, Lo is the initial area and Lt is the area on day t. Nutrient uptake was calculated from concentrations between sampling intervals, as μM g FW h-1. Chlorophyll-
Inorganic nitrogen (NO3--N) and reactive phosphorus (PO43--P) levels were determined using standard colorimetric methods described in Grasshoff et al. (1983). Disk samples were dried at 60oC to a constant dry weight and then ground in a mill (Fritsch, Analysette, Idar-Oberstein, Germany) in order to determine levels of primary elements (C, N and P). The carbon and nitrogen contents of powdered plant tissue were measured with an elemental analyzer (EA1110CHNS-O; CE Instruments, Milan, Italy). Phosphorus content was measured using alkaline persulfate digestion (D’Elia et al. 1977) followed by a standard colorimetric phosphate determination of the digested solution (Grasshoff et al. 1983).
>
Chlorophyll fluorescence measurements
In vivo induced chlorophyll a fluorescence was determined with a portable pulse amplitude modulated fluorometer (Diving-PAM; Waltz, Effeltrich, Germany). Effective quantum yield (ΔF/Fm’ ) of photosystem II were calculated as (Fm’-F)/Fm’, where F is fluorescence yield of the light-adapted sample and Fm’ is the maximum light-adapted fluorescence yield when a saturating light pulse of 800 ms duration (intensity ? 3,000 μmol photons m-2 s-1) is superimposed on the prevailing environmental light levels (Schreiber and Bilger 1993).
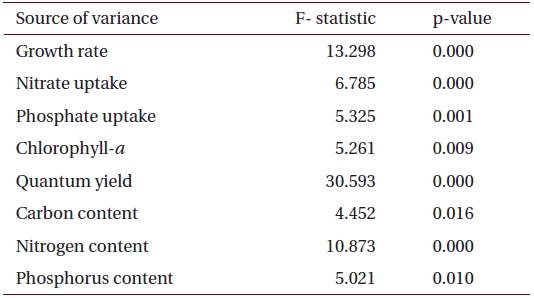
A one-way ANOVA was used to examine the impact of salinity on growth rate, nutrient uptake and concentration of internal elements in the tissue of
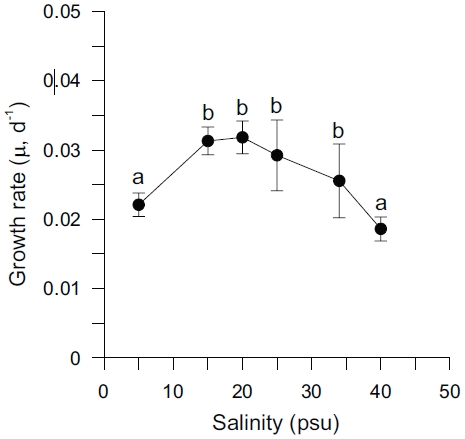
Specific growth rates (μ) of Ulva varied between 0.019 and 0.032 d-1 and were significantly affected by salinity levels (p < 0.001) (Table 2). Growth rates of

Summary of the analysis of variance (one-way fixed ANOVA) for the effects of salinity on various factors including growth rate, chlorophyll-a, nutrient uptake and tissue nutrient content in U. pertusa from eelgrass beds at Haenam (n = 6)
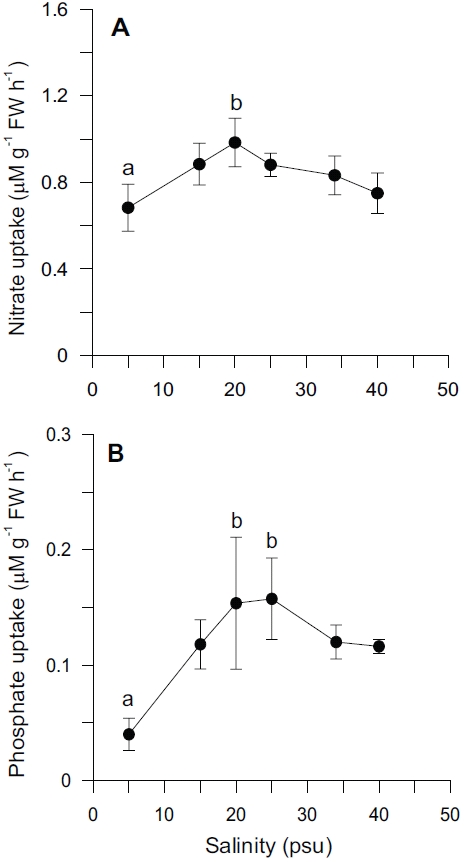
Nutrient uptake by
>
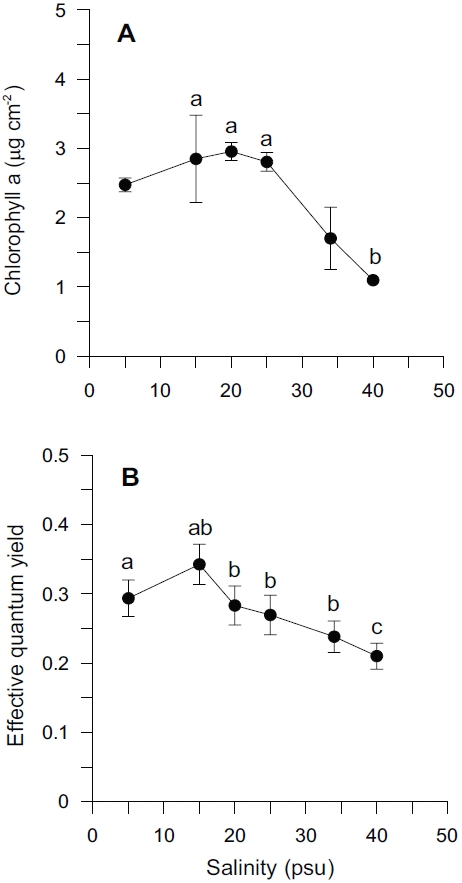
Chlorophyll-a content and photosynthetic quantum yield
Chlorophyll-a content and effective quantum yield of Ulva in our experimental treatment had a similar pattern to growth rate (Fig. 3). Over the range of salinity, the mean chlorophyll-a content was 2.31 ± 0.85 μg cm-2. Chlorophyll-a content varied between 1.10 and 2.96 μg cm-2 with changing salinity levels (Fig. 3A). Effective quantum yield (ΔF/Fm’ ) ranged from 0.21 to 0.34 (Fig. 3B). The highest content of chlorophyll-a was observed at the highest growth rate, 20 psu, while effective quantum yield was highest at 15 psu. Chlorophyll-a contents were less at higher salinities. Effective quantum yield was also less at higher salinities. Effective quantum yield suggested that Ulva samples grown in lower salinity were photosynthetically active. There was a sharp drop at higher salinities (> 25 psu) in chlorophyll-a content, also a sharp decrease with higher salinities (> 15 psu) in the effective quantum yield.
Salinity levels significantly affected both chlorophyll-
>
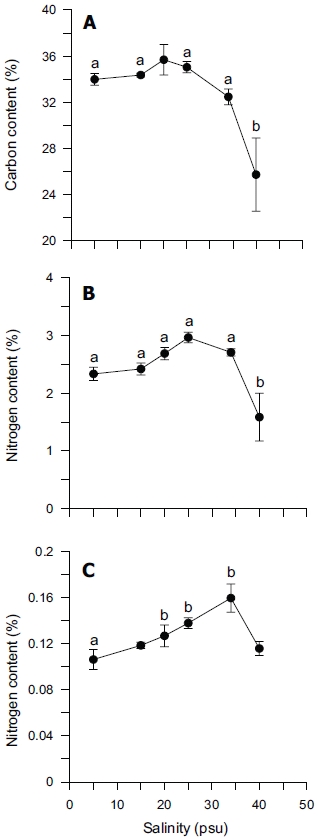
Tissue carbon, nitrogen and phosphorus
Tissue nitrogen content ranged from 1.6 to 3.0% N (dry weight) (Fig. 4B), whereas tissue phosphorus ranged from 0.11 to 0.16% P (dry weight) (Fig. 4C). Tissue carbon ranged from 25 to 35% C (dry weight) (Fig. 4A). The atomic C : N ratio in the tissue of
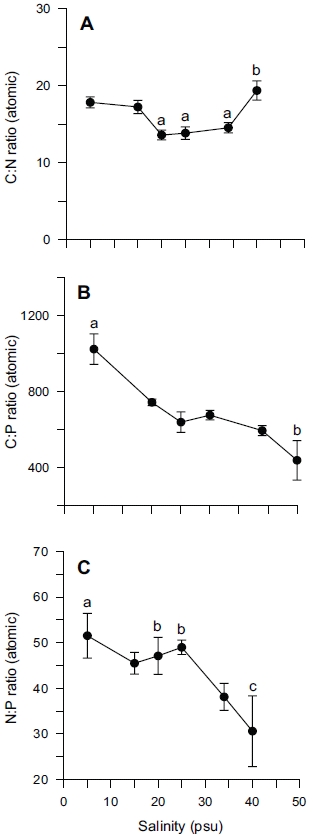
ANOVA results on the effect of salinity on internal nutrient content are given in Table 2. Tissue C, N and P contents were all significantly different (p < 0.05, p < 0.001 and p < 0.01, respectively). A Tukey’s multiple range test of carbon and nitrogen content means showed that carbon content at 40 psu was significantly lower than those at 5, 15, 25 and 34 psu (Tukey tests, p < 0.05) (Fig. 4A), and nitrogen content at 40 psu was significantly lower than those at 5, 15, 20, 25 and 34 psu (Tukey tests, p < 0.05) (Fig. 4B). Tissue phosphorus contents at 20 and 34 psu were significantly higher than those at 5 psu (Tukey tests, p < 0.05) (Fig. 4C). Based on multiple comparisons among the levels of salinity, the C : N ratios at 20, 25 and 34 psu were significantly lower than those at 40 psu (Tukey tests, p < 0.05) (Fig. 5A), whereas C : P ratios at 5 psu were significantly higher than those at 40 psu (Tukey tests, p < 0.01) (Fig. 5B). The N : P ratios at 20 and 25 psu were significantly lower than those at 5 psu (Tukey tests, p < 0.05), and significantly higher than that at 40 psu (Tukey tests, p < 0.05) (Fig. 5C).
>
Growth rate and nutrient uptake
The results of these experiments suggest that under non-limiting nutrient and light conditions within a salinity range from 5 to 40 psu, that Ulva shows higher growth rates within the salinity range of 15 to 25 psu, with an optimum between 15 and 20 psu. Growth was decreased by low salinity and also at salinities greater than 25 psu (Fig. 1). These results may reflect low tolerance of this species to extremely reduced or raised salinity. Both higher and lower optimal salinities have been reported for various Ulva species (e.g., 25 psu for U. fasciata; Morand and Briand 1996 and U. pertusa; Floreto et al. 1994, and 35-40 psu for U. rigida; Zavodnik 1975). Also, the enhancement of growth rates at lowered salinity (17-22 psu) on Enteromorpha species has previously been reported (Martins et al. 1999). Increased growth rate at reduced salinity has also been reported for marine microalgae (Craggs et al. 1994) and some brown algae (Gordillo et al. 2002). However, reduced salinity often inhibited the growth of marine macroalgae by limiting branching (Norton et al. 1981). Also, growth of marine macroalgae is usually reduced in hypersaline water, because of both cumulative enzyme effects, and reduced turgor pressure, which inhibit cell division (Lee and Liu 1999).
Ulva species have been dominant in some estuaries throughout the year, suggesting that those species may be euryhaline. Some studies suggest that other green macroalgae, e.g., Enteromorpha, are more tolerant of reduced or elevated salinity than Ulva (Martins et al. 1999). In contrast, U. lactuca in culture was more tolerant of hyper-than hyposalinity (Murthy et al. 1988). U. rotundata in the field has been growing in salinities ranging from 26 to36 psu (De Casabianca 1989), and U. rigida bloomed in summer when salinity remained above 20 psu (Fillit 1995). The effect of salinity on Ulva and Enteromorpha remains controversial. However, our results show that salinity is more important than other environmental factors on the initiation of Ulva bloom in eelgrass beds, especially in the rainy season (late spring-early summer).
When exposed to changes in salinity, most intertidal algae appear to utilize a complex set of physiological and biochemical mechanisms in order to acclimatize to fluctuating salinities in their habitat (Lobban and Harrison 1994). It is known that maintenance of constant cell turgor by changing osmotic potential is a typical tolerance mechanism in marine algae exposed to salinity changes (Kirst 1990). The adjustment of osmotic potential can be achieved by changes in the concentration of internal inorganic ions and organic osmolytes (Liu et al. 2000). It is known that proline accumulates in microalgae in response to stresses such as salinity (Lee and Liu 1999).
In our experiment, nitrate and phosphate uptake of Ulva were greater in intermediate levels of salinity (20 and 25 psu) (Fig. 2). These results correspond with growth rate and indicate that Ulva species growing in eelgrass beds are well acclimated to lower salinities. Macroalgae may occasionally respond to a temporal imbalance between growth and nutrient uptake during subsequent periods of low external nutrient supply (McGlathery et al. 1996). In a steady state, the removal of nutrients from ambient water would correspond to the incorporation into new algal biomass. Such uncoupling of growth and nutrient uptake has been demonstrated for several species of macroalgae on seasonal and diurnal time scales (Rosenberg and Ramus 1982, Trimmer et al. 2000). Uptake rates for phosphate increased more rapidly than for nitrate at lowered salinities range from 5 to 20 psu (Fig. 2). This in turn corresponded to a decreased N : P ratio with higher salinities (Fig. 5C). Thus, the effect of salinity on nitrate uptake was stronger than on phosphate uptake, especially at lower salinities. Gordillo et al. (2002) pointed out that nitrate uptake for brown algae was more reduced than phosphate uptake at low salinities. The N : P ratio for uptake rates ranged from 12.4 (25 psu) to 37.7 (5 psu) (data not shown). Accordingly, a higher utilization of internal nitrogen than of internal phosphorus reserves to synthesize organic components by the Ulva could be responsible for the lower N : P ratio for internal tissue contents than for uptake rates (Fig. 5C).
Adaptation of Ulva to a wide-range of salinity regimes is important in an intertidal and estuarine environment characterized by periodic exposure to air by tide and inflow of freshwater (Kamer and Fong 2000). Both a decrease and increase of salinity resulted in reduced algal productivity and biomass. It coincided with a decreased chlorophyll-a content and effective quantum yield (Fig. 3). Reductions in photosynthetic rate are indicative of some stress to the photosynthetic system or other factor involved in the photosynthetic process. Chlorosis occurred during the experiment at both high (≥ 34 psu) and low salinity levels (≤ 5 psu), indicated by thylakoid destruction (Liu et al. 2000). Reduced chlorophyll-a content might be one factor causing the reduction in photosynthetic rate.
Similar responses were shown between growth rate and effective quantum yield as a function of salinity treatment (Figs 1, 3B). Depression or inhibition of algal photosynthesis occurred under low- and high-salinity levels, which may be related to the degree of tolerance or adaptation to salinity. Several studies have found a sharp drop in photosynthetic rate for several marine macroalgae including U. lactuca at lower salinities , and this has been linked to an effect of carbon supply (CO2 and HCO3) (Rivers and Peckol 1995). The reduction of photosynthesis may have been due partly to inhibition of individual enzymes, such as RuBisCO, but it also could be due to structural/mechanical effects (Lobban and Harrison 1994).
The carbon, nitrogen and phosphorus content of algal tissue is related to ambient nutrient conditions and uptake prior to sample collection, and likely provide a more reliable indication of nutrient status (Wheeler and Bjornsater 1992, Gordillo et al. 2002). Also, the primary element content of Ulva was affected by salinity. In the seagrass bed, nutrients previously bound to macrophytes become available for phytoplankton and opportunistic macroalgal growth (Sfriso and Marcomini 1997). The consequence of this nutrient flux is a structural change in the ecosystem, from a grazer controlled system to a detritus/mineralization system, where the turnover of oxygen and nutrients is much more dynamic (Lavery et al. 1991). Frequently, the occurrence of such collapses also contributes to a decrease in the biodiversity of the area (Everett 1994).
In our study, carbon and nitrogen content of Ulva was not significantly different from 5 to 34 psu, but significantly decreased at 40 psu (Figs 4A & B). However, phosphorus content was significantly higher at 20, 25 and 34 psu than at 5 psu (Fig. 4C). Usually, nitrogen content in the tissue of macroalgae is related to chlorophyll-a content. However, our results did not show a close correlation between nitrogen content and chlorophyll-a content (r2 = 0.4936). Chlorophyll-bound N typically changes in response to macroalgal N status, but because this pool represents < 2% of total thallus N, it does not contribute significantly to N storage (McGlathery et al. 1996).
A C : N ratio of 7-15 : 1 has been reported for U. lactuca in a fishpond, and 9-16 : 1 for U. rigida in the field (Rivers and Peckol 1995). Our range, 13-19 : 1 for C : N ratio was higher than those ratios (Fig. 5A), however this may be because this was a laboratory culture experiment. Fong et al. (1996) suggested that differential salinity tolerances and N requirements might determine the pattern of succession for dominant macroalgae in coastal lagoons of southern California. As such, salinity tolerance and adaptation in macroalgae is more important than other environmental variables. High nitrogen and phosphorus availability resulted in high tissue N and P, and in intermediate tissue N : P ratio. Conversely, high nitrogen and low phosphorus availability resulted in high tissue N, low tissue P, and high tissue N : P ratio (Wheeler and Bjornsater 1992). Thus, nitrogen limitation was indicated by low tissue nitrogen content and low tissue N : P. Phosphorus limitation was indicated by low tissue phosphorus and high tissue N : P (Wheeler and Bjornsater 1992). The N : P ratio 31-53 in our experiment seemed to be the result of preferential uptake for nitrogen over phosphorus (Fig. 5C)
It can be concluded that green macroalgae such as Ulva and Enteromorpha have a broader salinity tolerance than strictly marine algae; additionally, within a marine environment, intertidal species can better tolerate low salinities than sublittoral species (Lobban and Harrison 1994, Kamer and Fong 2000). In seagrass beds, however, salinity has been considered less important than other environmental factors such as light and temperature on the ecology of green macroalgae. There are numerous unanswered fundamental questions about the effect of salinity on green-tide causing macroalgae, providing opportunities for research ranging from field ecology to molecular biology and biochemistry. Field experiments are essential to determine the impact of single and multiple stresses on the ecophysiological dynamics of macroalgal populations. Thus, both field and laboratory studies are necessary to gain insight into seagrass decline by green macroalgal blooms in eutrophic areas.
We thank In Ji Song and Seo Young Kang for field survey and technical support. This paper was funded by a grant from the Ministry of Land, Transport and Maritime Affairs (Republic of Korea).