검색 전체 메뉴
PDF
맨 위로
OA 학술지
Relative Microalgal Concentration in Prydz Bay, East Antarctica during Late Austral Summer, 2006
  • 비영리 CC BY-NC
ABSTRACT
Relative Microalgal Concentration in Prydz Bay, East Antarctica during Late Austral Summer, 2006
KEYWORD
East Antarctica , nutrients , phytoplankton , Prydz Bay , salinity , temperature , total chlorophyll
  • INTRODUCTION

    Antarctica and the surrounding waters which form a part of Southern Ocean has a significant influence on the global climate. Southern Ocean is characterized by latitudinal fronts marked by steep changes in sea surface temperature, salinity as also biological productivity (Orsi et al. 1995; Sparrow et al. 1996). The coastal waters of Antarctic continent adjoining the Southern Ocean are some of the most productive regions of the world oceans (Davis and Mcnider 1997). Icebergs also play their part in increasing the productivity of the region (Smith et al. 2007; Schwarz and Schodlok 2008). Marine productivity has a significant role in the transfer of atmospheric carbon to Antarctic waters. Antarctic phytoplankton biomass and primary production are known for its variability (Fogg 1977; Holm-Hansen et al. 1977) with diatoms dominating the phytoplankton (Guillard and Kilham 1977). Importance of other taxonomic groups in Antarctic water was reported by Hewes et al. (1985) for e.g. Green algae (Merchant et al. 1989) and cryptophytes (Taylor and Lee 1971). The Southern Ocean biome is widely predominated by Antarctic Phytoplankton. The Prydz Bay region lying in Indian Sector of Southern Ocean has few published studied on phytoplankton (Kang and Fryxell 1991; Zhu et al 2003; Kopczynska et al. 1995). However, in situ data on phytoplankton of Prydz Bay is lacking. It is essential to understand the photosynthetic capacity of water so as to differentiate various types of microalgal components. The standard methods for determination of microalgal components include sampling of water and application of standard methods to determine the total amount of chlorophyll (Strickland and Parsons 1965). The currently available methods for determination of the microalgal population in waters typically lack the in situ and temporal resolution required to obtain a thorough understanding of the role of the phytoplankton in aquatic ecosystems (Beutler et al. 2002). The limitations of traditional methods have been illustrated by various workers (Edgar and Laird 1993; Carrick and Schelske 1997). Although, some in vivo studies have been carried out by different workers using light emitting diodes (Kolboeski and Schreiber 1995; Hilton and Jaworski 1989), they are limited by their inability to differentiate the different algal classes. A submersible fluorometer with several excitation and emission wavelength bands was introduced by Desiderio et al. (1997) and Cowles et al. (1992). They presented vertical profiles of phycoerythrin containing algae using light-emitting diodes and were able to distinguish fluorescence kinetics resulting from different groups of algae in vivo. In vivo fluorescence of photosynthetic pigments present in phytoplankton cells offers a potential way to determine total phytoplankton amount and even the condition of individual groups (Yentsch and Yentsch 1979). The spectrofluorometric determination and indirect discrimination of individual algal groups have been facilitated by the use of fluorescence properties of phytoplankton photosynthetic pigments (Oldham et al. 1985; Yentsch and Phinney, 1985; Porynkina et al. 1994; Babichenko et al 1999; Millie et al. 2002). The present data was collected to assess and understand the role of phytoplankton in Prydz Bay area, in situ profiling of total chlorophyll and their micro algal components.

      >  STUDY AREA

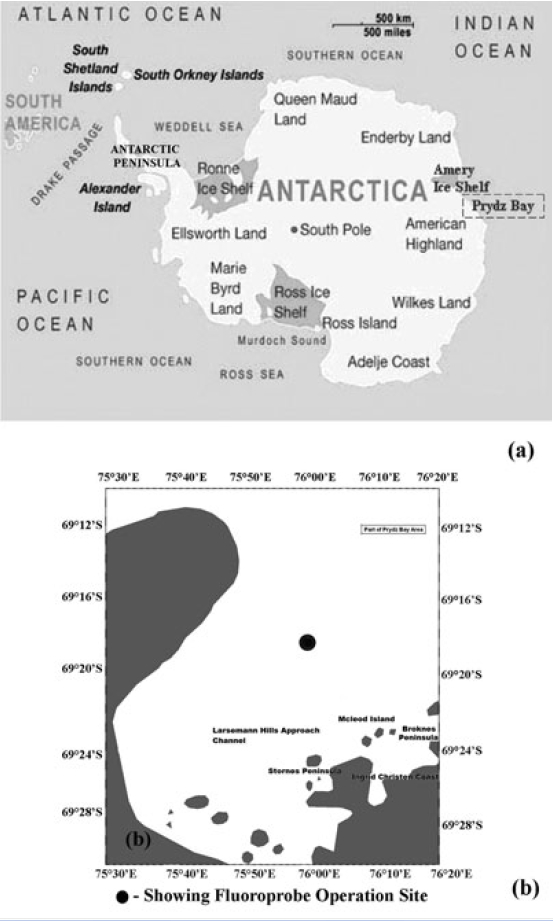
    Prydz Bay, covering an area of about 80,000 km2, is a triangular-shaped embayment in the Indian sector of Southern Ocean (Stagg 1985) (Fig. 1). This is situated between West Ice Shelf (around 80°E) and Cape Darnley (70°E) and the region off the Mawson coast which is often ice-covered similar to the two major Antarctic coastal seas - the Weddell and Ross Sea. In summer season, Antarctic Surface Water mass in Prydz Bay is subdivided into summer surface water and continental shelf water. Summer surface water is relatively warm water having temperature 0-2°C and salinity 33.5-34 psu which is attributed to summer heating and melting (Smith et al. 1984).

    Kang and Fryxell (1991) opined that surface layer depends upon local sea-surface conditions and thermohaline structures which is regulated by horizontal advection through wind-forcing. The base of the summer surface layer has been assumed to correspond with the top of the seasonal thermocline in the 20-50 m depth range. The thickness of the surface layer generally increases to the north outside Prydz Bay, consistent with its relationship to the density of the ice coverage (Smith et al. 1984). Below the highly variable summer surface water lies relatively low-temperature (<0°C) and high-salinity (>34 psu) continental shelf water. Volume of high-salinity shelf water is less prevalent in Prydz Bay comparative to Weddell and Ross Sea. The production of high-salinity shelf water within Prydz Bay is due to the absence of broad shelf areas attributed to its geography and bathymetry (Smith et al. 1984). The principal surface water flow associated with the Antarctic Circumpolar Current is driven eastward by the prevailing westerlies (Jacobs and Georgi 1977; Gordon et al. 1978). To the south the prevailing winds are to the west, giving rise to a divergence zone (around 65°S) in the surface layer commonly referred to as the Antarctic Divergence (Tolstikov 1966). South of the divergence zone the East Wind Drift dominates. An atmospheric low-pressure belt encircles the continent, this being the residue of the many depressions that track from west to east around this latitude (Deacon 1982). The water masses and circulation within Prydz Bay resemble those of similar sites within the Weddell and Ross Seas, but there are significant differences in the large-scale circulations and in the geostrophic and topographic constraints imposed on the flows (Smith et al. 1984).

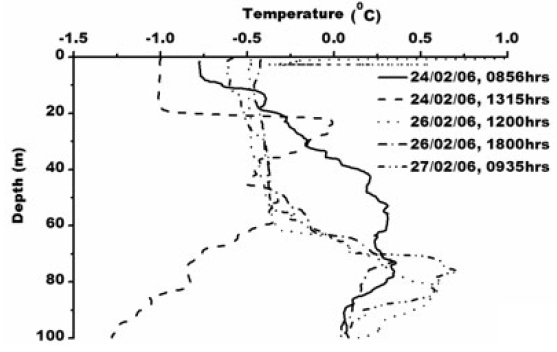
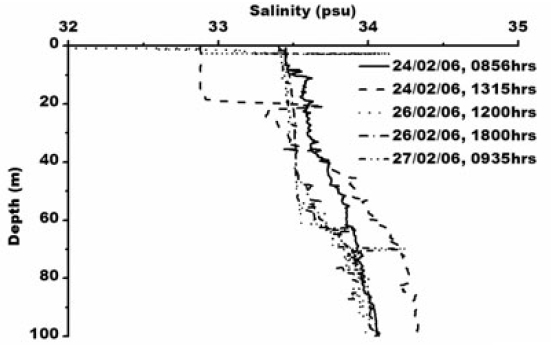
    Smith et al. (1984) observed icebergs off Princess Elizabeth Land moving southwest, while those calved from the Amery Ice Shelf normally follow the western periphery of Prydz Bay toward Cape Darnley. Observation of pack ice movement, iceberg tracks and buoy trajectories near the Antarctic coast provide additional evidence of a westward coastal current (Swithinbank et al. 1977; Tchernia and Jeannin 1980). Physical parameters measured in the Prydz Bay indicate a typical thermohaline structure as also mixing in that area by periodic upwelling processes associated with tides and continental shelf waves (Middleton and Humphries 1989). Nunes Vaz and Lennon (1996) reported based on the hydrographic data collected during the 1980’s that this area is a production site for dense water. During the present study XBT operations (type: T-7; accuracy: ±0.15°C; depth resolution: 0.65 m) were carried out upto 100 m. The sea surface temperature was recorded using a bucket thermometer (accuracy: ±0.1°C) whereas Portable CTD (make: SBE 9/11 plus, Sea-Bird Electronics, USA; temperature accuracy: ±0.001°C, conductivity: ±0.0001 sm-1 and depth ±0.005%) was operated for deeper depth. Temperature varied from ~ -1.0 to 1°C in the water column/surface (Fig. 2) and salinity varied from 32.88 to 34.32 psu (Fig. 3).

    MATERIALS AND METHODS

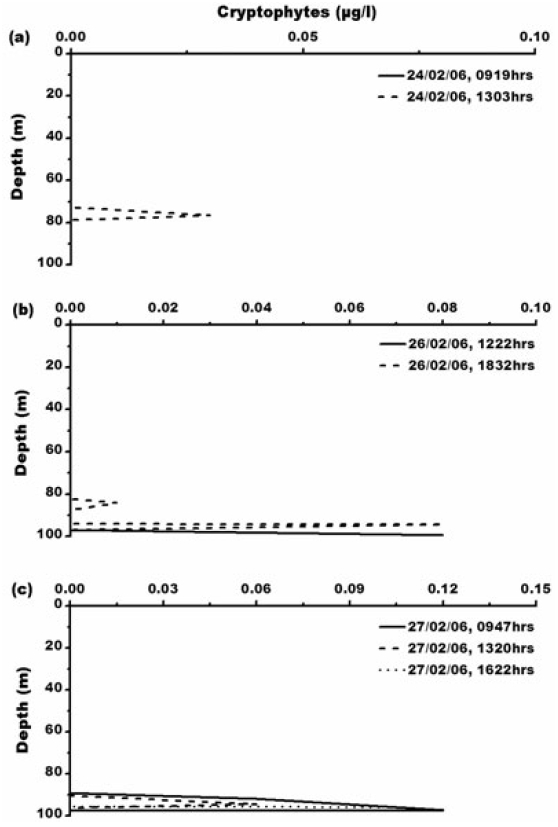
    During the Special Expedition to Larsemann Hills and Southern Ocean (2006) in the summer to winter transition (last week of February 2006) R/V Akademik Boris Petrov was off the Prydz Bay area for undertaking multibeam swath bathymetry of the channel to the station site. A submersible fluorescence probe (FluoroProbe, bbe- Moldaenke, Kiel, Germany) was operated up to 100 m depth for in situ measurement of total chlorophyll and phytoplankton concentration. A total of seven stations at different time intervals between 24-27 February, 2006 were carried out at 69°18’S, 76°00’E. The FluoroProbe for algal differentiation uses 5 light emitted diodes (LED) for fluorescence excitation. The LEDs emit pulsed light at fixed wavelengths (450 nm, 525 nm, 570 nm, 590 nm and 610nm). Fluorometric emission is measured at 680 nm by photomultiplier at an angle of 90° to the exciting light source (Buetler et al. 2002). The probe is connected online mode to a laptop from which it is operated and to which the data on depth and phytoplankton composition are sent every second. The division of Chlorophyceae (Green algae) shows a broad maximum of fluorescence at the 450 nm LED that corresponds to chlorophyll-a and chlorophyll-b excitaion. The Cyanophyceae (Blue-green algae) pigments are characterized by maximum excitation at 610 nm caused by photosynthetic antenna pigment phycocyanin. 525 nm region for Bacillariophyceae (Diatoms) originates from xanthophylls, fucoxanthin andperidin for the division of Dinophyceae. The maxima at450 nm is caused by chlorophyll-a and chlorophyll-c.Group Cryptophyceae originates from phycoerythrin at570 nm. For precision of the Fluoroprobe measurementsand calibration see Buetler et al. (2002). We have reported 15N based production measurements in the SouthernIndian Ocean elsewhere (Personal communication). Wemeasured the nitrate, ammonium and urea uptake ratesand f-ratio for the surface waters of Prydz Bay. 250 ml ofsamples were separately collected for nutrient measurements(for details of experimental techniques reference ismade to Kumar et al. (2004).

    RESULTS AND DISCUSSION

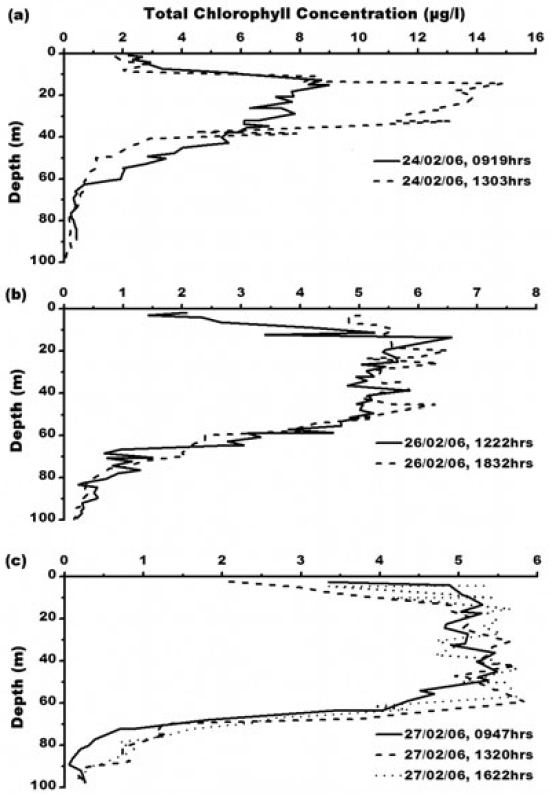
    Total chlorophyll concentration ranges from 0.03-14.87 μg L-1 (Fig. 4). Maximum chlorophyll concentration of 14.87 μg L?1 was observed at 1303 h, 24th February. The chlorophyll maxima is recorded at 15 meter water depth. One of the key characteristics of the chlorophyll ‘a’ is its fluorescence. Fluorescence of photosynthetic pigments is partly dependent on the physiological status of the cell and its photosystems, which is affected by factors, such as life history of the cell, nutrients availability and light conditions (Kiefer 1973; Vincent et al. 1984; Soohoo et al. 1986). Photosystem II (PSII) is mainly responsible for chlorophyll fluorescence which consists of a peripheral and core antenna. The former contains a species-dependent light absorbing pigment, the later an evolutionary conserved molecule of chlorophyll (Buetler et al. 2002). Fluorescence emission of PSII measured around 685 nm is generally accepted as a measure of chlorophyll content of algae in aquatic system (Yentsch and Menzel 1963; Holm-Hansen 1965). Higher chlorophyll concentration in oceanic water of Prydz Bay is attributed to higher primary productivity and eutrophic nature of Antarctic waters. Persistence of abundant chlorophyll-a in the coastal waters in the eastern part of Prydz Bay could be attributed to cooler coastal waters which are generally more productive (Nicol et al. 2000) which substantiate our study as maximum chlorophyll concentration of 14.87 μg L-1 occurs where water temperature is -1°C at surface to 20m depth indicating upward movement of water due to local wind forcing. This subsurface cold water is due to the winter water which occurs as residue from the previous winter mixed layer, limited by seasonal warming and freshening (Park et al. 1998). Chlorophyll less than 14.87 μg L-1 occurs where temperature is greater than -1°C and shows negative correlation with chlorophyll (R2 = -.29, -.79, -.86, -.69 for temperature station 1, 3, 4 and 5 respectively, Fig. 2). Chlorophyll-a concentration in the euphotic zone increases and the critical depth decreases due to increased attenuation of PAR, as light levels may become limiting for phytoplankton growth (Strutton et al. 2000). Earlier study also suggests that the chlorophylla concentration in the Prydz Bay is high (Gibson and Trull 1999). They reported chlorophyll concentration >15 mg m?3 during the mid summer (January).

    Mongoni et al. (2004) have reported 2.5 fold higher chlorophyll-a concentration of 102 and 206 mg m?2 during January and February respectively in Ross Sea. They observed broken pack and melting ice which was coloured by an extensive algal biomass suggesting that the phytoplankton was a result of seeding from ice algal communities. Higher level of chlorophyll concentration may be attributed to coverage of summer ice in late summer season when freezing starts. In Indian Sector of Southern Ocean, 63°S onwards to Antarctica, melting/freezing processes are more prominent in late austral summer (Srivastava et al. 2007). During freezing, salinity increases as ice discards salt; conversely melting decreases the salinity due to input of fresh water (Archambeau et al. 1998). The variable concentration of chlorophyll at the same location in different timings could be attributed to melting/ freezing processes. During melting, a stable surface layer forms with ample amount of nutrients and warmer water temperature favouring the growth of phytoplankton (Mitchell and Holm-Hansen 1991). This is further substantiated by higher Total N uptake rate (~12.3 mmol N m?2 d?1). The photic zone concentrations of nitrate, ammonia and urea are 7.70, 3.30, and 1.27 mmol N m?2 d?1 respectively. In terms of carbon, the total carbon uptake during late austral summer in the Antarctic coastal zone is 981.5 mmol N m?2 d?1. The f-ratio here is 0.63. High carbon uptake rate in coastal regions of Antarctica was also reported by other authors (Treguer and Jacques 1992). The production in the region is high as the coastal region receives ample nutrients from the Antarctic continent. These nutrients are derived through the coastal continental erosion and contain significant amount of iron along with other major nutrients.

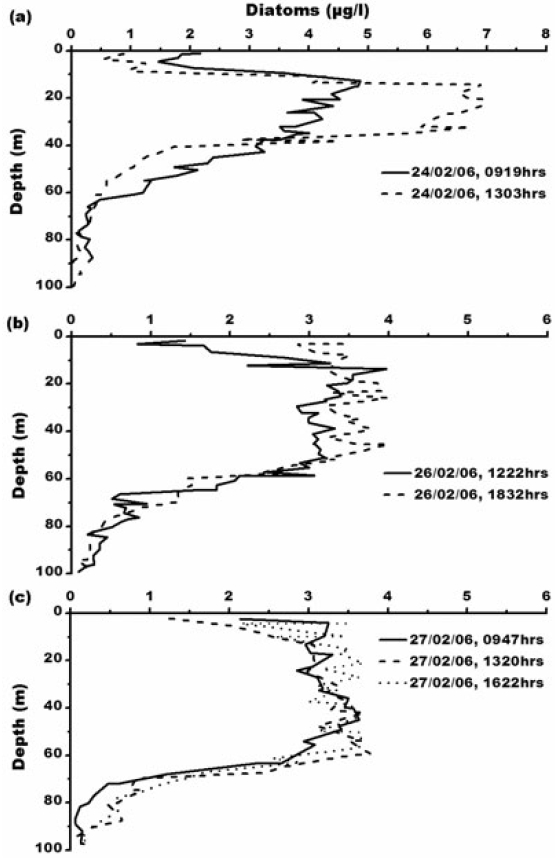
    Diatom concentration ranges from 0.01-6.94 μg L?1. Maximum diatom concentration of 6.94 μg L?1 has been observed at 1303 h, 24th February, 2006 (Fig. 5). Elevated levels of diatom concentration is due to high nutrient concentration. Earlier studies also reported diatom dominance in Prydz Bay (Kang and Fryxell 1991; Kopczynska et al. 1995; Zhu et al. 2003) which substantiates our study. It is widely accepted that Phaeocystis sp. and diatoms are the dominant phytoplankton taxa throughout Antarctic and Arctic waters (El-Sayed and Fryxell 1993). Arrigo et al. (1999) have reported dominance of diatoms in Ross Sea in stratified water column whereas presence of Phaeocystis antarctica occurs in mixing condition.

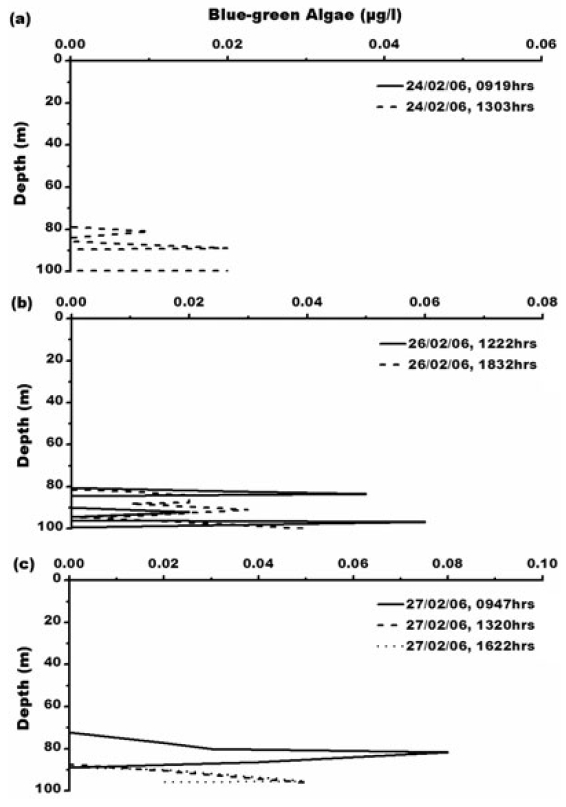
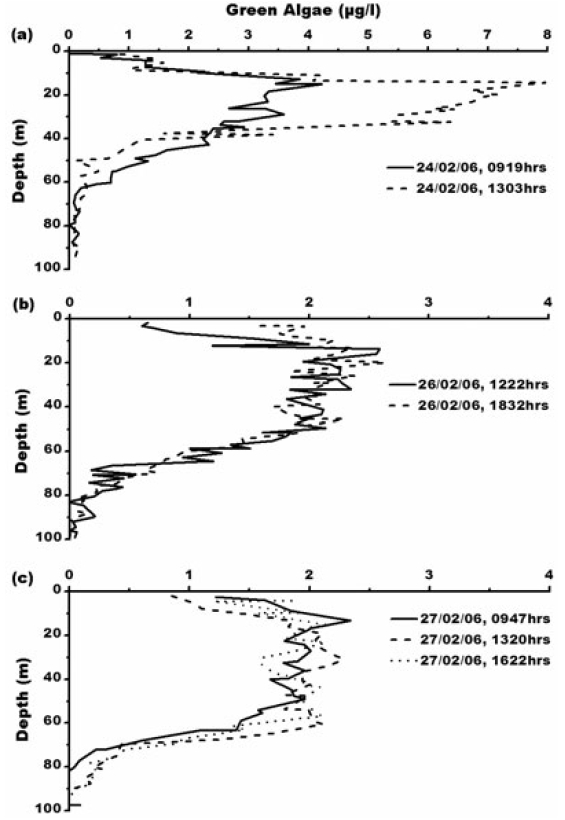
    Concentration of blue-green algae (BGA) varies from 0.01-0.08 μg L?1. Its maximum concentration of 0.08 μg L?1 is at 0947 h, 27th February, 2006 (Fig. 6) which is between 65-85 m depth where water is comparatively warmer with temperature of 0.6°C with maximum salinity- 33.3 psu. Green algae concentration ranges from 0.01- 7.97 μg L?1. The maximum concentration of green algae (7.97 μg L?1) is at 1303 h, 24th February, 2006 (Fig. 7). Green algal concentration is following same trend like chlorophyll concentration suggesting that lower temperature of -1°C is favouring their growth (Fig. 7a). Concentration of green algae is high compared to that of blue-green algae which is due low sea surface temperature and also widespread distribution of chlorophyll-b (Bidigare et al. 1986; Buma et al. 1992) that play an important role in photosynthesis and serve as food for heterotrophic organisms. Concentration of cryptophytes ranges from 0.01-0.12 μg L?1 with higher concentration of 0.12 μg L?1 recorded at 0947 h, 27th February, 2006 (Fig. 8). Concentration of cryptophytes is low because presence of cryptophytes is usually related to a successional change occurring after a diatom bloom (Moline and Prezelin 1996) and could be due to higher salinity. Cryptophytes are frequently associated with low salinity, highly stable water layers where they are maintained by active swimming or to the confluence of different water masses with high phytoplankton biomass values (Schloss and Estrada 1994; Mura et al. 1995) which corroborate our study, as their presence is only at deeper stable layer of water depth 80-100 m. Concentration of yellow substances ranges from 0.02-0.32 μg L?1 with maximum concentration of 0.32 μg L?1 at 0947 h, 27th February 2006 (Fig. 9). Yellow substances, in addition to pigments and non-living material, are one of the factors determining the shape of the total absorption spectrum in the visible range and this causes variations in ocean colour. Yellow substances higher than 1 m?1 are rare and are observed only in the Baltic Sea or in highly contaminated areas. In coastal area of Prydz Bay, yellow substances are comparatively higher which could be attributed to fluvial discharges (Bricaud et al. 1981).

    CONCLUSION

    The Prydz Bay studied area is characterized by abundant phytoplankton assemblage dominated by diatoms. Maximum chlorophyll concentration occurs where water temperature is lowest (-1℃) from surface to 20 m depth due to upward movement of winter water. An adequate light availability associated with vertical stability seems to favour phytoplankton blooms in Antarctic waters. In coastal upwelling regions, the dominant primary producers are diatoms which contribute to high siliceous ooze as they have high sinking velocities and sink either as individuals, aggregates, mats or in fecal pellets. The particular area has high productivity (981.5 mgC m?2 d?1) and high f-ratio (0.63) [Personal communication]. The productivity is high due to the intrusion of macro as well as micro-nutrient (especially iron) from icebergs which favours the phytoplankton growth in Prydz Bay. This study is solely based on in situ measurements of microalgal concentration but highlights Prydz Bay area as one with high productivity (High f-ratio) inferred from elevated chlorophyll level.

참고문헌
  • 1. Archambeau A.S, Pierre C, Poisson A, Schauer B 1998 Distributions of oxygen and carbon stable isotopes and CFC-12 in the water masses of the Southern Ocean at 30˚E from South Africa to Antarctica: results of the CIVA1 cruise [Journal of Marine Systems] Vol.17 P.25-38 google cross ref
  • 2. Arrigo K.R, Robinson D.H, Worthen D.L, Dunbar R.B, DiTullio G.R, VanWoert M, Lizotte M.P 1999 Phytoplankton Community Structure and the Drawdown of Nutrients and CO2 in the Southern Ocean [Science] Vol.283 P.365-367 google cross ref
  • 3. Babichenko S, Kaitala S, Leeben A, Poryvkina L, Sepala J 1999 Phytoplankton pigments and dissolved organic matter distribution in the Gulf of Riga [Journal of Marine Systems] Vol.23 P.69-82 google cross ref
  • 4. Beutler M, Wiltshire K.H, Meyer B, Moldaenke C, Luring C, Meyerhofer M 2002 A fluorometric method for the differentiation of algal populations in vivo and in situ [Photosynthesis Research] Vol.72 P.39-53 google cross ref
  • 5. Bidigare R.R, Frank T.J, Zastrow C, Brooks J.M 1986 The distribution of algal chlorophylls and their degradation products in the Southern Ocean [Deep Sea Research Part A Oceanographic Research Papers] Vol.33 P.923-937 google cross ref
  • 6. Bricaud A, Morel A, Prieur L 1981 Absorption by dissolved organic matter of the sea (yellow substance) in the UV and visible domains [Oceanogra] Vol.26 P.43-53 google
  • 7. Buma A.G.J, Gieskes W.W.C, Thomsen H.A 1992 Abundance of Cryptophyceae and chlorophyll-b contain-ing organisms in the Weddell-Scotia Confluence area in the spring of 1988 [Pol Biol] Vol.12 P.43-52 google
  • 8. Carrick H.J, Schelske C.L 1997 Have we overlooked the importance of small phytoplankton in productive waters? Limnolog [Oceanogra] Vol.47 P.1613-1621 google
  • 9. Cowles T.J, Desiderio R.A, Neuer S 1992 In situ characterization of phytoplankton from vertical profiles of fluorescence emission spectra [Marine Biology] Vol.115 P.217-222 google cross ref
  • 10. Davis A.M.J, McNider R.T 1997 The Development of Antarctic Katabatic Winds and Implications for the Coastal Ocean [Journal of the Atmospheric Sciences] Vol.54 P.1248-1261 google cross ref
  • 11. Deacon G.E.R 1982 Physical and biological zonation in the Southern Ocean [Deep Sea Research Part A Oceanographic Research Papers] Vol.29 P.1-16 google cross ref
  • 12. Desidario R.A, Moore C, Lantz C, Cowles T.J 1997 Multiple excitation fluorometer for in situ oceanographic applications [Applied Optics] Vol.36 P.1289-1296 google cross ref
  • 13. Edgar R.K, Laird K 1993 Computer simulation of error rates of Poisson-based interval estimates of plankton abundance [Hydrobiologia] Vol.264 P.65-77 google cross ref
  • 14. El-Sayed S.Z, Fryxell G.A 1993 Phytoplankton;Antarctic Microbiology google
  • 15. Fogg G.E 1977 Aquatic primary production in the Antarctica [Philos Trans Roy Soc London] Vol.279 P.27-38 google
  • 16. Gibson J.A.E, Trull T.W 1999 Annual cycle of fCO2 under sea-ice and in open water in Prydz Bay [Marine Chemistry] Vol.66 P.187-200 google cross ref
  • 17. Gordon A.L, Molinelli E, E T 1978 Large-scale relative dynamic topography of the Southern Ocean [Journal of Geophysical Research] Vol.83 P.3023-3032 google cross ref
  • 18. Guillard R.R.L, Kilham P, Werner D 1977 The ecology of marine planktonic diatoms google
  • 19. Hewes C.D, Holm-Hansen O, Sakshaug E 1985 Alternate carbon pathways at low trophic levels in the Antarctic food web;Antarctic Nutrients Cycles and Food Webs google
  • 20. Hilton J, Rigg E, Jaworski G 1989 Algal differentiation using in vivo fluorescence spectra [Journal of Plankton Research] Vol.11 P.65-74 google cross ref
  • 21. Holm-Hansen O 1965 Fluorometric determination of Chlolophyll [J de Cons Pour Int Exp de la Mer] Vol.30 P.3-15 google
  • 22. Holm-Hansen O, El-Sayed S.Z, Franceschini G, Cuhel R 1977 Primary production and the factors controlling phytoplankton growth in the Southern Ocean;Adaptations with in Antarctic Ecosystems google
  • 23. Jacobs S.S, Georgi D.T 1977 Observations on the southwest Indian Antarctic Ocean;A Voyage of Discovery google
  • 24. Kang S.H, Fryxell G.A 1991 Most abundant diatom species in water column assemblages from five Leg 119 Drill sites in Prydz Bay Antarctica: Distributional Patterns google
  • 25. Kiefer D.A 1973 Fluorescence properties of natural phytoplankton populations [Marine Biology] Vol.22 P.263-269 google cross ref
  • 26. Kolboeski J, Schreiber U 1995 Computer-controlled phytoplankton analyzer based on a 4-wavelenght PAM Chl fluorescence;Photosynthesis: From Light to Biosphere Kluwer Academic Publishers google
  • 27. Kopczynska E.E, Goeyens L, Semeneh M, Dehairs F 1995 Phytoplankton composition and cell carbon distribution in Prydz Bay Antarctica: relation to organic particulate matter and its δ13C values [Journal of Plankton Research] Vol.17 P.685-707 google cross ref
  • 28. Kumar S, Ramesh R, Sardesai S, Sheshshayee M.S 2004 High new production in the Bay of Bengal: Possible causes and implications [Geophysical Research Letters] Vol.31 P.1-4 google cross ref
  • 29. Merchant H.J, Buck K.R, Garrison D.L, Thomsen H.A 1989 Mantoniella in Antarctic waters including the description of M Antarctica sp nov (Prasinophyceae) [Journal of Phycology] Vol.25 P.167-174 google cross ref
  • 30. Middleton J.H, Humphries S.E 1989 Thermohaline structure and mixing in the region of Prydz Bay Antarctica [Deep Sea Research Part A Oceanographic Research Papers] Vol.36 P.1255-1266 google cross ref
  • 31. Millie D.F, Schofield O.M.E, Kirkpatrick G.J, Johnsen G, Evens T.J 2002 Using absorbance and fluorescence spectra to discriminate microalgae [European Journal of Phycology] Vol.37 P.313-332 google cross ref
  • 32. Mitchell B.G, Holm-Hansen O 1991 Observations of modeling of the Antartic phytoplankton crop in relation to mixing depth [Deep Sea Research Part A Oceanographic Research Papers] Vol.38 P.981-1007 google cross ref
  • 33. Moline M.A, Prezelin B.B 1996 Long-term monitoring and analyses of physical factors regulating variability in coastal Antarctic phytoplankton biomass in situ productivity and taxonomic composition over sub-seasonal seasonal and inter-annual time scales [Marine Ecology Progress Series] Vol.145 P.143-160 google cross ref
  • 34. Mangoni O, Modigh M, Conversano F, Carrada G.C, Saggiomo V 2004 Effects of summer ice coverage on phytoplankton assemblages in the Ross Sea Antarctica [Deep Sea Research Part I] Vol.51 P.1601-1617 google
  • 35. Mura M.P, Satta M.P, Agusti S 1995 Water-mass influence of summer Antarctic phytoplankton biomass and community structure [Polar Biology] Vol.15 P.15-20 google cross ref
  • 36. Nicol S, Pauly T, Bindoff N.L, Strutton P.G 2000 ''BROKE'' a biological/oceanographic survey off the coast of East Antarctica (80-150oE) carried out in January-March 1996 [Deep Sea Research Part II Topical Studies in Oceanography] Vol.47 P.2281-2298 google cross ref
  • 37. Nunes Vaz R.A, Lennon G.W 1996 Physical oceanography of the Prydz Bay region of Antarctic waters [Deep Sea Research Part I Oceanographic Research Papers] Vol.43 P.603-641 google cross ref
  • 38. Oldham P.B, Zillioux E.J, Warner I.M 1985 Spectral “fingerprinting” pf phytoplankton populations by twodimensional fluorescence and Fourier- transform-based pattern recognition [Journal of Marine Research] Vol.43 P.893-906 google cross ref
  • 39. Orsi A.H, Whitworth T, Nowlin W.D 1995 On the meridional extent and fronts of the Antarctic Circumpolar Current [Deep Sea Research Part I Oceanographic Research Papers] Vol.42 P.641-673 google cross ref
  • 40. Park Y.H, Charriaud E, Fieux M 1998 Thermohaline structure of the Antarctic Surface Water/Winter Water in the Indian sector of the Southern Ocean [Journal of Marine Systems] Vol.17 P.5-23 google cross ref
  • 41. Poryvkina L, Babichenko S, Katiala S, Kuosa H 1994 Spectral fluorescence signatures in the characterization of phytoplankton community composition [Journal of Plankton Research] Vol.16 P.1315-1327 google cross ref
  • 42. Schloss I, Estrada M 1994 Phytoplankton composition in the Weddell-Scotia Confluence area during austral spring in relation to hydrography [Polar Biology] Vol.14 P.77-90 google cross ref
  • 43. Schwarz J.N, Schodlok M.P 2008 Icebergs boost phytoplankton growth in the Southern Ocean google
  • 44. Smith N.R, Zhaoqian D, Kerry K.R, Wright S 1984 Water masses and circulation in the region of Prydz Bay Antarctica [Deep Sea Research Part A Oceanographic Research Papers] Vol.31 P.1121-1147 google cross ref
  • 45. Smith Jr K.L, Robison B.H, Helly J.J, Kaufmann R.S, Ruhl H.A, Shaw T.J, Twining B.S, Vernet M 2007 Free-Drifting Icebergs: Hot Spots of Chemical and Biological Enrichment in the Weddell Sea [Science] Vol.317 P.478-482 google cross ref
  • 46. Soohoo J.B, Kiefer D.A, Collins D.J, McDermid I.S 1986 In vivo fluorescence excitation and absorption spectra of marine phytoplankton: I Taxonomic characteristics and responses to photoadaptation [Journal of Plankton Pesearch] Vol.8 P.97-214 google cross ref
  • 47. Sparrow M.D, Heywood K.J, Brown J, Stevens D.P 1996 Current structure of the South Indian Ocean [Journal of Geophysical Research] Vol.101 P.6377-6391 google cross ref
  • 48. Srivastava R, Ramesh R, Prakash S, Anilkumar N, Sudhakar M 2007 Oxygen isotope and salinity variations in the Indian sector of the Southern Ocean [Geophys Res Lett] Vol.34 google cross ref
  • 49. Stagg H 1985 The structure and origin of Prydz Bay and Mac Robertson Shelf East Antarctica [Tectonophysics] Vol.114 P.315-340 google cross ref
  • 50. Strickland J.D.H, Parsons T.R 1965 A manual of sea water analysis Bull [Fisheries Res Board Can] Vol.125 P.203 google
  • 51. Strutton P.G, Brian Griffiths F, Waters R.L, Wright S.W, Bindoff N.L 2000 Primary productivity off the coast of East Antarctica (80-150oE): January to March 1996 [Deep Sea Research Part II Topical Studies in Oceanography] Vol.47 P.2327-2362 google cross ref
  • 52. Swithinbank C.W.M, McClain P, Little P 1977 Drift tracks of Antarctic icebergs [Polar Record] Vol.18 P.495-501 google cross ref
  • 53. Taylor D.L, Lee C.C 1971 A new cryptomonad from antarctica: Cryptomonas cryophila sp nov [Archives of Microbiology] Vol.75 P.269-280 google cross ref
  • 54. Tchernia P, Jeannin P.F 1980 Observations on the Antarctic East Wind Drift using tabular icebergs tracked by satellite Nimbus F (1975-1977) [Deep Sea Research Part A Oceanographic Research Papers] Vol.27 P.467-474 google cross ref
  • 55. Tolstikov E.E, Jeannin P.F 1966 Atlas Antarktiki google
  • 56. Treguer P, Jacques G 1992 Dynamics of nutrients and phytoplankton and fluxes of carbon nitrogen and silicon in the Antarctic Ocean [Polar Biology] Vol.12 P.149-162 google cross ref
  • 57. Vincent W.F, Neale P.J, Richerson P.J 1984 Photoinhibition: algal responses to bright light during diel stratification and mixing in a tropical alpine lake [Journal of Phycology] Vol.20 P.201-211 google cross ref
  • 58. Yentsch C.H, Menzel D.W 1963 A method for the determination of phytoplankton Chlorophyll by fluorescence [Deep Sea Res] Vol.10 P.1221-1231 google
  • 59. Yentsch C.H, Phinney D.A 1985 Spectral fluorescence: A taxonomic tool for studying the structure of phytoplankton populations [Journal of Plankton Research] Vol.7 P.617-632 google cross ref
  • 60. Yentsch C.H, Yentsch C.M 1979 Fluorescence spectral signatures: The characterization of phytoplankton populations by the use of excitation and emission spectra [J Mar Res] Vol.37 P.471-483 google
  • 61. Zhu G-H, Ning X-R, Cai Y-M, Liu Z-L 2003 Phytoplankton in Prydz Bay and its adjacent sea area of Antarctica during austral summer (1998/1999) [Acta Botanica Sinica] Vol.45 P.390-398 google
OAK XML 통계
이미지 / 테이블
  • [ Fig. 1. ]  (a) Map of Antarctica showing location of Prydz Bay. (b) Map of Prydz Bay, Antarctica showing station location (Modified after Stagg, 1966).
    (a) Map of Antarctica showing location of Prydz Bay. (b) Map of Prydz Bay, Antarctica showing station location (Modified after Stagg, 1966).
  • [ Fig. 2. ]  Temperature profile upto 100 m depth in Prydz Bay at different times from 24th to 27th February, 2006.
    Temperature profile upto 100 m depth in Prydz Bay at different times from 24th to 27th February, 2006.
  • [ Fig. 3. ]  Salinity profile upto 100 m depth in Prydz Bay at different times from 24th to 27th February, 2006.
    Salinity profile upto 100 m depth in Prydz Bay at different times from 24th to 27th February, 2006.
  • [ Fig. 4. ]  (a-c) Concentration of total chlorophyll upto 100 m depth in Prydz Bay. (a) 24th February, 2006 at 0919 h and 1303 h. (b) 26th February, 2006 at 1222 h and 1832 h. (c) 27th February, 2006 at 0947 h, 1320 h and 1622 h.
    (a-c) Concentration of total chlorophyll upto 100 m depth in Prydz Bay. (a) 24th February, 2006 at 0919 h and 1303 h. (b) 26th February, 2006 at 1222 h and 1832 h. (c) 27th February, 2006 at 0947 h, 1320 h and 1622 h.
  • [ Fig. 5. ]  Concentration of diatoms upto 100 m depth in Prydz Bay. (a) 24th February, 2006 at 0919h and 1303h. (b) 26th February, 2006 at 1222h and 1832h. (c) 27th February, 2006 at 0947h, 1320h and 1622h.
    Concentration of diatoms upto 100 m depth in Prydz Bay. (a) 24th February, 2006 at 0919h and 1303h. (b) 26th February, 2006 at 1222h and 1832h. (c) 27th February, 2006 at 0947h, 1320h and 1622h.
  • [ Fig. 6. ]  Concentration of blue-green algae upto 100 m depth inPrydz Bay. (a) 24th February, 2006 at 0919h and 1303h. (b) 26th February, 2006 at 1222h and 1832h. (c) 27th February, 2006 at 0947h, 1320h and 1622h.
    Concentration of blue-green algae upto 100 m depth inPrydz Bay. (a) 24th February, 2006 at 0919h and 1303h. (b) 26th February, 2006 at 1222h and 1832h. (c) 27th February, 2006 at 0947h, 1320h and 1622h.
  • [ Fig. 7. ]  Concentration of green algae upto 100 m depth in Prydz Bay. (a) 24th February, 2006 at 0919 h and 1303 h. (b) 26th February, 2006 at 1222 h and 1832 h. (c) 27th February, 2006at 0947 h, 1320 h and 1622 h.
    Concentration of green algae upto 100 m depth in Prydz Bay. (a) 24th February, 2006 at 0919 h and 1303 h. (b) 26th February, 2006 at 1222 h and 1832 h. (c) 27th February, 2006at 0947 h, 1320 h and 1622 h.
  • [ Fig. 8. ]  Concentration of Cryptophytes upto 100 m depth in Prydz Bay. (a) 24th February, 2006 at 0919h and 1303h. (b) 26th February, 2006 at 1222h and 1832h. (c) 27th February,2006 at 0947h, 1320h and 1622h.
    Concentration of Cryptophytes upto 100 m depth in Prydz Bay. (a) 24th February, 2006 at 0919h and 1303h. (b) 26th February, 2006 at 1222h and 1832h. (c) 27th February,2006 at 0947h, 1320h and 1622h.
  • [ Fig. 9. ]  Concentration of Yellow Substances upto 100 m depth in Prydz Bay. (a) 24th February, 2006 at 0919 h and 1303 h. (b) 26th February, 2006 at 1222 h and 1832 h. (c) 27th February, 2006 at 0947 h, 1320 h and 1622 h.
    Concentration of Yellow Substances upto 100 m depth in Prydz Bay. (a) 24th February, 2006 at 0919 h and 1303 h. (b) 26th February, 2006 at 1222 h and 1832 h. (c) 27th February, 2006 at 0947 h, 1320 h and 1622 h.
(우)06579 서울시 서초구 반포대로 201(반포동)
Tel. 02-537-6389 | Fax. 02-590-0571 | 문의 : oak2014@korea.kr
Copyright(c) National Library of Korea. All rights reserved.