The light emitting diode (LED) has advantages over traditional light sources [1]. LEDs offer a cheap, stable, and easy-to-use alternative to traditional lighting sources. The advantages of LED's over conventional wide-field illuminators such as arc lamps have been discussed in detail elsewhere [2]. In Korea, the development and diffusion of the LED has been under way to decrease the volume of energy and CO2. For these reasons, LED has been regarded as the best potential light source for next-generation lighting. In such applications, the management of optical etendue and illumination contrast is important, and a precise optical model of LED lighting is necessary for lighting design and for analyzing and applying white LEDs [3-7].
This paper has analyzed properties of an LED chip for safety street lighting, and has designed a 100 W LED module based on the optic properties of the single LED. The 100 W module (which is simulation modeling) has a average road illuminance comparable to Korean Industrial Standards (KS) for LED safety street lighting (KS C7658:2009). Also, this paper has had comparison experiments between a manufactured 100 W product (model CE180-ST-OS) designed by 100 W simulation and a 100 W simulation. Through comparison experiments, precise simulation could be inferred.
The aims of this research are to provide an optical analysis of the developed design, to determine the possible design flaws as compared to the design standards for the specific applications, and to come up with possible improvements.
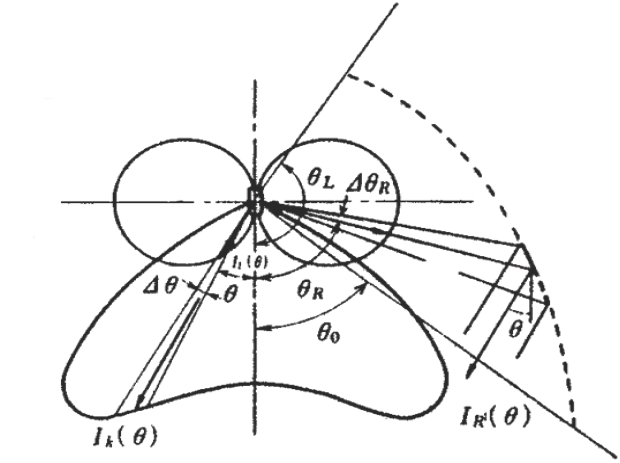
The reflector is meant to control a ray from a light source. In Fig. 1, if we suppose that the light source is a point source, then the inclination of the reflector can determine that luminous flux (F_r (θ)) reverberated by the reflector is the same as the sum (F_ k (θ)), which is a direct ray (F_l (θ)) of light to get luminous flux (F_k (θ)), which is the θ direction of the aim distribution. Therefore, reflection luminous flux of the θ direction is defined by the following formula.

For light of the lamp, the quantity from θR and the scope of θR + θθR to the reflected light in the θ direction is defined by the numerical formula.
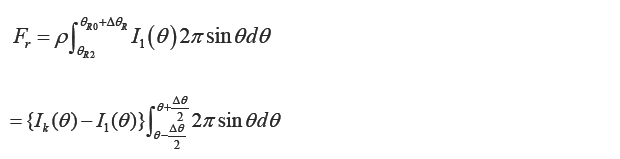
In this case we already know ρ, θ, θθ, θR, Ik(θ), I1(θ) so we can obtain θθR. The reflector, which is from θR to θR + θθR, offers reflected light in the θ direction, Therefore, we can determine the inclination of the reflector, and the form of the reflector is determined as repetition about the total reflector [6].
Radiation distribution, chip location, and the reflector cause an error rate, so optical properties depend on the radiation pattern, total efficiencies and illumination. In short, optic properties depend on LED chip sizes, reflector properties, and packaging of the LED [8]. For these reasons, simulation design needs to determine the location and dimension of the interior in the single LED chip through experiments.
3.1 Result of structure analysis and optic experiment based on single LED chip
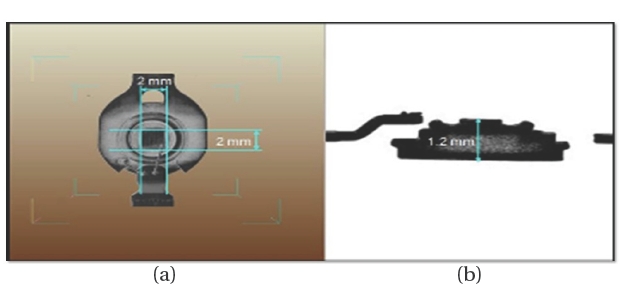
Structure analysis of the LED chip was used by 3D Microfocus X-Ray CT System (SMX-225CTSpecial; Shimadzu Corporation, Kyoto, Japan) throughout the structure analysis experiment. The length and width of the chip are each 2 mm, and the distance from the base side of the outer package to the chip is 1.2 mm. Figures 2(a) and (b) show the measurement results through the 3DMicrofocus X-Ray CT System at the front and side of the LED package.
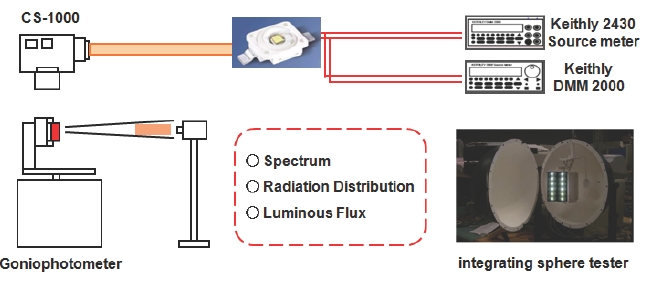
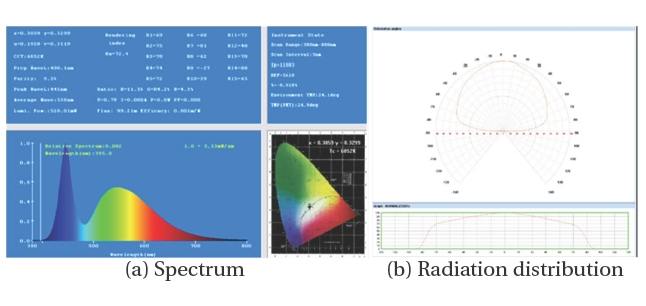
The optical property experiment based on the single LED consisted of three parts: experiment with Luminous flux, radiation distribution, and spectrum. The luminous flux measurement used an integrating sphere tester (Everfine_0.3 inch LED, Hangzhou, China) Light distribution curves have been tested with a Goniophotometer light distribution curve tester (OPI-310, Jeonju, Korea) and the CS-1000 tester (Konica Minolta Corporation, Tokyo, Japan) could get white LED spectrum information. Luminous intensity has been derived from a numerical formula without a tester. A LED chip supplied an injection of 350 mA with a Keithly 2430 source meter, and the luminous flux confirmed the average 99.2 m. Figure 3 shows the radiation distribution and spectrum properties. The spectrum shows two dominant peak properties, and shows a white wavelength mixed blue LED with YAG phosphor. Also, the radiation distribution shows about 170 degree properties. The simulation has applied optical properties, and has had the base of LED module design throughout these experiments. Figure 4 shows the experimental setup of the single LED chip.
3.2 A precise LED modeling for LED module
Optical properties have been analyzed by a simulation program using the Monte Carlo ray tracing method.
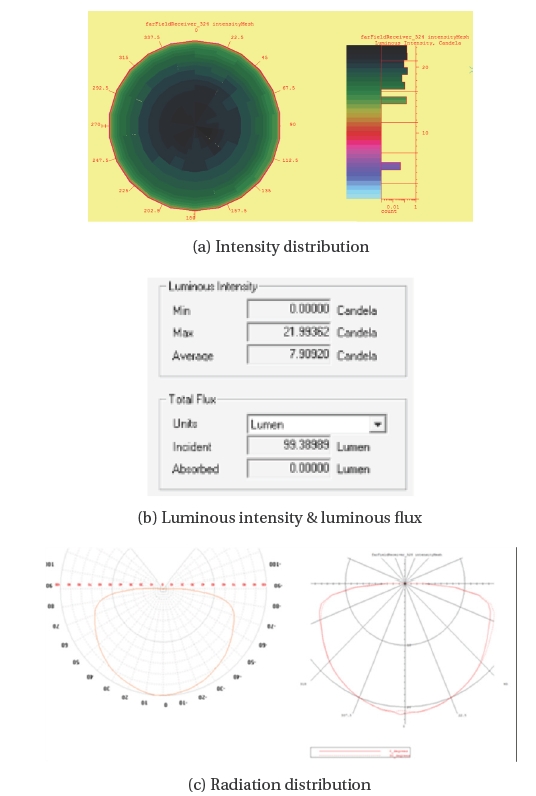
A single LED chip has been simulated in the Data sheet along with four optical properties, such as location and size of chip, luminious flux, spectrum, and radiation distribution. These optical properties based on the single LED chip have been applied in simulation, and simulation results are summarized in Fig. 5, where, (a) is the simulated intensity distribution on a test area [11 mesh and 11 mesh], which is used by a farfield receiver. The chart in Fig. 5 shows the intensity distribution of each different mesh, and a candela range from 0 cd to 22 cd. (b) is the simulated luminous intensity (cd) and luminous flux (l m). Here, luminous flux is about 99.4 m, and it is almost the same as the luminous flux data (99.2 m) used by an integrating sphere tester of the Everfine Corporation. (c) is the simulated radiation distribution and data tested with a Goniophotometer light distribution curve tester. Here, radiation distribution shows all Lambertian forms. Also, the viewing angle shows 170 degrees. Thus, the precise optical modeling for the single LED module has been performed, and we can conduct further simulation for the whole LED safety street lighting.
3.3 Module composition for safety street lighting and completed simulation module
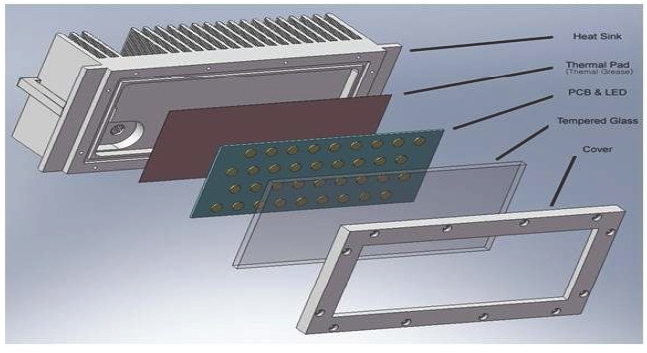
Figure 6 shows a schematic of a LED module with power consumption of 53 W. The lamp is mainly composed of five parts: 40 high-power LEDs, 40 reflective cups, the second lenses, a lamp frame with fins, and a slim printed circuit board (PCB) for the power input of the LEDs. The lamp frame consists of an aluminum base and fins. The 40 high-power LEDs are directly bonded on the aluminum base to reduce the thermal resistance.
To make a 100 W module, it has been composed with two connected 53 W modules. The 106 W (53 W + 53 W) module is distributed on the aluminum base in each of eight rows (2.8 A). The 53 W module of one has been injected by drive current (1.4 A). Therefore, to each LED chip has been applied about 350 mA. The reflective cups and lenses have been put on the LED's and used to control the light rays. The two slim PCBs have been located on the aluminum base and used to provide power input.
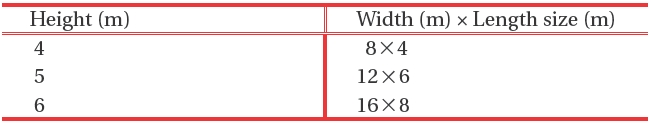
[Table 1.] Standards of installation height and size.

Standards of installation height and size.
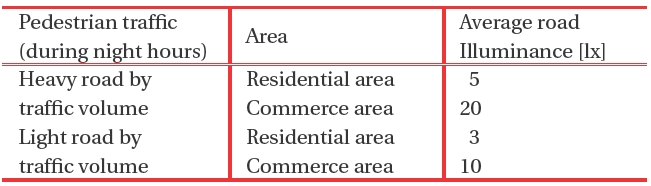
[Table 2.] Illumination Standards for pedestrian light emitting diode safety street lamp.

Illumination Standards for pedestrian light emitting diode safety street lamp.
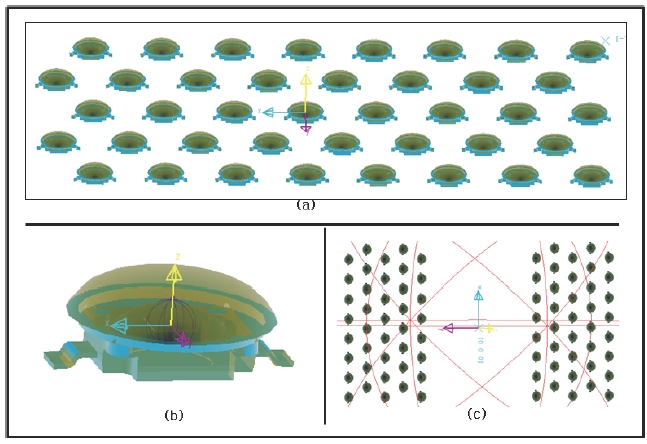
The LED chip and module modeling applied optic properties are shown in Figs. 7(a) and (b), respectively. The chip space of a LED module is applied such that width and length are 18 mm and 36 mm, respectively, and a module has been composed with forty LED chips. The space between two modules is 114 mm due to the position considered by heatsink. Figure 7(c) shows a completed 100 W LED module. The average Luminous intensity and Luminous Flux of the completed 3D modeling are 631.66 cd and 7,937.78 m, respectively.
3.4 Simulation modeling experiment based on KS for safety street lamp
Completed 3D modeling (100 W LED module) has been simulated in KS for the LED safety street lamp, and the KS are summarized in Tables 1 and 2.
Two KS standards are shown in the table, and 3D Modeling has been applied according to these standard conditions.
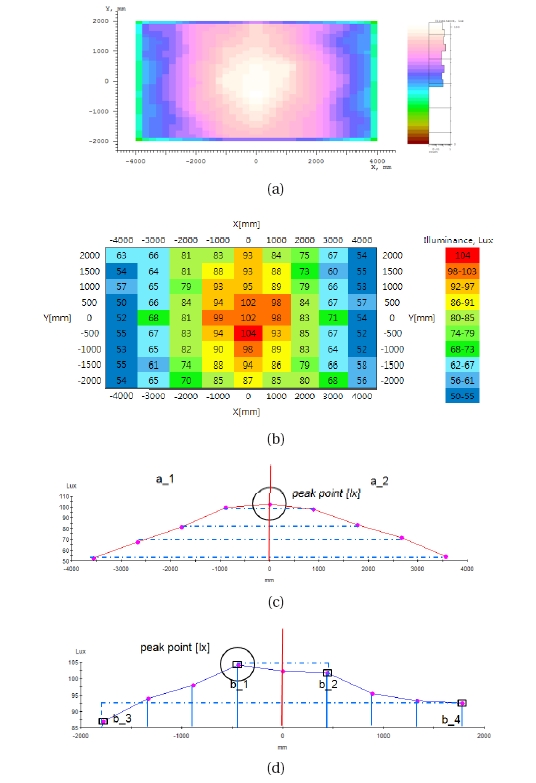
Simulation results at a height of 4 m and an area of 8 m by 4 m are summarized in Fig. 8.
All data are the simulated illuminance distribution on a test area (8 m wide and 4 m long), which is used by a surface receiver. Charts (a) and (b) show each different mesh, and the illuminance is between 50 lx and 104 lx. Here, the average illuminance is about 75.4 lx. Charts (c) and (d) show each different illuminance intensity on the X axis (8 m) and Y axis (4 m).
The center line (0 mm) of chart (c) shows the highest illuminance (about 104 lx), and the b_1 area of chart (d) shows the highest illuminance (about 104 lx), but the peak point location is different for each chart. a_1 of chart (c) is similar to a_2 around the center line at 0 mm. Between b_1 and b_2 and between b_3 and b_4 of chart (d) chart there are different illuminance properties, and it shows each 2 lx and 6 lx difference around the center line at 0 mm. That is why (c) and (d) are the symmetry distribution and asymmetry distribution, respectively.
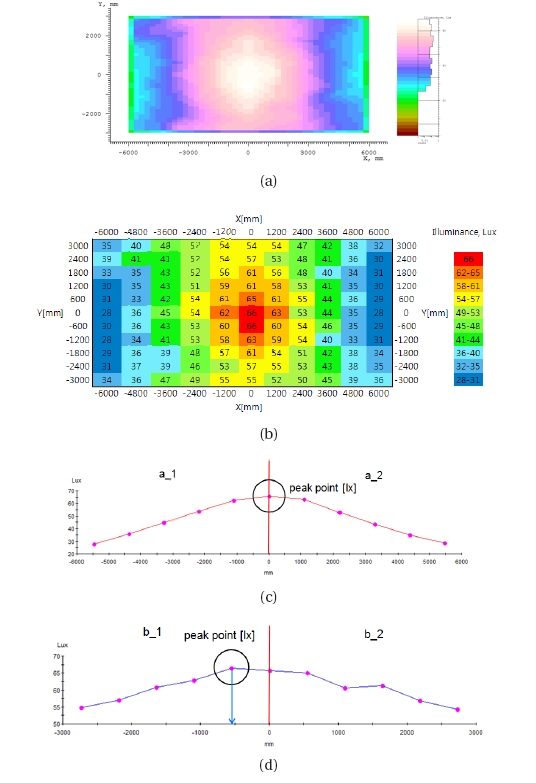
Figure 9 summarizes another simulation result at a height of m and an area of 12 m by 6 m.
Charts (a) and (b) show each different mesh, and the illuminance is between 28 lx and 66 lx. Charts (c) and (d) show each other different illuminance intensity at an area of 12 m by 6 m. The center line (0 mm) of chart (c) shows the highest illuminance (about 66 lx), and chart (d) shows the highest illuminance at the -500 mm area (about 66 lx). a_1 of chart (c) is similar to a_2 around the center line, and chart (d) shows each of the different illuminance properties between b_1 and b_2 around the center line. The total sum of b_1, which is illuminance, is 302 lx, and that of b_2 is 298 lx without the illuminance of the center line.
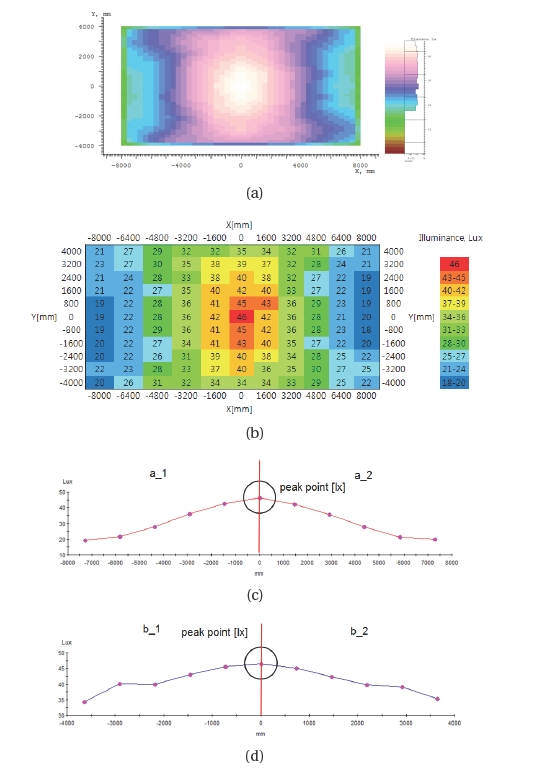
The other simulation result at a height of 6 m and area of 16 m by 8 m is summarized in Fig. 10.
Charts (a) and (b) show 18 lx to 46 lx, while charts (c) and (d) charts show different illuminance intensities at the X axis and Y axis. Chart (c) also shows that the symmetry distribution and peak point location of chart (d) chart has been changed at height of 6 m and area of 16 m by 8 area m.
We have considered that total illuminance of b_1 should be greater than that of b_2, because b_1 is the front side of the 100 W LED luminaries, and b_2 is the back side. Also, heights of 4 m, 5 m, and 6 m showed the properties that are the most ideal conditions in experiment results, and the condition has been applied when 100 W LED luminaires are installed at those heights.
According to the change of height and receiver area, we have confirmed that the peak point and total optic properties have also been changed. All data showed satisfactory results that are acceptable for Korean Industrial Standards of the LED safety street lamp, and the average road illuminance would be better than Korean Industrial Standards.
3.5 Comparison analysis between manufactured 100 W product and 100 W simulation modeling
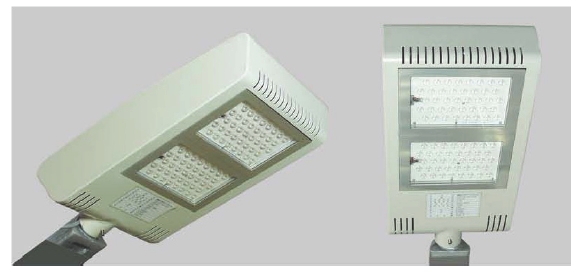
Figure 11 shows the LED luminaires for 100 W safety street lighting (model CE180-ST-OS). A comparison is made between the 100 W product designed by simulation and by 3D modeling The comparison experiments consisted of radiation distribution, luminous flux, and average road illuminance. Light distribution curves based on the 100 W product were tested with the Neo- Light 2000 Goniophotometer tester and the luminous flux measurement used the Everfine_IPMS-50 integrating sphere tester.
The last experiment, which is the average road illuminance of the manufactured 100 W LED safety lighting, analyzed the ies file obtained through the Goniophotometer tester, and ies file was inserted in simulation.
The other experiment was measured only by simulation. In short, the radiation distribution was compared between products used by the NeoLight 2000 Goniophotometer tester and completed 100 W simulation. Luminous flux was compared between products used by the Everfine_IPMS-50 integrating sphere tester and the completed 100 W simulation, and the average road Illuminance was compared between simulations based on the ies file of the real product and the completed 100 W simulation. Figure 12 compares the results of the radiation distribution.
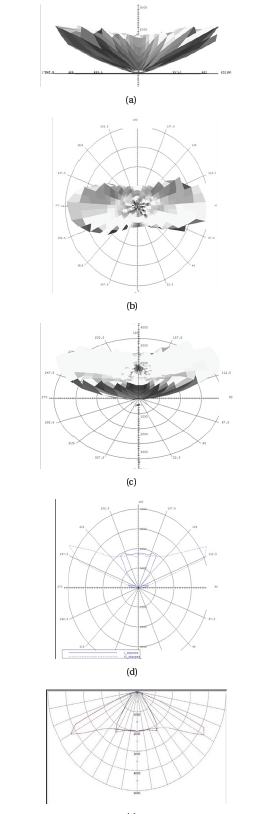
Charts (a-d) based on the simulation show each radiation distribution at different locations. (a) is the front side of the radiation distribution, (b) is the upper side, (c) is the 45 degree side, and (d) is a 2D chart that shows each X axis and Y axis.
Chart (e) is data based on the 100 W product. All charts show that the X axis has 120 degrees and the Y axis has 60 degrees. Also, all angles between simulation data and product data are the same angles. Thus, we confirmed that the precise optical modeling for radiation distribution has been correctly performed. Figure 13 shows results that compare road Illuminance.
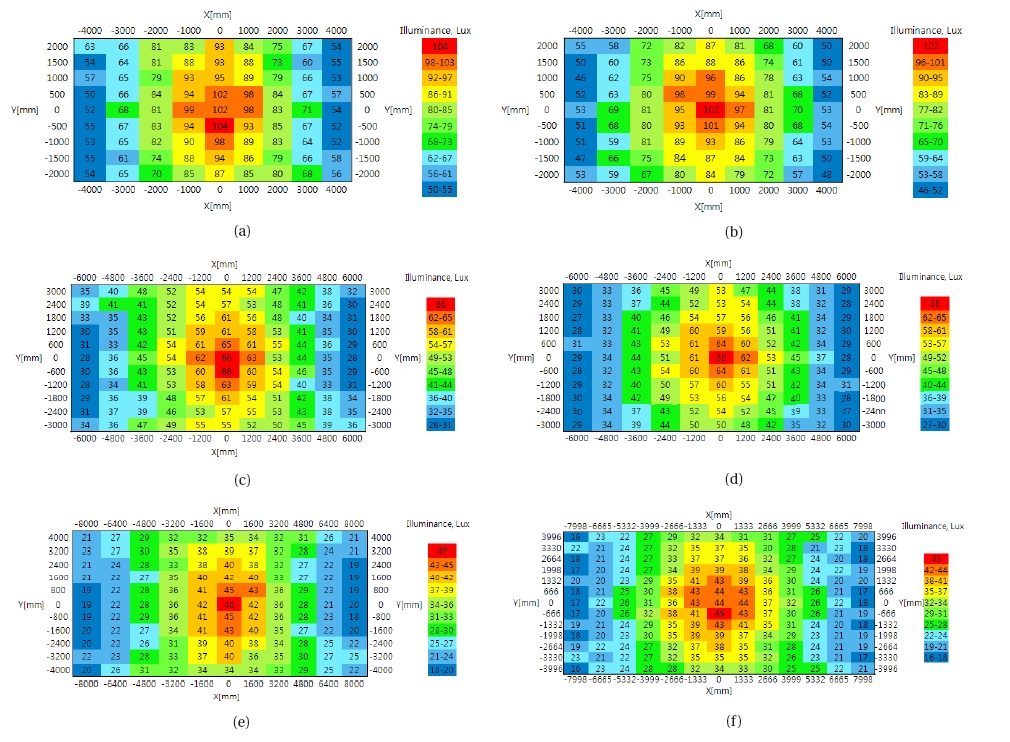
Figures 13(a, c, e) are simulation data, and Figures 13(b, d, f ) are manufactured product data based on the ies file (radiation distribution). Figures 13(a) and (b) show lux at a height of 4 m and area of 8 m by 4 m., The illuminance of (a) is 50 lx to 104 lx, and that of (b) is 46 lx to 102 lx. The average illuminance of each is about 75.4 lx and 72.19 lx, respectively. Figures 13(c) and (d) show each lux at a height of 5 m and an area of 12 m by 6 m. The illuminance of (c) is 28 lx to 66 lx, and that of (d) is 27 lx to 66 lx. The average illuminance of each is about 45.25 lx and 42.62 lx, respectively. Figures 13(e) and (f ) show each lux at a height of 6 m and an area of 16 m by 8 m. The illuminance of (e) is 18 lx to 46 lx, and that of (f ) is 16 lx to 45 lx. The average illuminance of each is about 30.05 lx and 28.21 lx, respectively.
Error rates between manufactured product and simulation modeling are 4.3% at a height of 4 m and an area of 8 m by 4 m, 6.1% at a height of 5 m and an area of 12 m by 6 m, and 6.5% at height of 6 m and an area of 16 m by 8 m.
In this study, optical analysis including both precise simulation and comparison experiments was conducted. Experimental results demonstrated that the illumination design of this lamp was acceptable for the Korea standard. The feasibility of the numerical model was proven by comparison of the simulations with the experimental data. The simulations and the corresponding analysis demonstrated that the tested 100 W LED safety street lamp had reasonable performance in average road illuminance, but error rates averaged 5.6%. Error rate is considered such that each different property of eighty LED chips was caused by thermal loss of the semiconductor and by change of radiation distribution according to location of the Electron-Hole Pair [9]. This study of the 100 W LED safety street lamp will be useful for evaluation and analysis.