Composites are produced by mixing different materials having different properties for specific purposes. These are new types of materials that include some additional functions, such as a light weight, design flexibility, corrosion resistance, fatigue resistance, and dimensional stability, by combining two different materials[1]-[8]. The composites used in power cables represent specific types, like ethoxybenzoic acid (EBA)+carbon black (CB), ethylene vinyl acetate (EVA)+CB, and other various composites.
The power cables used in the present time consist of a conductor shield, insulation, an insulation shield, a neutral wire, and a sheath around the core. Each shield has its own function and some of the malfunctions in these shields occur from the insulation breakdown in an insulation shield, thereby causing trouble in the power cables[9]-[11]. The conduction shield and insulation shield together are called a semiconductive shield.
In general, a semiconductive shield is produced by mixing additives, such as a large amount of conductive CB, an antioxidant, an activation agent, and an interfacial activation agent, into olefin polymers, such as EVA, ethylene ethyl acrylate (EEA), and EBA.
The semiconductive shield significantly affects the electrical properties, including the thermal, the mechanical, and the structural properties of the cables, according to the applied type of carbon nanotube (CNT) and CB and additives. Therefore, the thermal, mechanical, and structural properties that are determined by the contents of the CB need to be understood as they apply to power cables[12]-[15].
The semiconductive shield materials used in power cables include a large amount of CB. The spherically shaped CB has a higher specific gravity than that of the long tube shaped CNT.
Based on these properties, it is very significant to study the use of CNTs, for they show a sufficient efficiency in thermal properties to require only the use of a small amount of CNTs as compared to a production process that adds about 35-40 wt% of CB in order to achieve the required semiconductive properties for a semiconductive shield materials process.
Because such complex materials using CNTs show a wide contact area compared to that of reinforced materials, it has become attractive as a new material that is able to perform various functions by improving the mechanical, thermal, and electrical properties [16]-[18].
Therefore, this study measured the thermal dynamic mechanical analysis (DMA) and the chemical Fourier transform infrared spectroscopy (FT-IR) properties in such a semiconductive shield consisting of CNTs and CB.
The polymer matrix employed in this study was EEA (Dupont-Mitsui Polychemicals. Co., Ltd., Tokyo, Japan), acetylene CB (LG Chemical, Seoul, Korea), and CNT (Iljin Nanotech Co., Ltd., Seoul, Korea: CM-95, 10-15 nm in diameter, 10-20 um in length, and purity>;95%). The composition of the specimens applied in this paper was controlled in order to investigate the synergy effects in the application of the two different filling materials. The composition of the polymer nanocomposites are shown in Table 1.
The additives used in this experiment consisted of an antioxidant (polyethylene glycol400, 0.12 wt%), a crosslinking accelerant (di-n-butyltin dilaurate, 0.08 wt%), a thermal stabilizer (Zn-St, 0.02 wt%), and a flame retardant (magnesium hydroxide, 0.02 wt%).
To review the influence in accordance with the filler'scontent, the EEA polymer matrix was fixed at 10 wt% aboutthe filler's content and we reviewed the influence change bythe ratio of the CNTs to the CB.
2.2 Fabrication of the specimens
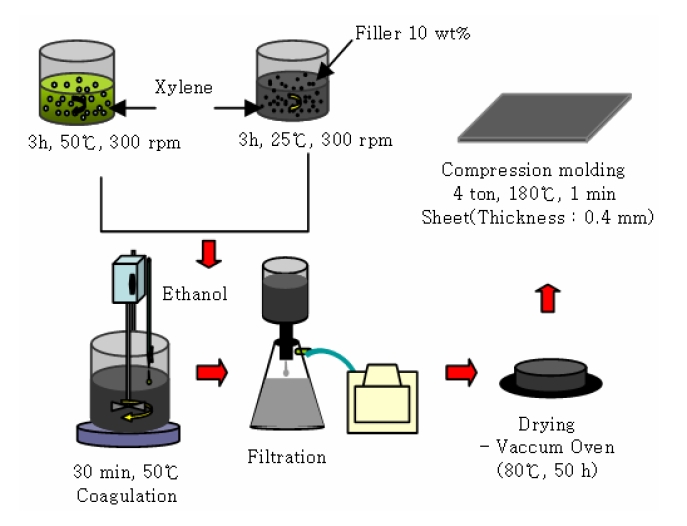
The production methods used for power cables are classified as melt blending, solution blending, and in-situ polymerization. As illustrated in Fig. 1, this experiment applied a solution blending method that increases the dispersibility of the nano particles and is able to ignore extra additives. Precipitations were then produced by applying the uniquely mixed EEA solution and the CNT dispersion solution.
[Table 1.] Compound formulation.
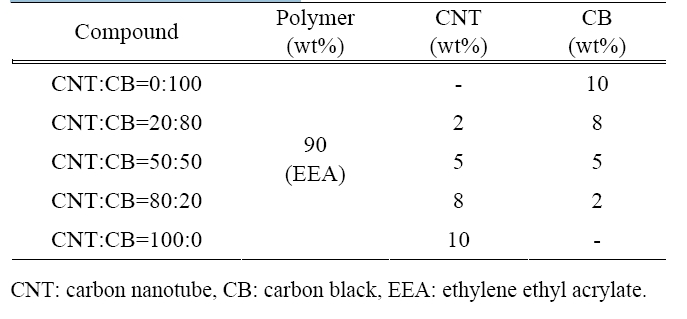
Compound formulation.
The materials produced from the filtration and drying process of the precipitations were compressed to form sheet shaped specimens.
A DMA 2980 system was used to measure the glass transition temperature, the storage modulus, the loss modulus, and the energy loss of the specimens. This system measures the viscoelasticity and damping of the specimens according to changes in temperature and frequency when a sinusoidal shaped and vibrated external force is applied to the specimens [19].
The experiment performed in this paper was applied from -50℃ to 100℃ with an incremental rate of 4 ℃/min at 1 Hz in a nitrogen atmosphere in order to investigate the storage modulus and loss modulus of the specimens. The glass transition temperature was observed using the Tanδ data.
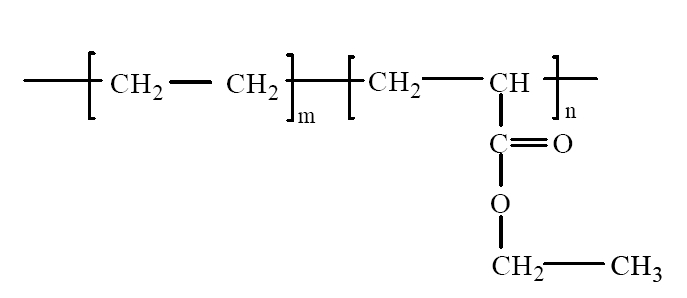
If it was maintained at some degree, the polyolefin resin, that includes a carboxyl functional group (C=O) as shown in Fig. 2, showed an oxidation reaction every time.
The oxidation reaction was accelerated by adding CB that included a carboxyl functional group, showing impurities in the semiconductive materials.
To detect the carboxyl functional groups, the SensIR technologies company of Travel IR was used.
Because the viscosity found in the viscoelasticitycharacteristics of polymer materials can not respondinstantaneously for a given external force, the changes willbe presented with a certain interval compared to the stress.The response intervals can be expressed as phase differences.In general, the moduli of the polymer materials are classifiedas the storage modulus M', and the loss modulus M''.
As mentioned, the moduli of the viscoelastic polymers are classified as the storage modulus, the loss modulus, and the Tanδ, which represents the ratio between the storage and the loss energies.
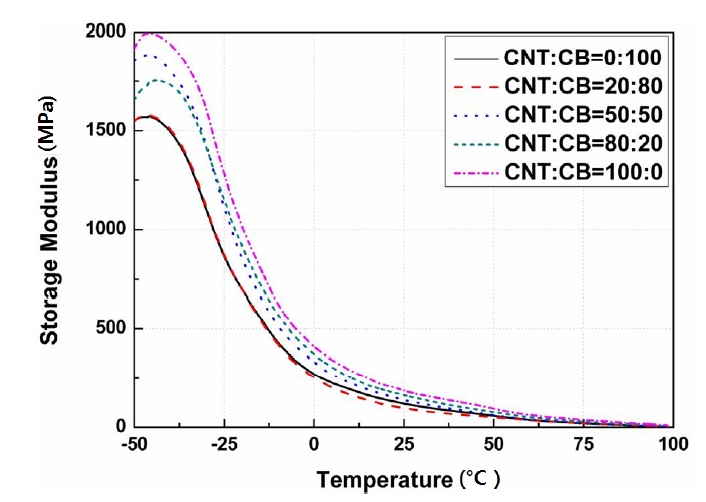
Figure 3 represents the storage modulus according to the contents of the CNT and the CB. It demonstrated that the
storage modulus increased according to the increase in the CNT content, except for the ratio of CNT:CB=80:20. The storage modulus that showed a small retardation according to an increase in temperatures rapidly decreased when the temperature approached -40℃. This range was a section that consumes the energy as a form of heat.
Interestingly, the highest peak of the loss modulus was actually recorded in this section. This was due to the glass transition temperature. The glass transition temperature is a unique material value and shows a starting point in materials from a glass phase to a rubber phase and is also a starting point for molecular movement [20]-[22].
The specimen determined by the ratio of CNT:CB=80:20 showed a decrease in its mechanical properties due to the decrease in the storage modulus according to the increase in the temperature.
Figures 3-5 show the storage modulus, loss modulus, and the Tanδ, respectively, according to the contents of CNT and CB ranged from -50℃ to 100℃.
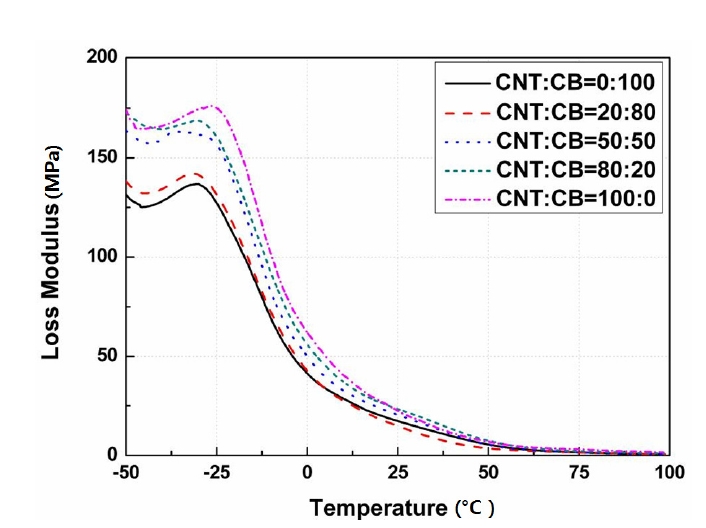
Figure 4 shows the loss modulus according to the change in the contents of CNT and the applied temperatures. It also increased according to the increase in the contents of CNT.
The section that showed the specimen peak corresponded to the glass transition temperature as mentioned above.
In addition, it can be regarded that the transition temperature was combined at around - 40℃ due to the single peak [23].
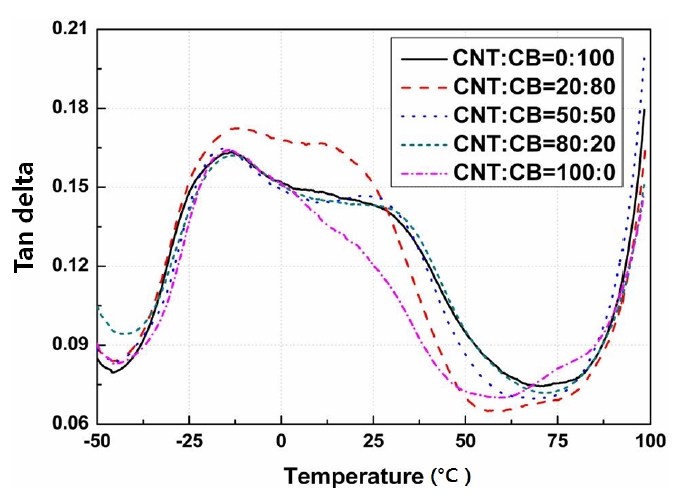
Figure 5 shows the value of the Tanδ that is determined as a ratio between the storage and loss moduli according to the contents of the CNT and the CB with the applied temperatures. The Tanδ curve determined according to changes in temperature generally shows the movement of a small group of polymer chains and the interfacial characteristics for a different type of material.
Therefore, the changes in the peak of the Tanδcurves occurred due to the binding between the textiles in the composite system and these micro transitions changes by the effects of the plasticizers are also observed. The mechanical damping refers to the amount of energy, which is dissipated as a form of heat, during the modification period of the materials.
The materials that have a certain level of viscoelasticity have stress applied, store a part of these applied energies as potential energies and dissipate a part of these applied energies as heat, therefore the storage modulus and loss modulus that correspond to the stored energies and dissipated heat, respectively, can be used to measure the value of the Tanδ (mechanical damping).
The Tanδ showed similar values except for the ratio determined by CNT:CB=20:80.
This means that the specimens with the ratio of CNT:CB=20:80 showed the largest energy losses according to the increase in temperature.
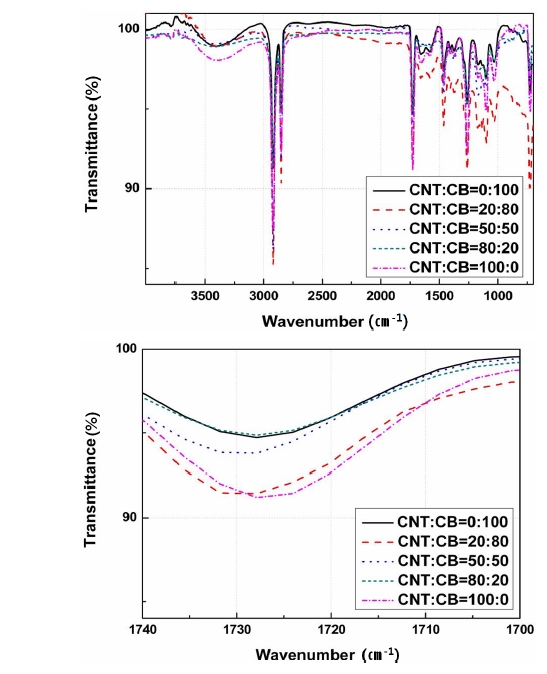
Figure 6 shows the FT-IR spectrum of the CNT reinforced material specimen that adds a content of 0-10 wt%. It checks the carboxyl group of a specific wavenumber from around 1,725 cm-1.
Although the oxygen-hydrogen group that is represented by a wide peak around 3,500 cm-1 and the unsaturated double bond at around 900 cm-1 are to be expected, this experiment mainly investigates the carbonyl group that has a
peak around 1,725 cm-1; this is used as a method for verifying the oxidation reaction and the type of oxidation process. Figure 6(b) shows carboxyl group’s transmittance that is indicated by the peak near 1,725 cm-1.
Transimittance is defined as the possibility of knowing the integral calculus of the dimensions and Beer-Lambert’s law but this paper applies only to Beer-Lambert’s law.

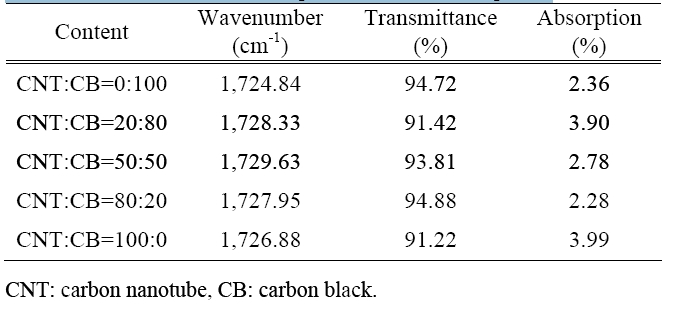
The CNT reinforced material specimens are shown in Table 2.
The specimens of the CNT reinforced material show that the transmittance was about 91.42-94.88% and the absorption was about 2.28-3.99% according to the increase in the content of the CNTs.
The CNT reinforced material specimen show high transmittance and low absorption. This means that the carboxyl groups are few.
[Table 2.] Transmittance and absorption of the nano-composite.

Transmittance and absorption of the nano-composite.
This paper fabricated nano-composite semiconductive shield materials using a solution blending method and investigated the viscosity characteristics according to the change in the contents of the CNTs and the CB. The results of this paper can be summarized as follows: The storage modulus in the DMA experiment increased according to the increase in the contents of the CNTs. It also showed an increase in the loss modulus according to the increase in the contents of the CNTs except for the ratio of CNT:CB=20:80. Finally, although the contents of CNT did not significantly affect the Tanδ experiment, which was applied to measure energy losses, the specimens with the ratio of CNT:CB=20:80 showed high Tanδ values compared to the other specimens. This means that high Tanδ values showed high energy loss. Thus, the materials with a high level of the CNT play a role in excellent nano-composite semiconductive shield materials. Carbon nanotube reinforced material specimens show high transmittance and low absorption. High transmittance and low absorption means there are few carboxyl groups. A polyolefin resin that has a carbonyl group can generate an oxidation reaction at a sufficient level of temperature and oxygen. Based on these results, the CNT added semiconductive shield materials demonstrate stable characteristics.