A hollow cathode discharge (HCD) plasma is widely used as a convenient emission source or atomic vapor source. The optogalvanic (OG) signal is a result of the discharge plasma impedance variation caused by the absorption of radiation during spectral transition of the plasma medium. The OG effect technique was developed for the purposes of laser spectroscopy [1] and thus has been widely used for frequency stabilization, wavelength calibration [2], [3], atomic and molecular spectroscopy [4], isotopic analysis [5], plasma diagnosis [6], and the Penning ionization effect [7]-[9].
The positive (voltage increase) or negative (voltage decrease) in OG signals can be explained by the change in the density of the metastable level [10]. This change plays an important role in the following multistep ionization electron impact process in which Ar* (1s5) was set at the lowest metastable level.

Since metastable atoms play a central role in ionization during discharge, the ionization electron impact process that affects their concentration is expected to change as the voltage and current characteristics change. The observed discrimination against the discharge gas can be partially explained through consideration of the electron impact. An average mean electron energy (electron temperature) in a in a low pressure glow discharge has been reported to be in the 2-4 eV range [11], [12]. Although this average energy is not sufficient to ionize many elements in the discharge, a certain fraction of the electrons will have energy in excess of all the elemental ionization potentials. Chapman [12] showed that for electrons with an average energy of 2 eV, 0.13% of the electrons will have an energy above the ionization potential of argon, 15.76 eV; whilst at 4 eV average energy this proportion increases to 5.1%. A significant contribution to the ionization of the discharge gas may occur through ionization occurring during its excited metastable state. The electron energy required for ionization would then be much less than the direct ionization mentioned above. Ar in the 11.55 eV metastable states requires an electron energy of only 4.2 eV, whilst 15.76 eV is required for ionization occurring during the ground state. For a discharge with average electron energies of 2 eV, 27% of the electrons will have the energy necessary to cause ionization at the metastable level. At a 4 eV average energy, this percentage increases to 59%. So although there will be fewer metastable than ground state atoms in glow discharges, there will be many more electrons capable of ionizing the metastable atoms than there are electrons capable of ionizing the ground state atoms. Therefore, metastable atoms play a key role in ion production in glow discharges.
The inter-electrodes, which were close enough to make only two regions in the hollow cathode discharge, the cathode dark space and the negative glow region, were located in the radial direction [13].
These discharge regions were well defined visually by monitoring the appearance of the plasma emission [14]. The cathode dark space was very dim showing a strong electric field region where nearly all the cathode voltage dropped across a relatively small distance. Therefore, the strength of the electric field decreases linearly towards the negative glow region and the negative glow region is almost entirely electric field-free. The primary source of ionization in the hollow cathode discharge is caused by electrons, which are ejected from the cathode surfaces by ion bombardment. The ejected electrons are consequently accelerated in the cathode dark space in the negative glow region and obtain a nearly full cathode fall voltage. A fraction of the electrons pass through the negative glow region without interaction and enter the opposite dark space where they can produce new ionization. The electrons create a near uniform ionization source, which is very efficient because electrons are trapped in the inner space between the walls of the hollow cathode due to the fact that they are repulsed by the opposite walls. The ions that have been created in the negative glow region diffuse into the dark space where they can be accelerated to the cathode by the high electric field. As the ions impact the cathode surface, they cause electron emission and also cause the cathode surface to sputter i.e., the cathode metal discharges electricity and heat. As a result of the electron avalanche process involving the multiplication of electrons, the electron density increases in the negative glow region. These electrons are responsible for the extraordinary properties of the hollow cathode discharge.
In this work, the spatial distribution of the OG signal amplitude at 801.489 nm in Ar in a hollow cathode discharge tube was measured. For this purpose, the spatial distribution of the emission intensity at 801.479 nm (1s5- 2p8) in Ar in the radial direction of the hollow cathode discharge was measured. The magnitude of the OG signal has a close relation to the spatial distribution of the emission intensity. The OG signal amplitude is an order of magnitude higher in the cathode dark space than in the negative glow region at all current levels. At low currents the OG signal is positive and has its minimum signal level at the center of the tube. Increasing the current causes the amplitude of the OG signal at the center to decrease to zero. At high currents the OG signal is negative.
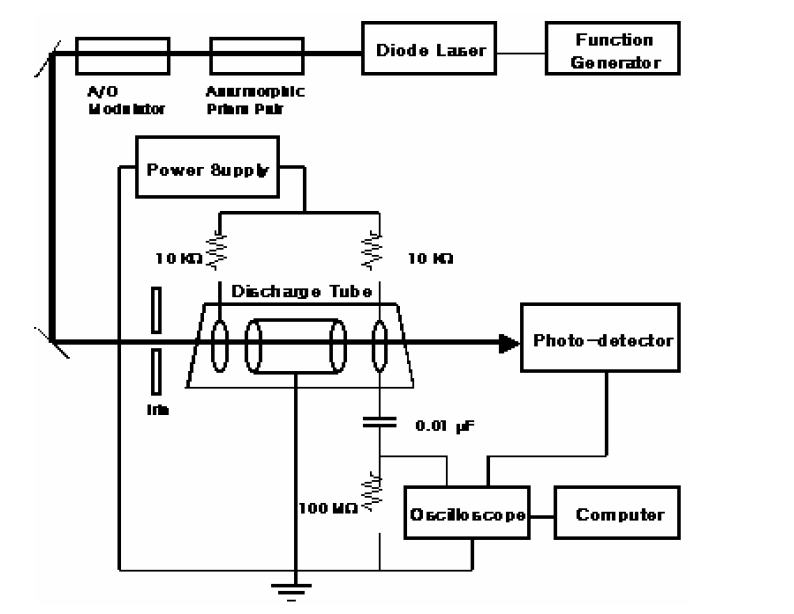
The experimental setup is shown schematically (see Fig. 1). Commercial cylindrical hollow-cathode tubes were used (model 3QQAY/Gd, 3QQAY/U; Cathodeon Ltd., Cambridge, UK). The tubes were filled with argon gas at a pressure of about 3 Torr. Each tube contains a hollow cathode. The cathode is cylindrical and made of gadolinium and uranium. The cathode has an inner diameter of 2 mm and a length of 20 mm. It also has two ring-anodes. The discharge was produced by a high voltage power supply (model series 105; Bertain Associate, Inc.). Current limiting resistors of 10 ㏀ were used for each anode and the OG signal was measured by blocking the dc voltage using a coupling capacitor of 0.01 F. For the measurement of the OG signal, we used a single mode diode laser, which has a center wavelength of 810 (model ECU-2010; Environmental Optical Sensors, Inc.). A diode laser is an appropriate light source for studying the Ar discharge because most lines for the 1s-2p transitions of Ar are located in the near-infrared wavelength region [15].
An anamorphic prism pair and iris diaphragm with a 0.5 mm diameter were used to create an appropriate laser beam shape. The shapes of the beam after reflection off the anamorphic prism pairs was directed by an acousto-optic modulator (model N23080- 1-95; NEOS Inc., Iowa city, IA,
USA), which serve as a beam chopper as the beam passed through the iris. An acousto-optic modulator connected to a function generator (model 8116A; Hewlett- Packet, Palo Alto, CA, USA) was used as a beam chopper to switch the laser beam on and off. The laser beam power in front of the hollow cathode discharge tube was 1 mW and more than 90% of the input power was transmitted through the HCD tube with the discharge off. With the laser wavelength fixed at the center of a transition line of Ar, the dynamic OG signal and absorption signal were obtained with a digitizing oscilloscope (Hewlett Packard 54600B, 100 MHz). The discharge circuit contained a ballast resistor of 100 ㏁ in series with the tube in order to maintain an approximately constant current through the tube and to convert the impedance change of the tube into easily measurable voltage changes across the tube.
In this experiment, the cylindrical cathode used was openended on both sides and was placed between two hollow anodes. The use of two anodes ensured that the whole length of the cathode bore was covered with a negative glow in the axial direction. However, the cathode dark space and negative glow region placed the hollow cathode discharge mainly in the radial direction. This design allows the device to be operated with the negative glow region trapped within the cathode cavity, thereby reducing the voltage required, and enhancing the electron multiplication. The hollow cathode represents a unique source of dense and stable plasma generated by the hollow cathode effect. This effect is created by the oscillation of hot electrons between a repulsive potential drop at the opposite wall in the cathode when these walls are close to each other. This causes the interaction in the adjacent negative glow region. Hence the electron density increases in the negative glow region. The electron density and associated current in the cathode dark
space decrease linearly as the current approachs the cathode wall [16]. The thickness of the cathode dark space is clearly reduced and the emission of light from the negative glow becomes more uniform as the pressure increases [17].
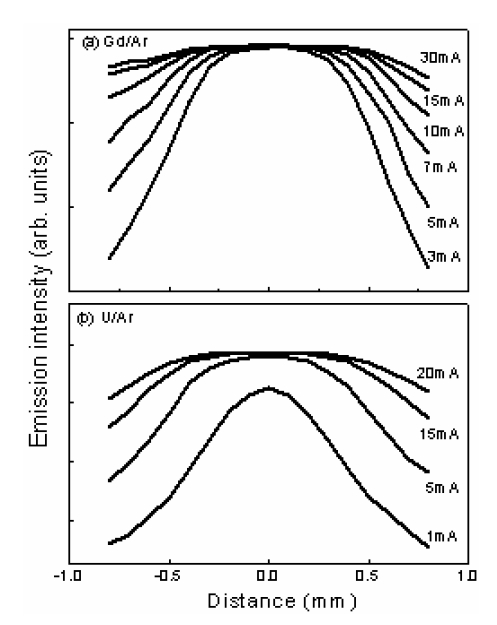
The emission intensity for Gd/Ar and U/Ar hollow cathode discharges in the radial direction at various discharge currents is shown in Figs. 2(a) and 2(b), respectively. The distribution of the emission intensity in the discharge space is nearly uniform, where emission intensity reaches its minimum level. In the current range beyond 5 mA, the emission intensity is almost uniform in the negative glow region and decreases towards the cathode wall, as shown in Fig. 2. This result is consistent with earlier experimental observations reported by Martinez and Amare [17]. They studied the radial profiles of the light intensity at discharge pressures of 11, 53, and 200 Pa. In pressure ranges greater than 110 Pa, the emission of light from the negative glow region is more uniform. At a pressure of 200 Pa, their measurements were in exact accord with the measurements shown in this experiment.
Since the buffer gas fills the discharge space uniformly, the spatial emission distribution of buffer gas atoms approximates the characteristics of the spatial distribution of electrons in the discharge. Therefore, the electron density in the negative glow region is higher and almost uniform. In the cathode dark space, the electron density decreases in a nearly linear fashion relative to the distance of the electrons from the cathode wall. The hollow cathode discharge is a
very a useful tool in the production of a stable plasma in the negative glow region.
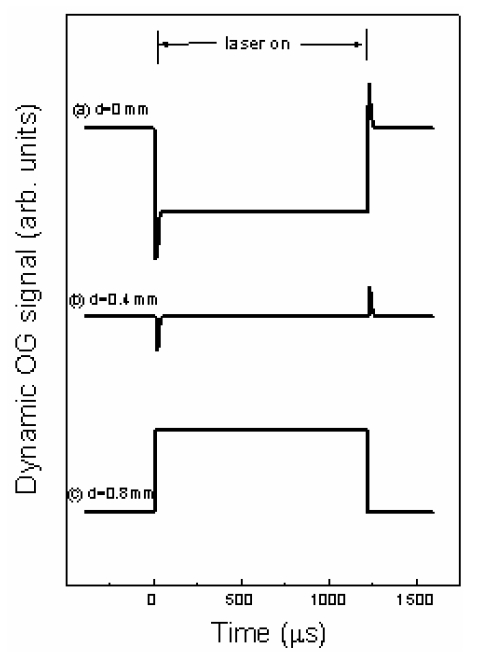
The OG signal in the negative glow region and the spatial distribution of the OG signal amplitude across the diameter of the Gd/Ar hollow cathode discharge, at different discharge currents, are shown in Figs. 3(a), 3(b) and 3(c), respectively. In order to understand the reason why the transition of OG signals occurs at 1s5-2p8, we should consider the effect of light perturbation on characteristic quantities of the discharge, such as the current and the voltage. When the laser beam is switched on, two atomic processes may be generated by the perturbation of the population distribution amongst relevant atomic levels [18]- [22]. Laser excitation of the metastable atoms cause the depletion of those atoms because they decay to the ground level, passing through short-lived resonant levels as they decay (1s2, 1s4). This leads to an increase in impedance. At the same time, excitation to a higher level enhances the ionization due to collisions with electrons and leads to a decrease in the impedance. If the current in the system is constant, then these two processes end up competing with each other, producing a change in voltage.
Figure 3(a) shows the dynamic OG signals at 801.479 nm (1s5-2p8) in a Gd/Ar hollow cathode discharge at a current of 10 mA. In this experiment, a positive voltage component is an indication of increased discharge impedance upon laser irradiation due to depletion of the metastable atoms as they decay to the ground state. The typical OG signal amplitude first decreases (to a negative value) and then rises above the steady state positive value and finally reaches an equilibrium value after 33 s; an explanation of which is given below. When lasers excite electrons to higher levels, the ionization energy decreases. This allows a large number of electrons to ionize argon atoms in the higher 2p levels. As a result, the discharge conductivity momentarily increases and the voltage across the discharge tubes decreases, reaching the negative peak/minimum value at about 8.5 s, After a fast relaxation, this is followed by a positive component signal at 17 s, reaching the steady-state value at about 33 s.
As the discharge current increases, the OG signal is negative because the electrons have sufficient energy for electron impact ionization of the excited levels. Furthermore ionization at the 2p levels is more easily achieved than the ionization of atoms in the metastable state. Thus, this process enhances ionization upon irradiation under all discharge conditions. This effect readily accounts for the negative voltage changes observed at high currents, as shown in Fig. 3(b).
With regard to the OG signal, the steady state value of the positive component moves toward the negative direction as the current increases. In other words, positive signals are due to radiative decay of the metastable atoms and the negative signals are due to collisional ionization. This effect can be confirmed by monitoring the dynamic OG signals, as shown in Figs. 3(a) and (b). In the negative glow region, the OG signal is positive at a discharge current of 10 mA. The steady-state of the signal decreases to zero at 15 mA and it becomes negative at a discharge current over 20 mA.
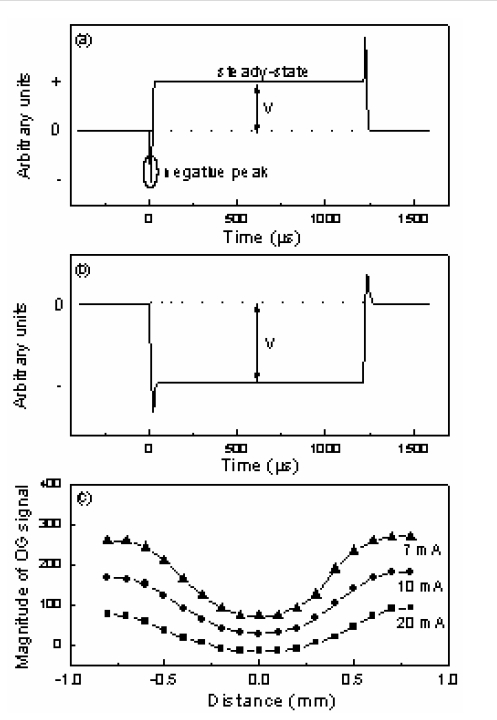
Figure 3(c) shows the amplitude of the dynamic OG signal measured at different positions of the discharge in the radial direction. The amplitude of the OG signals was quantified by using the difference between the baseline and steady-state value of the dynamic OG signals, see Fig. 3(a) and (b). The amplitude of the OG signal becomes uniform and reaches its minimum level in the negative glow region. As the cathode dark wall is approached, the negative spike disappears in the OG signal and the amplitude of the OG signal increases as shown in Fig. 4.
The dynamic OG signal at various positions in the radial direction is shown in Fig. 4. Figure 4(a) shows the OG signal at the center of the cathode at 20 mA. The effect of the increased collisional ionization rate at higher current readily accounts for the negative voltage of the steady-state. At the periphery of the tube near the cathode wall, a reduction in the spatial distribution of electrons occurs, as shown in Fig. 2. The ionization rate caused by electron impact is negligible, which results in an increase in the discharge impedance. Thus, the OG signal has a positive voltage in the steady-state and the fast negative component is not generated in the cathode dark space, as shown in Fig. 4(c). In the intermediate region, the competition between the
two atomic processes becomes equal, and the steady-state value of the OG signal becomes almost zero, as shown in Fig. 4(b). The OG signal has a maximum amplitude in the cathode dark space and it decreases by about one order of magnitude in the negative glow region at all currents studied.
The measurement of the dynamic OG signal amplitude and emission intensity across the diameter of the hollow cathode demonstrates the spatial distribution of electrons in a hollow cathode discharge. The distribution of electrons is almost constant in the negative glow region. In the dark space the distribution of electrons decreases linearly as the cathode wall is approached. The amplitude and sign of the OG signal have been shown to be both a function of the discharge current as well as the radial position of the illuminating laser beam.