Most photovoltaic solar cells currently produced are based on silicon p-n junctions [1]. However, there is an increasing interest in dye-sensitized solar cells (DSC)s because only simple materials and equipment are required for their manufacture, and the production costs are potentially low. Also they, have achieved adequate and stable conversion efficiencies in small-area cells [2]. A DSC differs from conventional semiconductor devices in that the functions of light absorption and charge carrier transport are separate. In the case of n-type materials, such as TiO2, current is generated when a photon absorbed by a dye molecule gives rise to electron injection into the conduction band of the semiconductor [3]. In this work, the photoelectrode of a DSC consists of a 10~20 μm thick film of TiO2 particles that have a monolayer of absorbed dye molecules. The TiO2 layer on FTO glass plays a vital role in increasing the active surface area i and also in maximizing photon absorption. During the fabrication of a DSC, a nano-porous TiO2 photoelectrode was formed with statistical methodology.
A key issue in the development of such devices is the optimization of interactions between the sensitizer dye and the nanocrystalline metal oxide, and in particular the optimization of the injection process [4]. Most of the previous works on DSC development were focused on the relationship between certain parameters and device performance. In order to improve processing performance or to obtain a process that is robust to external sources of variability, statistical design of experiments (DOE) have been used either in process development or process troubleshooting [5]. They can also be very useful in establishing the statistical control of a process. However, only few of the published research studies have utilized the relatively recent developed statistical testing method known as the statistical design of experiments (DOE), to assist in the study of the production of DSCs. In the present, we have characterized and predicted the process parameters in fabrications of TiO2 deposited photoelectrodes with several controllable factors that affect to the final power conversion efficiency and others.
2.1 Fabrication of dye-sensitized solar cells
TiO2 powder, P25 (Degussa, approximately 70% anatase and 30% rutile) and NT-12 (Nanoin, approximately 87% anatase and 13% rutile) were prepared from a deposition on FTO glass, respectively. FTO glass was applied to the photo and counter electrode after an organic cleaning process.
For preparation of the TiO2 solution, 6 mL of D.I. water was injected into 1.2 g of colloidal TiO2 powder and ground with a pestle to obtain a more porous structure. 100 μL of acetyl acetone (Sigma Aldrich) and 120 μL of acetic acid (Sigma Aldrich) were added to TiO2 powder in order to sustain TiO2 particles in a colloidal state. Furthermore, 100 μL of Triton X-100 (Junsei) were added to the precursor in order to fully disperse the TiO2 nano particles. Poly ethylene glycol (PEG, Sigma Aldrich, MW 1000) and poly ethylene oxide (PEO, Sigma Aldrich, MW 10000) were employed as chemical binders to provide additional forces between molecules. With magnetic bar stirring, this colloidal TiO2 was equally mixed for 6 hours followed by deposition on organic cleaned FTO glass using a doctor-blade whose dimensions were 1cm x1cm. This conductive glass was then dried at room temperature. Finally, the deposited glass was annealed for 10 minutes at 100°C and for 30 minutes at 500°C in tube type furnace [6].
In this study, Ruthenium 535 bis-TBA (known as N719, Solaronix S.A., Switzerland), which sensitizes TiO2 very efficiently was used as the dye for causing photons to be absorbed into the DSC. The dye [cis-bis(isothiocyanato) bis(2,2'- bipyridyl-4,4'-dicarbo xylato) ruthenium (II) bistetrabutylammonium, N719] was absorbed by immersing the TiO2 photoelectrodes for 12 hours in a 0.5 mL ethanol solution [7]. The highly porous oxide layer acts like a sponge and there is very efficient uptake of the dye. Iodidetriiodide couple (I- / I3-) was fully implemented as the redox mediator. The gap between the TiO2 photoelectrode and carbon counter electrode is then filled with a low-volatility electrolyte of 0.5 M LiI, 0.05 MI2, and 0.5 M 4-tert-butylpyridine in 3-methoxy-propionitril which had been injected by capillary force into the inter-electrode space [8].
Carbon blacks and activated carbon were used as counter electrodes in this research. In order to obtain a carbon paste, 0.2 g of the carbon black powder was sequentially ground in a mortar with 1 g of activated carbon, carboxy-methylcellulose (CMC) as a binder, 16 mL of D.I. water, and 5 mL of ethanol. The ground carbon paste was coated on FTO glass by a doctor blade followed by sintering for 1 hour at 150oC in a tube furnace.
The photoelectrode and counter electrode were sandwiched with a 50 μm thick spacer made from thermobonding tape and heated for several seconds to seal it on three sides except leaving one side unsealed. The unsealed side allowed the injection of liquid electrolyte between the two electrodes. After sealing, the liquid electrolyte was injected into the space between the two electrodes using a syringe.
Experiments in this study were designed and analyzed statistically based on the method of the statistical design of experiments (DOE) with the aid of a statistical analysis program. For more systematic design and analysis, the full
factorial design method was performed with three controllable factors, each with two possible levels, in this study. Application of this technique to the current experiments was useful in determining the factors(s) (TiO2 particle size (21 and 30 nm diameter), PEG/PEO wt% (20 and 40 wt%), the amount of Triton X-100 (10 and 30 μL)) that has the greatest influence on the performance characteristics of DSC and the process results. It was considered that the performance characteristics were the open- circuit voltage (Voc, mV), short-circuit current (Isc, mA), fill factor (FF), and energy conversion efficiency (Eff., %).
A set of experimental data was acquired from 23 full factorial designs with 2 center points followed by 1 repetition process to characterize process variations with three controllable input factors, those contained in each of two levels. Thus, the number of total experiments was 20. Using statistical analysis performed with a custom statistical package, the statistical design of experiments based on full factorial design was achieved.
Most of the statistical analysis methods depend on the assumption that the data sets are sampled from a normal (or Gaussian) distribution. However, most actual data from experiments unfortunately do not follow the normal distribution [5]. It is necessary that data sets not following to normal distribution should be transformed using an appropriate technique.
With the four interesting performance characteristics (Isc, Voc, FF, and efficiency), the normality test was fully employed before the analysis. The results for Isc and FF fell below the normal distribution. However the others data sets involving Voc and the efficiency, did not fit to the normality test. So The Box-Cox transformation (BCT) was followed to make them the normal distribution. This transformation can be used to attempt to impose linearity, reduce skewness or stabilize the residual variance [9]. After the normality test, a full model was first investigated to check the main effect and 2-way interactions. The main effect plots are for individual effects of each input parameter. If the slope is zero or lies
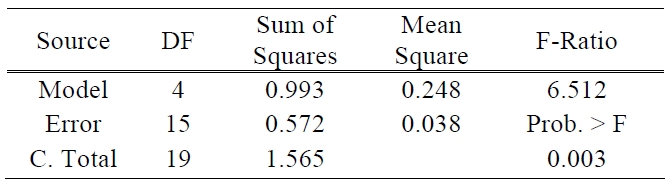
[Table 1.] ANOVA table for efficiency.

ANOVA table for efficiency.
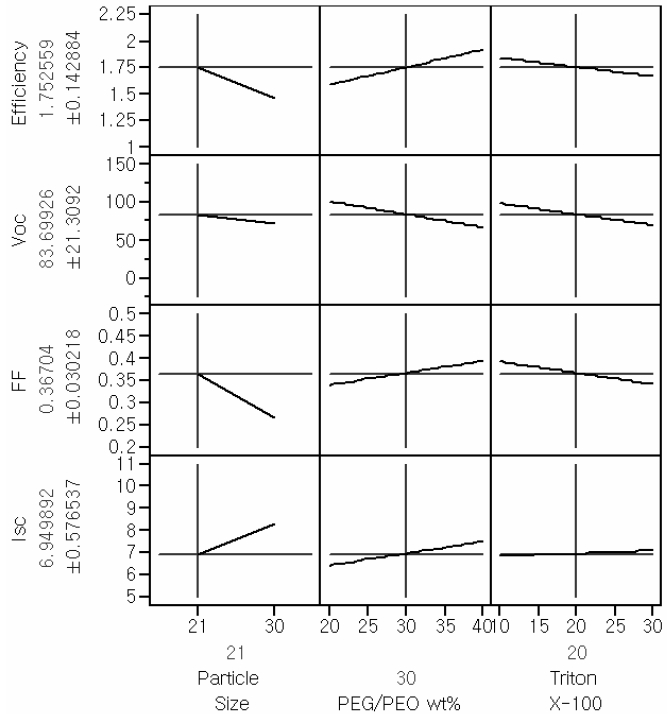
horizontal in the main effect plots, the corresponding parameter has no effect on the response of interest. The Main effect profiles for the responses of interest are provided in Fig. 1.
As shown by the main effect plot provided in Fig. 1, the main effect of the particle size is the most significant factor that affects Isc and FF; thus, the efficiency is also affected by the size of TiO2 particle. Even though the main effect of Triton X-100 on Isc was less significant than the other main effects, this term could not be eliminated. This kind of otherwise insignificant factor can influence the interaction profiles.
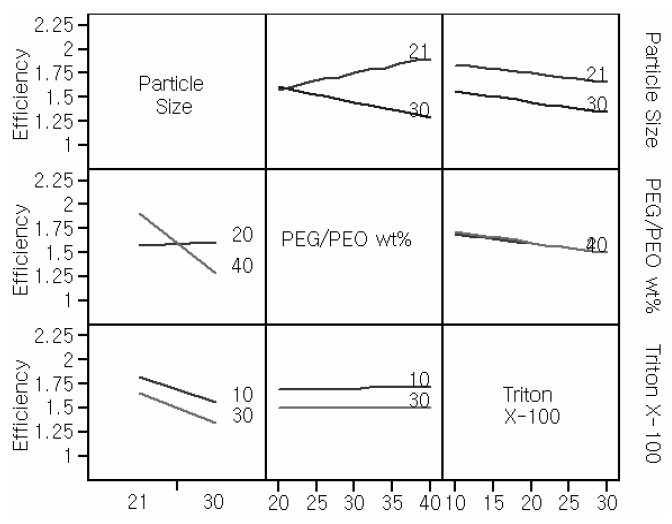
The purpose of 2-way interaction plots is to check the interactions between two input parameters. Cell efficiency is derived from the other responses. For this reason, interaction plots for the efficiency were only investigated. Interaction profilers for efficiency are provided in Fig. 2.
The crosslink between TiO2 particle size and PEG/PEO wt% was distinguishable from other relationships. In the interaction profiles, the lines showing the dependence of a number of properties of interest, including efficiency, on the amount of Triton X-100 and the TiO2 particle size, were almost parallel. To the axes for these latter quantities, showing an The interaction turned out to be the most insignificant interaction between the amount of Triton X-100 and PEG/PEO wt %.
Regression analysis is a statistical technique for investigating and modeling the relationship between variables. An important objective of the regression analysis is to estimate the unknown parameters in the regression model [10]. In general, the response variable y may be related to k the predictor variable, x1, x2… xk, so that
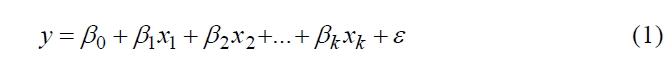
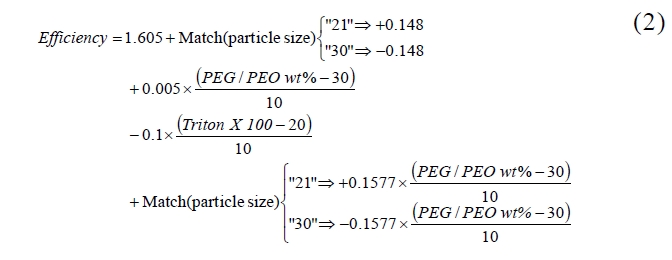
This is called a multiple linear regression model because more than one predictor variable is involved. In order to make a model of the interaction between PEG/PEO wt% and Triton X-100 and between TiO2 particle size and Triton X- 100, three interaction terms were excluded due to the somewhat high p-value. The required predictions are given by Equation (2).
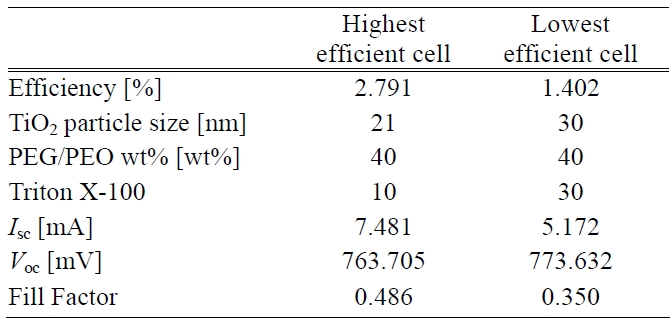
[Table 2.] Process conditions and photoelectric performances of cells.

Process conditions and photoelectric performances of cells.
There are two other ways to assess the overall adequacy of the model. These are the use of R2 and adjusted R2. In this test of the model, the values of R2 and adjusted R2 are 0.635 and 0.537, respectively. The coefficient of multiple determinations, R2 may be used as a global statistic to access the fit of the model. The model accounts for about 63% of the variability in the efficiency response. The R2 statistic is somewhat problematic as a measure of the quality of the fit for a multiple regression model because it always increases when a variable is added to a model [11]. The value of R2 and adjusted R2 was somewhat low. This means that above prediction equation does not fit perfectly to real data. It will be the subject of future experiments to make uncontrollable factors such as the processes of TiO2 paste deposition and sealing more controllable and also the amount of electrolyte to be more precisely controlled. The analysis of variance is presented in Table 1.
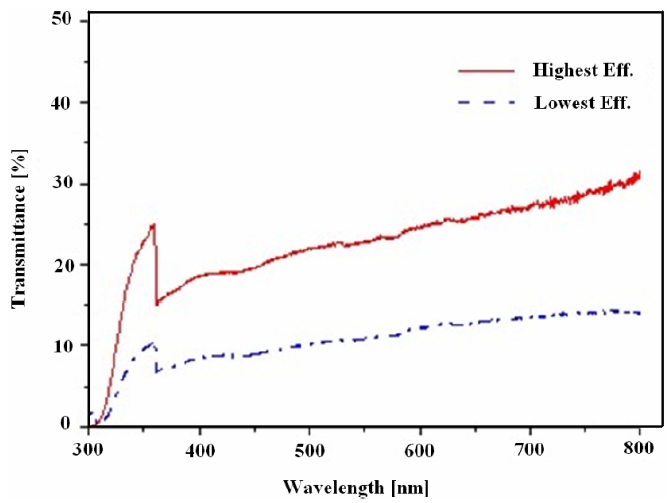
Transmittance is one of the most important parameters in the evaluation of solar cells. Amongst various process conditions, two were chosen for comparison with each other because they showed the highest and lowest efficiency. The transmittance comparison is illustrated in Fig. 3. The highest transmittance is approximately twice the lowest transmittance. It was assumed that the decreased transmittance came from thickness augmentations of the TiO2 layer according to different process conditions.
Thus the building up of both adequate pore size and porosity inside the TiO2 photoelectrode led to a higher transmittance. This situation was related to a better energy conversion efficiency i.e. the higher the transmittance the higher is the photovoltaic effect that can be generated. The process conditions having the highest and lowest efficiency can be seen in Table 2.
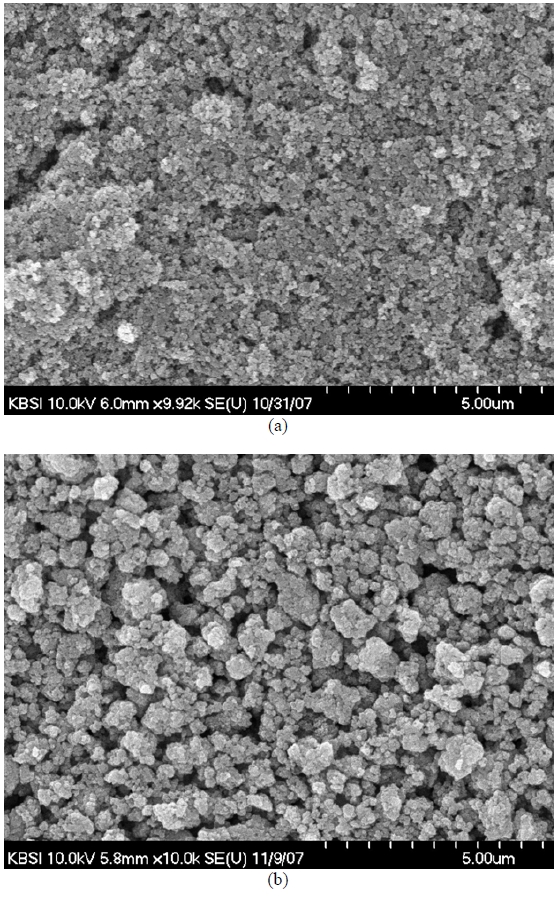
In the wavelength range between 380 and 720 nm, the transmittance never exceeded 60%. The reason was that the dispersion of the TiO2 paste was not enough. Comparatively larger and less dispersed TiO2 particle caused injected light to be more highly reflected and dispersed. The surface morphology comparison of the TiO2 photoelectrodes with the highest and lowest energy conversion efficiencies was accomplished using FE-SEM images. The surface images were shown in Fig. 4. With reference to Table 2, the different average TiO2 particle sizes and the porosity structure on the photoelectrode surfaces can also be observed in this Figure.
Well-formed porosity structures lead to high surface areas of TiO2 particles followed by plentiful dye absorption. In other words, the dispersion of TiO2 particles can affect the porosity, the surface states for recombination, the surface area which eventually affects the photocurrent, the voltage and also the fill factor of the DSC. From Figs. 4(a) and 4(b), it seems that the dispersion of nano-sized particles is not fully satisfactory, and we postulate that poor dispersion may affect the efficiency of the sample. However, dispersion is not a controllable factor in DOE, but an intermediate material state parameter. For this reason, the amount of dispersion is omitted from the list of controllable input parameters in our experiment.
A large amount of dye around the TiO2 particles made cell efficiency more competitive. Energy conversion efficiency is positively proportional to Isc, Voc, and fill factor. Moreover, photoelectric performances of the cells are also listed in Table 2. The performances in terms of high efficiency were remarkably different from another one in terms of Isc and fill factor. There was almost no difference in the Voc response. However, it was presumed that a higher sheet resistance of the TiO2 surface layer caused a lower Isc. Also it had an impacted on the fill factor. The total cell efficiency was affected by all the factors considered above except Voc.
There are numerous of controllable and uncontrollable factors arising during fabrication which can affect the energy conversion efficiency of TiO2 photoelectrode fabrications in dye-sensitized solar cells. This research was intended as an investigation of TiO2 layer fabrication through the statistical design of experiments. Using 23 full factorial and 2 center points with 1 repetition, more precise experiments can be obtained with 3 controllable factors such as TiO2 particle size, PEG/PEO wt%, and Triton X-100.
The modeling and its analysis were done by statistical method. The use of DOE allowed quantification and ranking of the importance of the factors relative to one another for each property studied. In this work, the key points were discovered to be the TiO2 porosity, the uniformity of structures inside the TiO2 layer, and the accurate dispersion of TiO2 paste. However, the dispersion process needs to be improved in order to achieve for a high efficiency. Further research on the dispersion process is now on going. The cell efficiency can be improved by using DOE within the limits defined by the finite controllable parameters and this result is applicable to other process methods of DSC.
Further experiments on materials characterization, including study of the content of WO3 in TiO2 powder mixtures and process conditions, may lead to a substantial improvement on fabrication technology in this type of research.