Due to increasing demand for electric energy in modern societies, the accurate and credible electric current measurement techniques are required for metering and overcurrent protection of power systems in high-voltage substations. Fiber-optic CTs (current transformers) have many advantages over the conventional conductor winding CTs. These advantages include, EMI (electro-magnetic interference) immunity, the absence of flux saturation and residual flux, high-speed response, low cost in ultra-high-voltage environment, and so on [1-4]. The magnetic field intensity from the electric current generates a phase difference between the two circular polarization modes in the fiber-optic sensor coil. The electric current is evaluated by measuring the phase difference. There are two types of current-induced phase demodulations in the fiber-optic CT systems: polarimetric and interferometric. The undesirable birefringence effect, which originates from the birefringence of the fiber-optic sensor coil, is much smaller in the interferometric scheme than in the polarimetric one. Also the counter-propagating polarization modes in the Sagnac interferometer, which is the most common type of sensor coil in interferometric CTs, travel the identical optical path, thus the effects of environmental perturbations, such as temperature drifts and vibrations, are compensated, making it possible to do high-resolution electric current meas urements [5-7]. The interferometric CTs generate sinusoidal outputs against current variations. Therefore, phase extracting techniques are required to avoid signal fading, limit of phase range, unknown input phase direction, etc [8-10]. Since the working principles are almost the same, the fiber-optic gyroscope signal processing techniques using lock-in amplifiers and digital samplings have been widely used to demodulate the current-induced phase information in the commercial fiberoptic CTs [6, 7]. In previous research, we used a time-delayed quadrature sampling which we have successfully employed for fiber Bragg grating sensor demodulation [11, 12].
In this work, to demodulate an interferometric fiber-optic CT, we used PWM (pulse width modulation) quadrature sampling. Due to its simple nature, we could obtain a measurement resolution which is good enough for most of the protection uses with much simpler hardware structure and signal processing than for gyroscope demodulation.
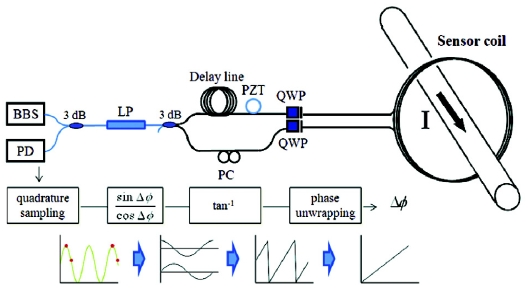
Figure 1 is the schematic diagram of the proposed interferometric CT that uses a PWM sampling demodulation. The light from a broadband source passes through a fiber-optic linear polarizer, launching the linearly polarized light to QWPs (quarter-wave-plates) of which axes are adjusted at 45 degrees with respect to the polarizer's axis. For convenience, let us assume that only the x component of the linear polarization passes the upper QWP, and the y component passes the lower one. Passing the QWPs, the x and the y components become the left- and the right-circular polarizations, respectively. The Faraday effect can be explained as a circular birefringence induced in the optical fiber by the magnetic field intensity. With the circular birefringence, the phase velocities of the two circularly polarized lights are different, generating a phase difference between them. The counterpropagating circularly polarized lights in the sensor coil become linearly polarized lights after passing through the QWPs again. They recombine and generate an interference signal at the photo diode of which output can be written as following equation,
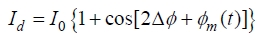
, where
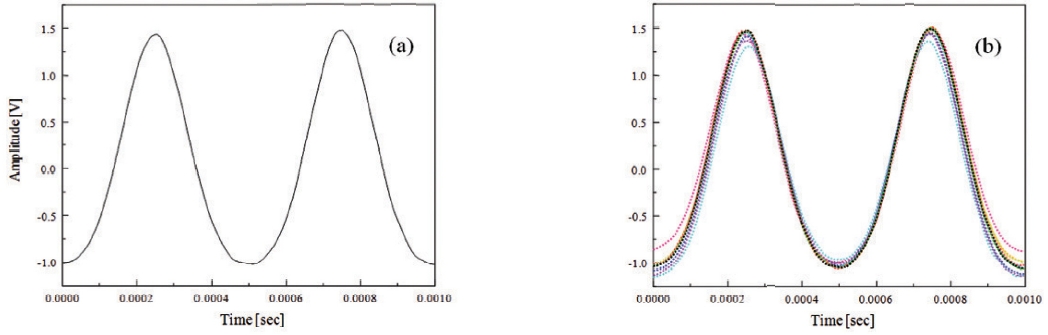
In the absence of electric current, the ac-coupled PD output will be an AC signal with a fixed phase and amplitude as in figure 2(a). When a 60 Hz electric current is applied, the current-induced phase will shift the phase and change the amplitude of the AC signal as in figure 2(b).
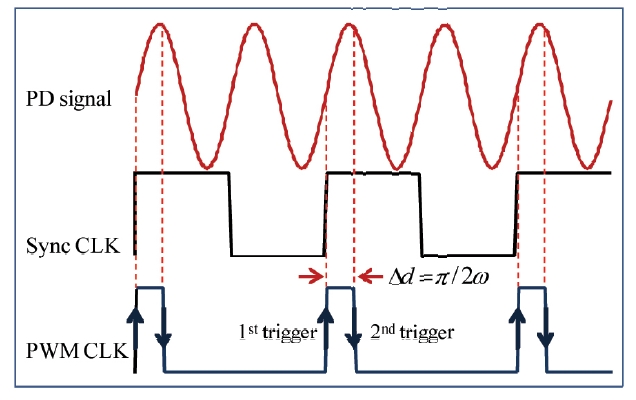
To extract the current-induced phase, the interference signal is sampled twice during one period of PWM pulse as shown in figure 3. The first sampling occurs at the rising edge of the PWM trigger, and the second sampling occurs at the falling edges of the trigger after a pulse width δ
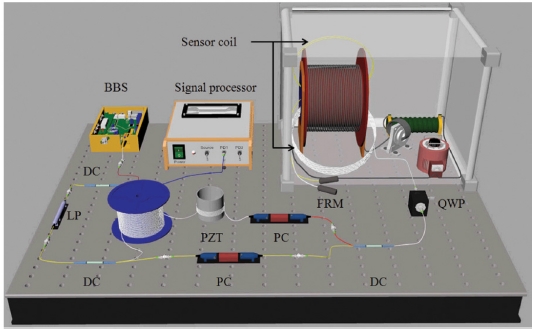
Figure 4 shows the experimental setup of the suggested fiber-optic CT. As a light source, we used an EDF (erbiumdoped fiber) ASE (amplified spontaneous emission) broadband source (center wavelength: 1567 nm, 3-dB bandwidth: 70 nm) and a fiber-optic linear polarizer. We placed a cylindrical PZT fiber stretcher and a 1 km long delay line in one of the Mach-Zehnder interferometer arms for asymmetric phase modulation to the counter-propagating lights. A sinusoidal driving voltage (1 kHz, 12 Vp-p) was given to the fiber stretcher to generate a phase excursion more than 90 degrees. The sensor coil we used in the experiment is a little different from that in figure 1. It is a reflection type with a mirror attached to the end of it. It is almost the same with the in-line Sagnac interferometer in Ref. [7]. However, the working mechanism is almost the same with the Sagnac interferometer in figure 1.
To evaluate the CT system, we constructed a test current source by winding 1000 turns of copper wire, which generated up to 3550 AT at 60 Hz. With the maximum current output, the interference signal was PWM sampled.
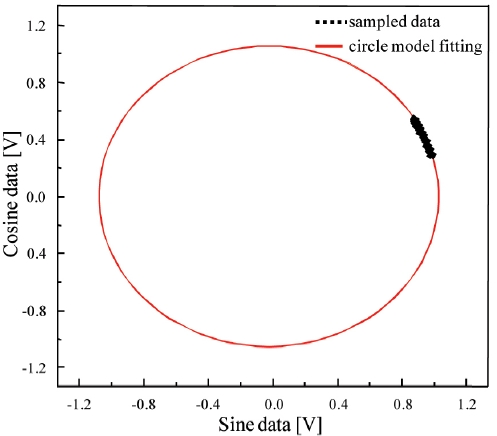
Figure 5 is the Lissajous graph of the two sampled data streams. If the Lissajous plot makes a circle, then the phase difference between the sampled data is 90°, which is the prerequisite condition for accurate arctangent demodulation. In the experiment, because the current-induced phase change was in a limited range, the Lissajous plot was curve-fitted by a circle model, and the MSE (mean squared error) was calculated between the fitted circle and the sampled values. In the full range of input current, the MSE was less than 2.87×10⁻⁵ and the corresponding phase error was calculated to be 2.35 mrad (~2% current measurement accuracy).
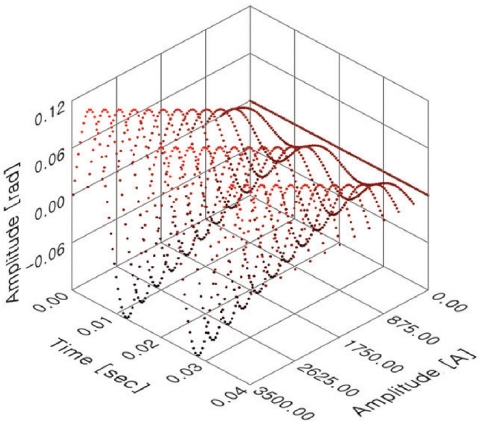
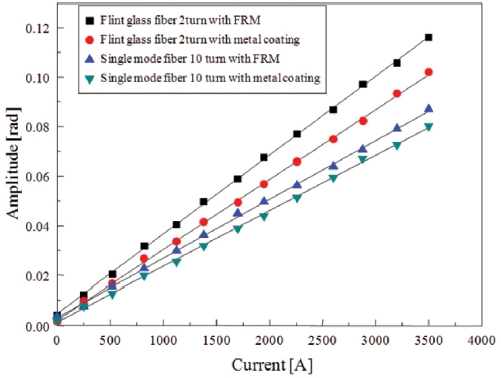
Figure 6 shows the measured profiles with increasing 60 Hz electric current. The reconstructed 60 Hz AC current is apparent in figure 6. To compare the linear birefringence effects and sensitivity, we used different sensor coils: a 10-turn standard single-mode fiber and a 2-turn flint glass fiber with different types of mirror attached. Figure 7 shows the measured RMS current value of the two sensor coils with different mirrors. The flint glass fiber (Hoya Corp.), which is a lead-doped optical fiber developed to measure a high current over 180 kA, shows larger outputs although the number of turns is just one-fifth of the standard fiber coil. That could be attributed to the low birefringence and the high Verdet constant (3.75×10⁻⁶ [rad/AT]) of the flint glass fiber [13].
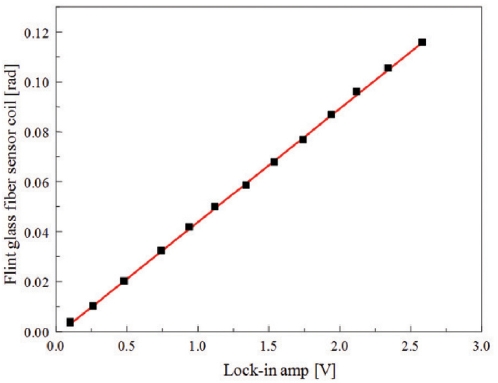
The sensitivities of the coils with a FRM were about 20% larger than those of the metal-coated coils. We used a Halleffect CT as a reference current sensor, and the linearity errors with the Hall-effect CT were less than 0.18%, regardless of sensor coils and mirror types, over the whole measurement range. To verify the accuracy of the proposed demodulation, we measured the electric current in the same condition with a lock-in amplifier demodulation. The interference signal of the fiber-optic CT is divided by a 1×2 BNC connector and connected to a lock-in amplifier demodulation at the same time. The comparison results of current measurement are plotted in figure 8. The two results with different demodulation techniques showed only 0.36% difference.
We constructed a fiber-optic interferometric CT using a PWM sampling demodulation. To verify the feasibility of the proposed technique, we compared the measurement result with that of a lock-in amplifier demodulation. The linearity error between the two demodulations was less than ~ 0.36% in the input current range of 0~3550 AT. From the experiments with different sensor coils and different mirrors, the sensitivity of a flint glass fiber with a FRM was about 3 dB larger than that of a standard single-mode fiber coil with a metal-coated fiber end. Because of the simplicity, the PWM sampling would be a very cost-effective demodulation technique for commercial fiber-optic CTs that require moderate measurement resolution for over-current protection uses.