검색 전체 메뉴
PDF
맨 위로
OA 학술지
Measurement of Aerosol Parameters with Altitude by Using Two Wavelength Rotational Raman Signals
  • 비영리 CC BY-NC
ABSTRACT
Measurement of Aerosol Parameters with Altitude by Using Two Wavelength Rotational Raman Signals
KEYWORD
LIDAR , Rotational Raman , Backscattering , Extinction , Color ratio
  • I. INTRODUCTION

    Optical properties of an atmospheric aerosol are very important parameters for predicting climate change. An aerosol has an indirect effect on the radiation budget of atmosphere providing condensation nuclei for cloud formation, because scattering and absorption of solar radiation and longwave radiation are dependent on atmospheric aerosol particle concentration, position, orientation, shape, and size. Sometimes the specific aerosol, Asian dust, impacts the Korean Peninsula or travels through the sky on the prevailing westerlies in varying degrees[1]. The occurrence rate of Asian dust has been rapidly increasing in the 2000s, and this specific Asian dust also affects the climate.

    If there is fog, visibility is strongly dependent on the amount and size of water droplets. So, to predict weather changes, water droplet size change and other parameters such as temperature must be measured. Moreover, the aerosol backscattering coefficient and extinction coefficient cannot give enough information for identifying weather changes, so it is necessary to measure other parameters which are connected with aerosol size, such as Ångstrom exponent, color ratio, and LIDAR ratio[2, 3].

    Many scientists have tried to measure simple aerosol properties such as backscattering coefficient, and extinction coefficient[4-6]. Moreover, they have obtained these backscattering and extinction coefficients with some assumptions such as Ångstrom exponent, color ratio, and LIDAR ratio[6, 7]. The Ångstrom exponent, k, value is 4 for molecules and varies between 0 and 2 for particles by the Ångstrom's empirical formular α(특수문자 삽입)λ-k[8]. This assumption causes systematic errors, because the Ångstrom exponent of an aerosol is dependent on the type and size of the aerosol. The high spectral resolution LIDAR system does not need any of these assumptions, but the high spectral resolution LIDAR requires an expensive optics and laser system to separate the Mie scattering signal from the Rayleigh scattering signal, because the received LIDAR signal is a combination of the Doppler-broadened molecular backscatter spectrum and the un-broadened aerosol spectrum[4].

    In this study, the Ångstrom exponent, color ratio, and LIDAR ratio were measured by using two wavelength rotational Raman LIDAR signals to obtain the aerosol size distribution. The backscattering coefficients, which have a close relation to atmospheric aerosol concentration were also calculated. Finally, the cloud and aerosol size characteristics were analyzed by using the Ångstrom exponent, color ratio, and LIDAR ratio.

    II. METHOD

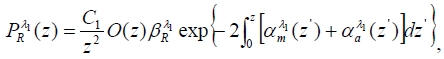
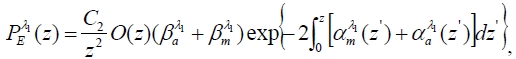
    In rotational Raman LIDAR, the two return signals can be expressed as Eqs. (1) and (2)[9, 10].

    image
    image

    where P is the LIDAR signal, λ is the scattering wavelength, β is the backscattering coefficient, α is the extinction coefficient, O(z) is the overlapping function, z is the altitude, C is a constant that is independent of the altitude, and E, R, a, and m represent the elastic, rotation, aerosol, and atmospheric molecule, respectively. The aerosol backscattering coefficient can be obtained from these two signals as shown in Eq. (3)[11].

    image

    where Cm/R is the ratio of the scattering cross section between the Rayleigh and the total rotational Raman, N is the number density of molecules(oxygen and nitrogen), Ω is the solid angle, and σ is the scattering cross section of the atmospheric molecule. Two unknown values (수식삽입) can be obtained by using the method of Kim and Cha[11]. The constant (수식삽입) can be obtained experimentally on a clear day by using a large range of LIDAR signals at a high altitude. And the experimental constant C2/C1 can be calculated within statistical errors by using the theoretical scattering cross section of rotational Raman scattering and the elastic scattering of nitrogen and oxygen. Thus the aerosol backscattering value is βa λ(z)/βm λ(z) normalized with the molecular rotational backscattering coefficient[11]. The aerosol backscattered color ratio [CR = (수식삽입)] can be obtained from the ratio of the aerosol backscattering coefficients between two wavelengths. The aerosol color ratio value provides good information about the relative size change of the aerosol, which does not directly correspond to the absolute value of the aerosol size[12].

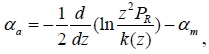
    The aerosol extinction coefficient can be obtained from Eq. (1). The aerosol extinction coefficient can be expressed as Eq. (4) from Eq. (1), by substituting k(z) for a constant C1×O(z).

    image

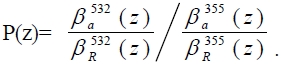
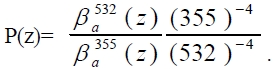
    From Eq. (3), the aerosol Ångstrom exponent can be obtained. As mentioned above, the two unknown values (수식삽입) in Eq. (3) can be obtained experimentally. So (수식삽입) can be calculated from the two unknown values. The ratio of backscattering coefficients, (수식삽입), at two(355 nm and 532 nm) wavelengths are given by

    image

    Since β λR = C0 λ-4, it can be rewritten as

    image

    The Ångstrom exponent k, which describes the wavelength dependence of the particle backscattering coefficient, can be expressed by Eq. (7).

    image

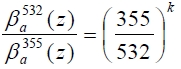
    Consequently, from Eq. (6), (7), the Ångstrom exponent can be expressed as Eq.

    image

    where A is (수식삽입)

    III. EXPERIMENTAL SETUP AND RESULTS

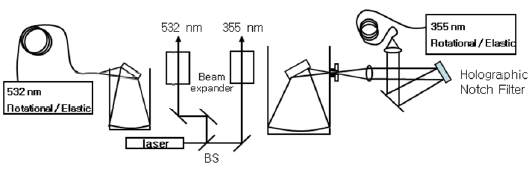
    In this study, the two wavelength Raman LIDAR system was installed by using a 355 nm and 532 nm laser beam of a Nd:YAG laser. The pulsed energy of the laser beams were 130 mJ and 300 mJ at 355 nm and 532 nm, respectively. Figure 1 shows a schematic diagram of the installed LIDAR system. To decrease laser beam divergence, a beam expander was used in the transmitting system, which can expand a laser beam by 10 times. The receiving system consisted of 4 channels, namely rotational Raman channels at 355 nm and 532 nm, and two elastic channels at 355 nm and 532 nm[10, 11].

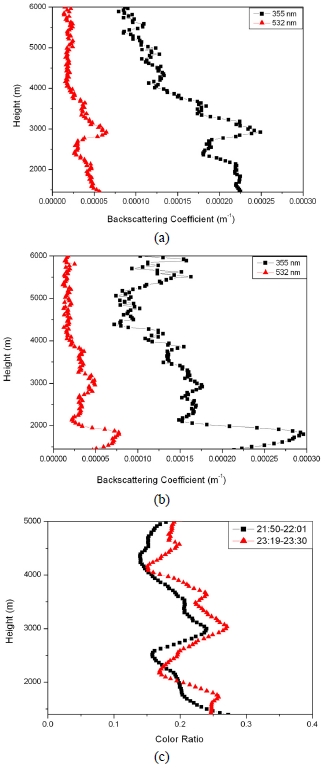
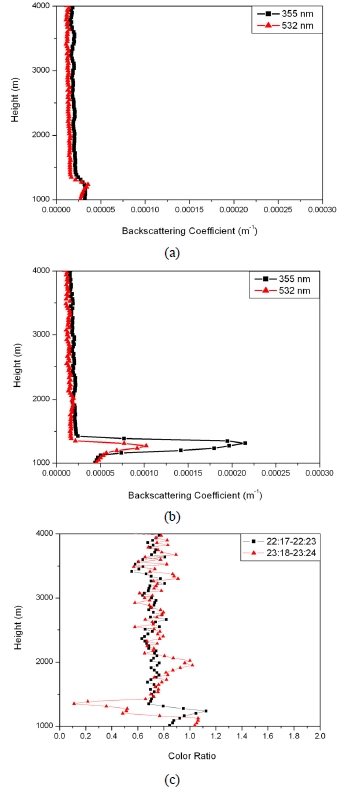
    Figures 2(a) and 2(b) show the change of aerosol backscattering coefficients measured using the two wavelength LIDAR signals on June 10, 2010 (cloudy day) at different times. In the figures, it can be seen that even though the boundary layer is at the same altitude (2000 m), the backscattering coefficient changes dramatically from 2.24×10⁻⁴ m-1 to 1.81×10⁻⁴ m-1 (355 nm) within the boundary layer. At the other wavelength (532 nm), the change of the backscattering coefficient with altitude is not the same as that of 355 nm. But the cause of the backscattering coefficient variance is unknown, because the backscattering coefficient is not solely dependent on the aerosol size and concentration. To obtain the quantitative information, the color ratio was calculated at two different times. Figure 2(c) shows the color ratios that have a close relation to the aerosol size distribution. In Fig. 2(c), it can be seen that the aerosol size distribution value decreased from 0.25 to 0.14 and from 0.26 to 0.15 in the boundary layer with the altitude at 21:50 and 23:19[12, 15]. In this case, the color ratios are similar to each other at all altitudes.

    Figures 3(a) and 3(b) show the change of the aerosol backscattering coefficients on Dec. 4, 2007 (clear day) at different times. In Figs. 3(a) and 3(b), it can also be seen that even though the boundary layer is the same altitude (1300 m), the backscattering coefficient changes by a factor of 7 from 3.22×10⁻⁵ m-1 to 2.15×10⁻⁴ m-1 (355 nm) within the boundary layer. Figure 3(c) shows the change of the color ratio measured at these two different times. At 1000 m altitude, the color ratio value was 0.83 at 22:17, and 1.04 at 23:18, respectively. Compared with Fig. 2(c), these figures show a strong change in the color ratio within the boundary layer according to the altitude. In particular, the change of color ratio value at the boundary layer (1300 m) was dramatic even in one hour, even though the change of color ratio value within and above this boundary layer was small. It means that aerosol dynamics usually start at the surface of the boundary[13, 16]. In conclusion, the aerosol color ratio changes within the boundary layer and near the cloud, even in a short time period in this case.

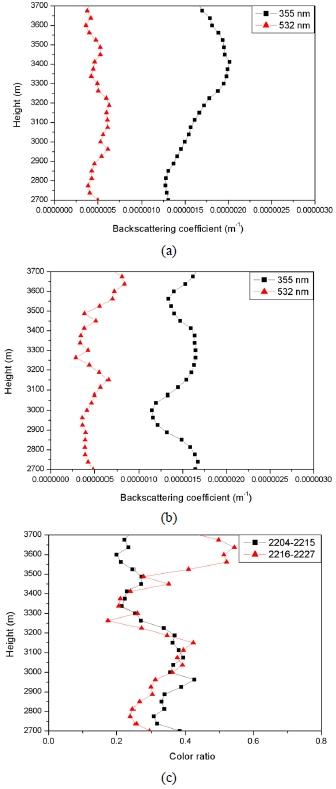
    Figures 4(a) and 4(b) show the change of the aerosol backscattering coefficients on May 30, 2010 (cloudy day) at different times. In Fig. 4(a), it can be seen that the backscattering coefficient increased from 1.3×10⁻⁶ m-1 to 2.0×10⁻⁶ m-1 at 355 nm between 2700 m and 3400 m. The backscattering coefficient showed no change at 532 nm at the same altitudes (2700-3400 m). Figure 4(b) shows that the backscattering coefficient varied sharply at the same altitudes (2700-3400 m). On the other wavelength (532 nm), the change of the backscattering coefficient with altitude was not the same with the change of 355 nm. Figure 4(c) shows the change of the color ratio measured at these two different times. At 2700 m altitude, the color ratio value was 0.38 at 22:04, and 0.29 at 22:16, respectively. The average value of the color ratio was 0.23 at 22:04 and 0.45 at 22:16 between 3500 m and 3700 m. In particular, the change of color ratio value between 3500 m and 3700 m was dramatic, even in 11 minutes. This figure shows that the aerosol concentration and aerosol size distribution change, even in such a short time period.

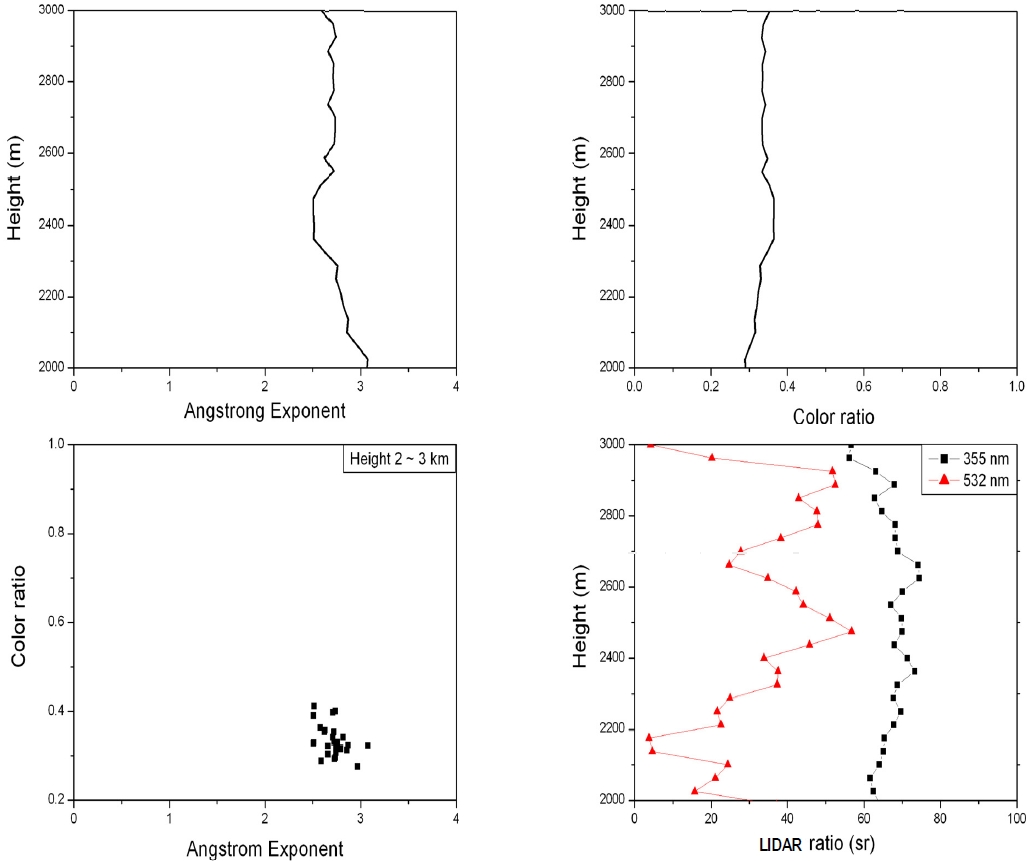
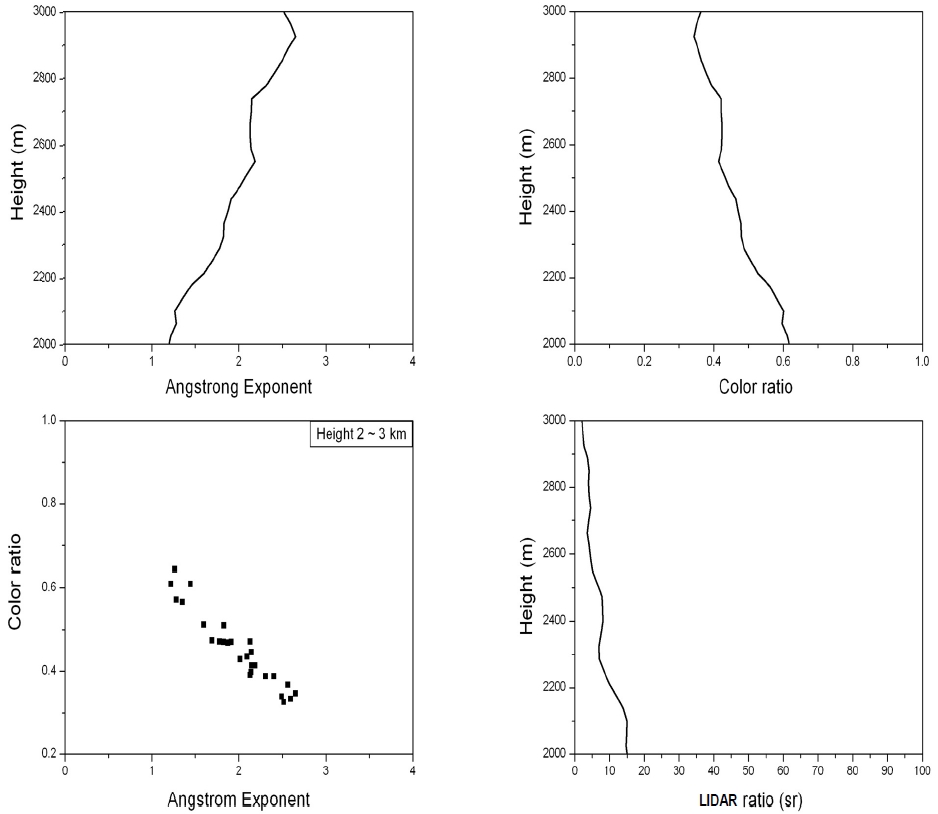
    Figure 5 shows the change of the Ångstrom exponent, the color ratio, the Ångstrom exponent versus color ratio, and the LIDAR ratio at 355 nm and 532 nm measured on May 31, 2010 (cloudy day). In Fig. 5, it can be seen that the Ångstrom exponent changed from 2.5 to 3.1 and the color ratio changed from 0.28 to 0.42 at altitudes between 2000 m and 3000 m. There were no noticeable changes in the Ångstrom exponent and color ratio. So, a clear relationship between the Ångstrom exponent and color ratio is not known. The average value of the LIDAR ratio was 66.9 sr at 355 nm and 32.6 sr at 532 nm at the same altitude (2000-3000 m). These values are thought to be reasonable also by other studies[14, 17].

    Figure 6 shows the change of the Ångstrom exponent, the color ratio, the Ångstrom exponent versus color ratio, and the LIDAR ratio at 355 nm measured on June 11, 2010 (rainy day). It can be seen that the Ångstrom exponent increased from 1.2 to 2.7 and the color ratio decreased from 0.64 to 0.32 at altitudes between 2000 m and 3000 m. These values are also thought to be reasonable also by many other studies[3,12, 15]. It can be seen that the Ångstrom exponent and color ratio varied sharply with the corresponding altitudes when we comparing Fig. 5 with Fig. 6. Also, in Fig. 6, an inverse relation can be seen between the color ratio and Ångstrom exponent, as was mentioned in Eq. 7. The average value of the LIDAR ratio depends on the weather conditions[14, 17] it has changed from 60 sr(Fig. 5) to 7.0 sr(Fig. 6) at 355 nm at the same altitude (2000-3000 m). On a rainy day, a change of Ångstrom exponent and color ratio could be detected when the altitude changed from 2000 m to 3000 m. These changes according to altitude come from the change of aerosol size because these two parameters, the Ångstrom exponent and color ratio, simultaneously indicate an increase of aerosol size as indicated in the introduction. That is to say, the Ångstrom exponent k value is 4 for molecules and varies between 0 and 2 for particles[3]. This means that the aerosol size increases when the altitude approaches to the cloud or the humidity increases due to the inverse relation of the color ratio and Ångstrom exponent[12]. It is certain that these aerosol size changes on a rainy day come from the change of humidity, because rainfall was observed 2 minutes after this measurement. From the experimental results, the color ratio, LIDAR ratio, and Ångstrom exponent can give information about the relative size change of an aerosol.

    IV. DISCUSSION AND CONCLUSION

    In conclusion, a two wavelength rotational Raman LIDAR system was installed that can measure aerosol parameters. The spatial/temporal aerosol extinction coefficient, color ratio, LIDAR ratio, and Ångstrom exponent was measured without any assumption by using two wavelength rotational Raman LIDAR signals. An inverse relation between the color ratio and Ångstrom exponent was observed, as was mentioned in Eq. 7. This means that the Ångstrom exponent has an inverse relationship to the particle size of the aerosol and the color ratio is linearly dependent on the aerosol size. To measure the aerosol size distribution more correctly, the backscattering and extinction coefficient cannot give any information, measurement of the several parameters (color ratio, LIDAR ratio, and Ångstrom exponent) can provide much better results than one parameter measurement. By using these several parameters, a difference in the aerosol concentration and aerosol size distribution in the boundary layer can be observed. The boundary layer is physically very important for heat transfer, free convection currents and aerodynamics etc, but there is not enough data when using only the extinction and backscattering coefficient of the boundary layer and an aerosol dynamic study which is dependent in a complex way on the meteorological parameters. In the future, the change in the boundary layer will be measured more quickly and correctly.

참고문헌
  • 1. Lee K.H, Kim J.E, Kim Y.J, Kim J, Hoyningen-Huene W 2005 Impact of the smoke aerosol from Russian forest fires on the atmospheric environment over Korea during May 2003 [Atmos Environ] Vol.39 P.85-99 google cross ref
  • 2. Chanin M.L, Garnier A, Hauchecorne A, Rees D, McDermid I.S, Gentry B, Chen H, Gentry B, Chen H, Chen W.N, Chang S.Y, Chou C.C.K, Chen T.K 2009 Total scatter-to-backscatter ratio of aerosol derived from aerosol size distribution measurement [Int J Environment and Pollution] Vol.37 P.45-54 google cross ref
  • 3. Russell P.B, Bergstrom P.B, Shinoznka Y, Clarke A.D, Decarlo P.F, Jimenez J.L, Livingston J.M, Redemann J, Holben B, Dubovic O, Strawa A 2009 Absorption Ångstrom exponent in AERONET and related data as an indicator of aerosol composition [Atmos Chem Phys Discuss] Vol.9 P.21785-21817 google cross ref
  • 4. She C.Y, Alvarez II R.L.M, Caldwell , Krueger D.A 1992 High-spectral-resolution Rayleigh-Mie LIDAR measurement of aerosol in atmospheric profiles [Opt Lett] Vol.17 P.541-543 google cross ref
  • 5. Rizi V, Larlori M, Rocci G, Visconti G 2004 Raman LIDAR observations of cloud liquid water [Appl Opt] Vol.43 P.6440-6453 google cross ref
  • 6. Ansmann A, Wandinger U, Riebesell M, Weitkamp C, Michaelis W 1992 Independent measurement of extinction and backscatter profiles in cirrus clouds by using a combined Raman elastic-backscatter LIDAR [Appl Opt] Vol.31 P.7113-7131 google cross ref
  • 7. Angstrom A 1929 On the atmospheric transmission of sun radiation and on dust in the atmosphere [Geogr Ann] Vol.11 P.156-166 google cross ref
  • 8. Kaskaoutis D.G, Kambezidis H.D 2008 Comparison of the Ångstrom parameters retrieval in different spectral ranges with the use of different techniques [Meteorol Atmos Phys] Vol.99 P.233-246 google cross ref
  • 9. Kim D, Park S, Cha H, Zhou J, Zhang W 2006 New multi-quantum number rotational Raman LIDAR for obtaining temperature and aerosol extinction and backscattering scattering coefficients [Appl Phys B] Vol.82 P.1-4 google cross ref
  • 10. Kim D, Cha H 2005 Rotational Raman LIDAR for obtaining aerosol scattering coefficients [Opt Lett] Vol.30 P.1728-1730 google cross ref
  • 11. Kim D, Cha H 2007 Rotational Raman LIDAR: design and performance test of meteorological parameters(Aerosol backscattering coefficients and temperature) [J Korean Phys Soc] Vol.51 P.352-357 google cross ref
  • 12. Kim D, Cha H 2006 Suggestion for qualitative LIDAR identification of different types of aerosol using the two wavelength rotational Raman and elastic LIDAR [Opt Lett] Vol.31 P.2915-2917 google cross ref
  • 13. Blasius H 1912 Das Aehnlichkeitsgesetz bei Reibungsvorganegen [Z Ver Dtsch Ing] Vol.16 P.639-643 google
  • 14. Noh Y.M, Kim Y.J, Choi B.C, Murayama T 2007 Aerosol LIDAR ratio characteristics measured by a multi-wavelength Raman LIDAR system at Anmyeon Island Korea [Atmos Res] Vol.86 P.76-87 google cross ref
  • 15. Omar A.H, Babakaeva T 2004 Aerosol optical properties derived from LIDAR observations using cluster analysis [IEEE Intern Geo Rem Sens] Vol.3 P.2212-2215 google cross ref
  • 16. Prandlt L 1904 Uber Flussigkeitsbewegung bei sehr Kleiner Reibung [Verh III Intern Math Kongr Heidelberg] P.484-484 google
  • 17. Ansmann A, Muller D 2005 LIDAR and atmosphere aerosol particles [Springer] Vol.102 P.112-117 google
OAK XML 통계
이미지 / 테이블
  • [ FIG. 1. ]  Schematic diagram of the experimental system.
    Schematic diagram of the experimental system.
  • [ FIG. 2. ]  The backscattering coefficients and the corresponding color ratio measured on June 10, 2010(cloudy day) at different times; (a) the backscattering coefficients by using two wavelength LIDAR signals at 21:50-22:01 (KST), (b) the backscattering coefficients at 23:19-23:30 (KST), (c) color ratio by using the backscattering coefficients.
    The backscattering coefficients and the corresponding color ratio measured on June 10, 2010(cloudy day) at different times; (a) the backscattering coefficients by using two wavelength LIDAR signals at 21:50-22:01 (KST), (b) the backscattering coefficients at 23:19-23:30 (KST), (c) color ratio by using the backscattering coefficients.
  • [ FIG. 3. ]  The backscattering coefficients and the corresponding color ratio measured on Dec. 4, 2007 (clear day) at different times; (a) the backscattering coefficients at 22:17-22:23 (KST), (b) the backscattering coefficients at 23:18-23:24 (KST), (c) the color ratio by using the backscattering coefficients. It can be seen that the color ratio sharply changed within the boundary layer according to the altitude.
    The backscattering coefficients and the corresponding color ratio measured on Dec. 4, 2007 (clear day) at different times; (a) the backscattering coefficients at 22:17-22:23 (KST), (b) the backscattering coefficients at 23:18-23:24 (KST), (c) the color ratio by using the backscattering coefficients. It can be seen that the color ratio sharply changed within the boundary layer according to the altitude.
  • [ FIG. 4. ]  The backscattering coefficients and the corresponding color ratio measured on May 30, 2010 (cloudy day) at different times; (a) the backscattering coefficients at 22:04-22:15 (KST), (b) the backscattering coefficients at 22:16-23:27 (KST), (c) the color ratio by using the backscattering coefficients. The change of color ratio value between 3500 m and 3700 m was dramatic, even in 11 minutes.
    The backscattering coefficients and the corresponding color ratio measured on May 30, 2010 (cloudy day) at different times; (a) the backscattering coefficients at 22:04-22:15 (KST), (b) the backscattering coefficients at 22:16-23:27 (KST), (c) the color ratio by using the backscattering coefficients. The change of color ratio value between 3500 m and 3700 m was dramatic, even in 11 minutes.
  • [ FIG. 5. ]  The Ångstrom exponent, the color ratio, the Ångstrom exponent versus color ratio, and the LIDAR ratio at 355 nm and 532 nm measured on May 31, 2010 (cloudy day) at 21:58-22:04 (KST).
    The Ångstrom exponent, the color ratio, the Ångstrom exponent versus color ratio, and the LIDAR ratio at 355 nm and 532 nm measured on May 31, 2010 (cloudy day) at 21:58-22:04 (KST).
  • [ FIG. 6. ]  The Ångstrom exponent, the color ratio, the Ångstrom exponent versus color ratio, and the LIDAR ratio at 355 nm measured on June 11, 2010 (rainy day) at 24:04-24:10 (KST). A change of Ångstrom exponent and color ratio could be detected when the altitude changed from 2000 m to 3000 m. So an inverse relation can be seen between the color ratio and Ångstrom exponent.
    The Ångstrom exponent, the color ratio, the Ångstrom exponent versus color ratio, and the LIDAR ratio at 355 nm measured on June 11, 2010 (rainy day) at 24:04-24:10 (KST). A change of Ångstrom exponent and color ratio could be detected when the altitude changed from 2000 m to 3000 m. So an inverse relation can be seen between the color ratio and Ångstrom exponent.
(우)06579 서울시 서초구 반포대로 201(반포동)
Tel. 02-537-6389 | Fax. 02-590-0571 | 문의 : oak2014@korea.kr
Copyright(c) National Library of Korea. All rights reserved.