The phase change in water is emerging as an important subject in atmospheric meteorology and environmental science. The heat emitted and absorbed during a water phase change is important in atmospheric heat circulation. Atmospheric water vapors are the main absorbers of infrared rays [1]. In addition, the water vapor located within 2 km of the surface of earth have been identified as having the strongest influence on the rise in the ground surface temperature; moreover, even the water vapors in the stratosphere have been found to impact climate change. Therefore, in order to understand cloud microphysics and to predict the changes in weather and climate, it is necessary to measure meteorological factors prior to the development of clouds, such as the concentration distributions of water vapors, droplet size distributions, aerosol, and the phase changes in atmospheric water. Many groups have attempted to measure such meteorological factors by using the multiple-scattering LIDAR technique [2-4]. However, we cannot find any research results on the phase changes in water. Although many researchers have reported on the Raman scattering characteristics of water in laboratory conditions [5-7], there are only a few reports that have investigated scattering in the atmosphere.
A few methods have been applied to measure the phase change in atmospheric water. Melfi and Cooney [8-10] have detected the Raman scattering from water vapor and liquid water by using a Ruby laser.
However, because the Raman spectra of liquid water and ice water cannot be completely resolved, they cannot be used to correctly measure the liquid water content [11]. Veselovskii et al. [12] have used a polarization Raman LIDAR to observe liquid water and water vapor, but they cannot distinguish the phase changes in clouds because they have used wideband interference filters and a wavelength(401.5 nm) unsuitable for differentiating the two phases because they had no interest in ice water and liquid water at that time. Moreover, their study was not aimed at distinguishing ice, liquid, and water vapor. Rizi et al. have also utilized two interference filters to measure liquid water and water vapor [13].
However, the Raman spectra of liquid water and ice water have a broad frequency range of 2800 cm-1 ~ 3900 cm-1, and these spectra (the Raman spectra of ice and liquid water) overlap in certain areas. Hence, the Raman signals from the liquid water channel contain a large contribution from ice water scattering. In addition, the molecular structure of water under atmospheric conditions is very complex; for example, the water molecules are attached to an aerosol or hydrogen-bonded with other water molecules depending on the temperature and other factors; hence, the shape of the Raman spectrum also very complex. Many researchers have attempted to investigate the microphysics of clouds; they faced limitations in measuring the phase changes in water. For this reason, we must measure full Raman spectra of water in atmospheric conditions, and not in laboratory conditions [14, 15], so as to decide the optimum Raman wavelength used in a water Raman LIDAR [16]. In this study, we have designed a Raman LIDAR system based on a monochromator so as to obtain full Raman spectra of atmospheric ice water, liquid water, and water vapor. The final objective of this research is to identify the three optimal wavelengths that are important in designing a filter-based water Raman LIDAR.
However, the Raman spectra of liquid water and ice water have a broad frequency range of 2800 cm-1 ~ 3900 cm-1, and these spectra (the Raman spectra of ice and liquid water) overlap in certain areas. Hence, the Raman signals from the liquid water channel contain a large contribution from ice water scattering. In addition, the molecular structure of water under atmospheric conditions is very complex; for example, the water molecules are attached to an aerosol or hydrogen-bonded with other water molecules depending on the temperature and other factors; hence, the shape of the Raman spectrum also very complex. Many researchers have attempted to investigate the microphysics of clouds; they faced limitations in measuring the phase changes in water. For this reason, we must measure full Raman spectra of water in atmospheric conditions, and not in laboratory conditions [14, 15], so as to decide the optimum Raman wavelength used in a water Raman LIDAR [16]. In this study, we have designed a Raman LIDAR system based on a monochromator so as to obtain full Raman spectra of atmospheric ice water, liquid water, and water vapor. The final objective of this research is to identify the three optimal wavelengths that are important in designing a filter-based water Raman LIDAR.
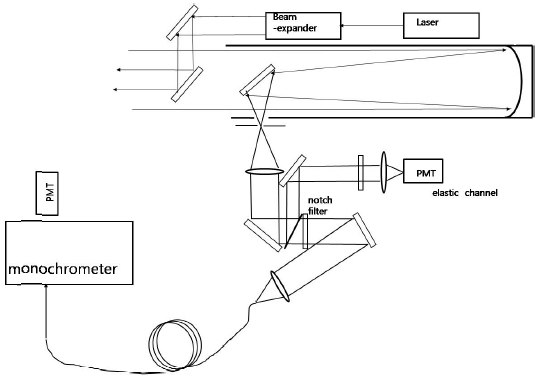
Figure 1 shows a schematic diagram of the experimental setup. We used a tripled Nd:YAG laser with an energy 220 mJ and a repetition rate of 10 Hz. The backscattered signals were collected by using a 320-mm parabolic telescope with a focal length of 1500 mm. In the setup, first the scattered light is collimated by the lens after passing through a pinhole; then the collimated light is passed through a notch filter (Razor Edge Longpass 355) that transmits all the Raman wavelengths but reflects other wavelengths less than 355 nm. The blocking ratio between the transmitted and reflected wavelengths at this notch filter exceeds 10?3. A signal that has passed through the notch filter is focused on a fiber connected to a monochromator. We have used Acton Research's SpectraPro-500 models, which have a 1200-grooves/mm diffraction plate. The Raman spectrum is recorded in the wavelength range from 398 nm to 412 nm with a 1-nm resolution. We have used Hamamatsu R9880U-210, which is specially designed for using in the UV region; its quantum efficiency is 42% near 400 nm. The Raman signals are measured by using a photon counter. Because a measurement time of 4 min is required for each wavelength, we need a measuring time of 1 h to obtain a full Raman spectrum from 398 nm to 412 nm. In order to measure weather changes during this 1 h, we have monitored the weather condition by measuring elastic signals simultaneously with these Raman signals.
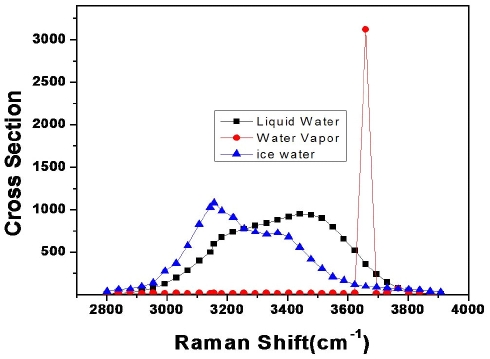
Figure 2 shows Raman spectra of ice, liquid water and water vapor measured under laboratory conditions [17]. However, we cannot confirm whether the shape of this spectrum is the same as that of a full Raman spectrum measured in atmospheric conditions. To the best of our knowledge, these spectra have not been measured in atmospheric conditions, even though D. Kim et al. have measured them in an unknown vertical direction [18].
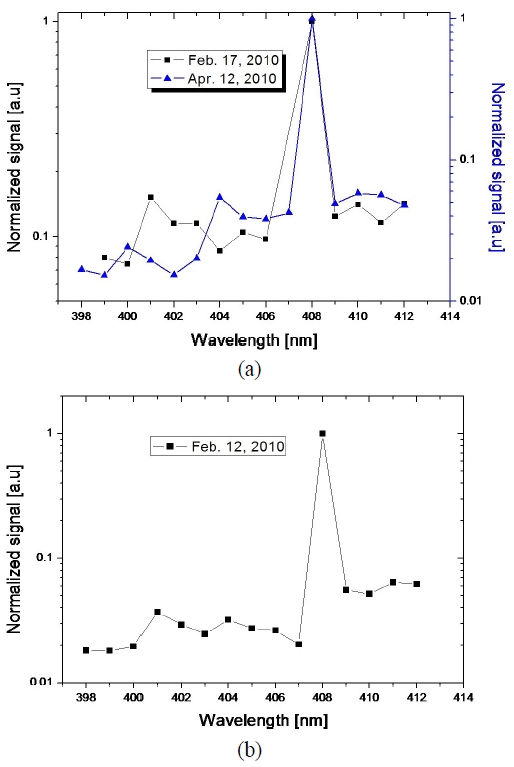
Therefore, we must decide three characteristic Raman wavelengths after measuring and analyzing full Raman spectra in known atmospheric conditions. All figures (from Fig. (3) to Fig. (7)) are normalized by using a water vapor Raman signal to see the changes of the Raman spectrum that depend on the phase of water.
Figure 3(a) shows the full Raman spectra measured in the horizontal direction (at Hanbat National University in Daejeon, Korea), on a rainy day and a snowy day. As this figure shows, we have a peak near 401 nm on a snowy day (Feb. 12, 2010); on the other hand, we have different peaks near 404 nm on a rainy day (Apr. 12, 2010). From these results, we have temporarily decided on 401 nm and 404 nm as the characteristic wavelengths of ice and liquid water, respectively. Figure 3(b) shows a special Raman spectrum that is measured on a particular day on which rainfall and snowfall occurred simultaneously. As expected, Fig. 3(b) has two peaks, one at 401 nm and the other at 404 nm. We can consider think that 401 nm and 404 nm to be the representative wavelengths of ice and liquid water Raman signals, respectively, when we use a 355-nm laser for making measurements.
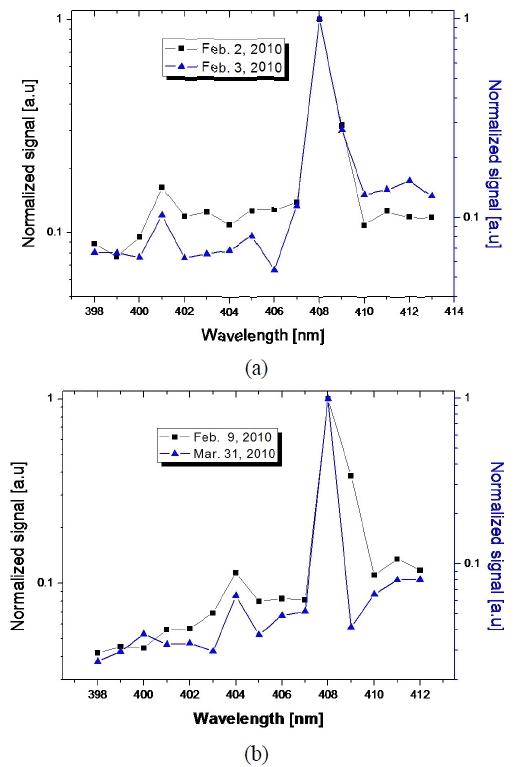
We have measured full Raman spectra on a clear day also, but under different temperature and humidity conditions. Figure 4 shows temperature- and humidity-dependent Raman spectra. Figure 4(a) shows the spectra measured on Feb. 2 and Feb. 3, 2010; Fig. 4(b), shows the spectra measured on Feb. 9 and Mar. 31, 2010. The temperature and humidity were -6℃ (40%), -7℃ (49%), 5℃ (97%), and 9℃ (97%) on Feb. 2, Feb. 3, Feb. 9, and Mar. 31, respectively.
All these figures indicate that the Raman wavelength of water vapor is constant (408 nm), and we consistently have a peak at 401 nm on a low?temperature low-humidity day, and at 404 nm on a high-temperature high-humidity day
Intuitively, we can consider that water will be in the ice state on a low-temperature low-humidity day (Feb. 2 and Feb. 3, 2010), and it will be in the liquid state on a high? temperature high-humidity day (Feb. 9, Mar. 31, 2010), and these spectra also represent these facts well. Even though we have not shown other data in this paper, we have obtained similar results in many cases. D. Whiteman [19] has also indicated that 404 nm is the isosbestic point. Hence, 404 nm is the best Raman wavelength for measuring the liquid water content (LWC).
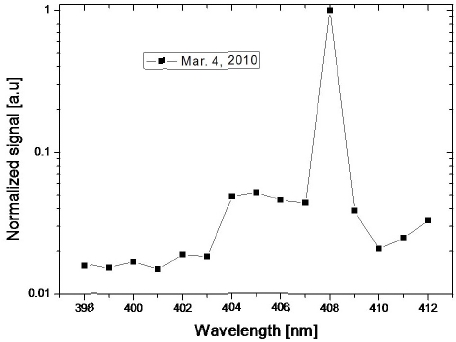
Figure 5 shows the full Raman spectrum measured on a foggy day (Mar. 4, 2010). Because the water contained in fog is in the liquid state, we can expect that this spectrum should be similar to that recorded on a rainy day, and in accordance with our expectation, the spectrum shapes observed in Fig. 5 and Fig. 3 (a) (Apr. 12, 2010) are almost the same.
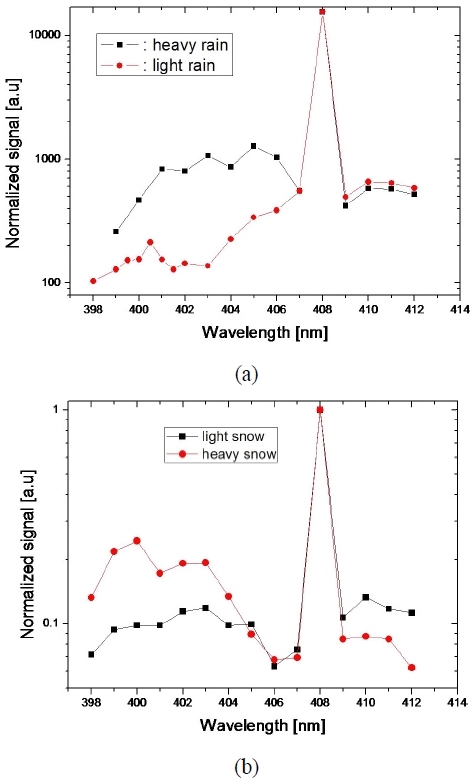
Figure 6(a) shows the full Raman spectra measured under the conditions of heavy rain and light rain. Fig. 6(b) is measured under the conditions of heavy snow and light snow. As these figures show, the number of photons depends on the weather conditions. That is, we can detect more photons under heavy rain than under light rain in the 404-nm. On a snowy day, the same results are obtained for the 401-nm Raman wavelength channel.
To select characteristic Raman wavelengths, we considered following criteria. 1) Raman cross section should be large. 2) To measure the water phase change, phase change criterion p should change as much as possible when liquid water changes to ice water or vice versa.
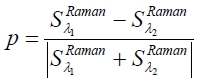
Here
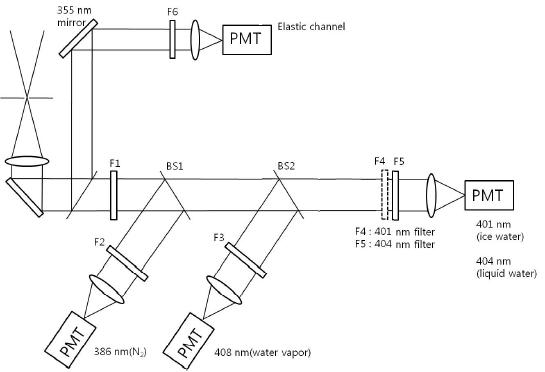
Figure 7 shows a schematic diagram of our filter-based 5-channel Raman LIDAR system. The system has nitrogen Raman (386 nm), ice water Raman (401 nm), liquid water (404 nm), water vapor (408 nm), and elastic (355 nm) channels. In order to normalize time-dependent atmospheric conditions and laser energy changes, we have divided each water Raman signal with the nitrogen Raman signal.
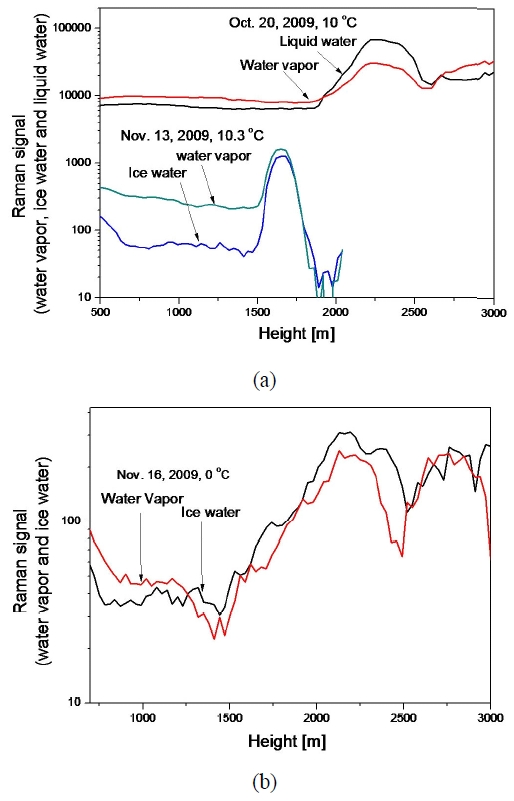
Figure 8 shows traditional normalized Raman LIDAR signals measured on warm and cold days in the vertical direction. These signals are normalized by using a nitrogen Raman signal to see relative concentrations of water vapor, liquid water, and ice water. These signals have been obtained on Oct. 20, 2009, Nov. 13 and 16, 2009. The respective temperatures on these days were 10℃, 10.3℃ (Fig. 8(a)) and 0℃ (Fig. 8(b)) respectively. On a warm day (Fig. 8(a)), we can detect clouds at distances of 1.5 km and 2.3 km, and the clouds at these distances scatter relatively stronger Raman signals of water vapor and liquid water than of ice water. On the other hand, on a cold day (Fig. 8(b)), we can consider that a cloud is composed of ice water. Experimental results also show that the ice Raman signal (401 nm) is stronger than the water vapor Raman signal. When we consider the surface temperature of our region, humidity, and altitude of the cloud, these results indicate that our filter-based Raman LIDAR system can give information on cloud phase, LWC, and IWC.
III. DISCUSSION AND CONCLUSIONS
In this study, we have developed a Raman LIDAR system that can distinguish the Raman spectra of ice water, liquid water, and water vapor. This LIDAR system is composed of a notch filter and a monochromator. By using the system we have found and confirmed the optimum Raman wavelengths that are representative of water phases.
We have measured Raman LIDAR spectra on a rainy day and a snowy day and compared them. From these two representative spectra, we can obtain characteristic Raman wavelengths (401 nm, 404 nm, and 408 nm) that can provide quantitative information for determining the content of ice water, liquid water, and water vapor in clouds and atmospheric conditions.
In order to prove these characteristic wavelengths, we have obtained full Raman LIDAR signals on a clear warm day and a cold day (Feb. 2 and Feb. 9, 2010, respectively). These full Raman signals also show the same characteristic wavelengths (401 nm, 404 nm, and 408 nm) as those recorded on rainy and snowy days. The full Raman spectrum measured on a foggy day differs completely from that recorded on a snowy day, but more or less looks like the one measured on a rainy day.
After finding these characteristic Raman wavelengths, we have analyzed the filter-based Raman LIDAR signals; these signals were measured from a cloud at three characteristic wavelengths (401 nm, 404 nm, and 408 nm).
As a standard example, we have compared the LIDAR signals of an ice cloud and a liquid cloud, which were obtained on Nov. 16 and Oct. 20, 2009. These signals also show that our characteristic wavelengths are suitable for distinguishing the Raman signals from liquid water and ice water.
As mentioned above, we have first found three characteristic LIDAR Raman wavelengths (401 nm, 404 nm, and 408 nm). In the near future, we will apply the filter-based LIDAR system to characterize the hygroscopic properties of atmospheric aerosol and to investigate the true state of a cloud.


![Shapes of Raman spectra of liquid water, water vapor, and ice [16, 17].](http://oak.go.kr/repository/journal/10106/E1OSAB_2010_v14n3_209_f002.jpg)