Global wind measurements can provide data which are important to the mesoscale dynamic process, transport and exchange in the atmosphere. Doppler wind LIDAR is a powerful technology which can offer spatially resolved measurements of atmospheric wind velocity from a remote location[1-4]. A Mie Doppler wind LIDAR has already been successfully developed at Anhui Institute of Optics and Fine Mechanics, CAS. It can measure the atmospheice wind velocity in the low troposphere where the aerosol backscatter is high[5-8]. For the measurement of the atmospheric wind velocity in the stratosphere where the aerosol concentration is very low, we have to resort to the molecular scattering which is a reliable and reasonably uniform source on a global scale[9,10]. A mobile direct detection Doppler wind LIDAR based on molecular backscatter has been built in Hefei, China. A tripled Nd: YAG laser is used as an eye-safe transmitter, an air-spaced tunable Fabry-Perot etalon which includes three channels, two edge channels and one locking channel is used as a frequency discriminator. By now, the primary experiment has been performed and the result has been compared with a Doppler wind radar at the same site.
II. WIND MEASUREMENT PRINCIPLE
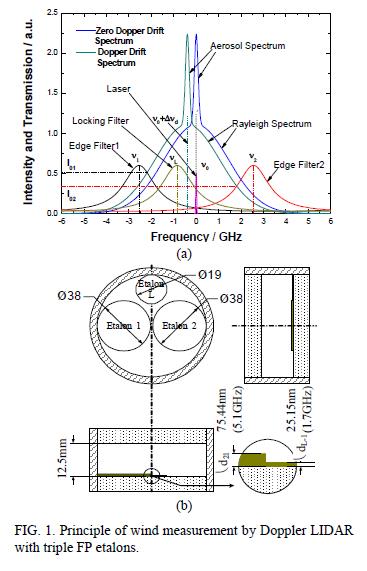
In contrast to the narrow aerosol backscattered spectrum, the molecular backscattered spectrum is significantly broadened by the random motion of the air molecules. Then the molecular-based double-edge technique uses two edge channels of the triple etalon located in the wings of the broadened molecular backscattered spectrum to determine the Doppler shift, as shown in Fig. 1(a). The locking channel of the etalon is used to measure the outgoing laser frequency and to lock the etalon to the laser frequency for a high accuracy wind measurement[11, 12].
The configuration of the triple etalon is shown in Fig. 1(b). The cavity lengths are made slightly different by optically coating one of the edge channels and the locking channel. As this structure keeps the difference of the cavity length constant, the transmission properties of the etalons will have a stable profile during cavity tuning or
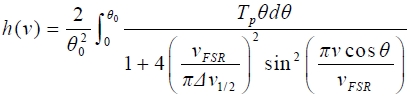
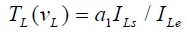
fluctuation. This etalon has a nominal cavity spacing of 12.5mm and an effective finesse of 7. Its cavity scan range is more than 0.4μm. All the parameters of the etalon are optimized and the optimizing procedure will be described specifically in another paper. The transmission function for a real Fabry-Perot etalon at a given frequency v can be derived as the integration of the Airy function over the incident beam divergence angle θ :
where TP, δ
where (수식처리), is the FWHM of the aerosol backscatter spectrum, which can be replaced by the FWHM of the outgoing laser spectrum since the Brownian motion of aerosol particles does not broaden the spectrum significantly; (수식처리) is the 1/e width of the atmospheric molecular spectrum,
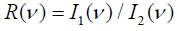
The locking channel transmittance of the outgoing laser can be measured by two analog PMT detectors:
where
Assume that the intensities of the backscattered light being incident on to two edge channels of the etalons are equal and the two detectors have the same sensitivity, the transmitted signals measured on the two edge channels are:


where
where the system is designed to meet that
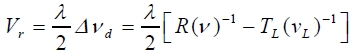
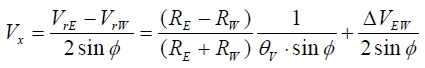
Then the line of sight (LOS) wind velocity can be retrieved by:
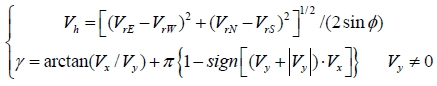
Using four beams scanning method with the zenith angle is , then the horizontal velocity of the atmospheric wind is:
Where,
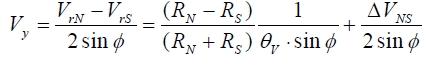
and
are due to the frequency drift of the transmitting laser.
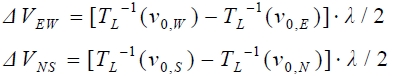
In formula (11), we have defined north as 0°. According to expression(12)~(14), the error of magnitude and direction of the horizontal wind can be expressed as :
III. DOPPLER LIDAR SYSTEM DESCRIPTION
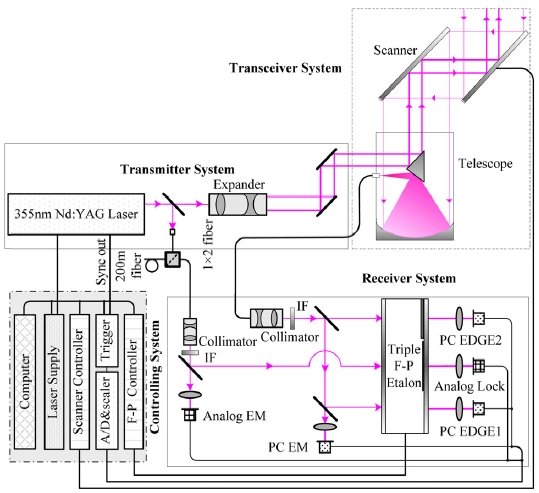
The mobile Doppler LIDAR in Hefei, China, is designed for wind measurement from Rayleigh backscatter, which could obtain the wind profile up to the stratosphere. The system consists of four major subsystems, which are the laser transmitter subsystem, the scanning telescope (transceiver) subsystem, the receiver subsystem and controlling subsystem, as shown in Fig. 2. The transmitter is an injection-seeded Nd:YAG laser(Continuum Model 9050), which produces the output laser beam at 355nm to take advantage of the λ-4 dependence of the molecular backscatter. The transceiver optical system consists of a 45 cm aperture Cassegrain telescope and a matching azimuth-over-elevation scanner that can provide full hemispherical pointing. Most of the light from the transmitter is expanded by a 10X expander to compress the beam divergence to less than 0.1mrad, and the light is pointed to the atmosphere by the two-dimensional scanner. Then the backscattered signal that carries Doppler-shift information is collected and focused into a 200μm diameter multimode fiber to couple the signal from the telescope to the receiver. Before that, a very small fraction of the outgoing laser signal is coupled directly into the receiver through a 100μm diameter multimode fiber, and used as the reference signal to determine its frequency[13, 14].
In the receiver, the reference light and the backscattered light are collimated, and pass through interference filters (IF) with the bandwidth of 0.15nm@355nm, respectively. Then they are split into two and three channels, respectively. 77% of the reference light illuminates the locking channel of the triple Fabry-Perot etalons which are used to sample the outgoing laser frequency as a reference, and 94% of the backscattered light is incident onto two edge channels of the etalons which provide the information used in the Doppler shift measurement with balanced intensity for each. The other two channels of the remaining reference light and the remaining backscattered light serve as energy monitor channels used to provide intensity normalization of the respective etalon channels during calibration. The light in each of the two reference-light channels is strong enough to be detected by a Hamamatsu PMT detector operated in analog mode(type:H5784-03), while the light from each of the three backscattered-light channels is detected by a PerkinElmer photon counting mode channel photomultiplier(CPM) detector(type:MP943) which can detect the very weak backscattered light. The laser operation, FPI spacing parallelism, data collection, and X-Y scanner orientation are controlled by an industrial computer. Software is developed to achieve real-time signal processing and unattended operation. The system parameters are summarized in Table 1.
[TABLE 1] Rayleigh Doppler LIDAR system paramters
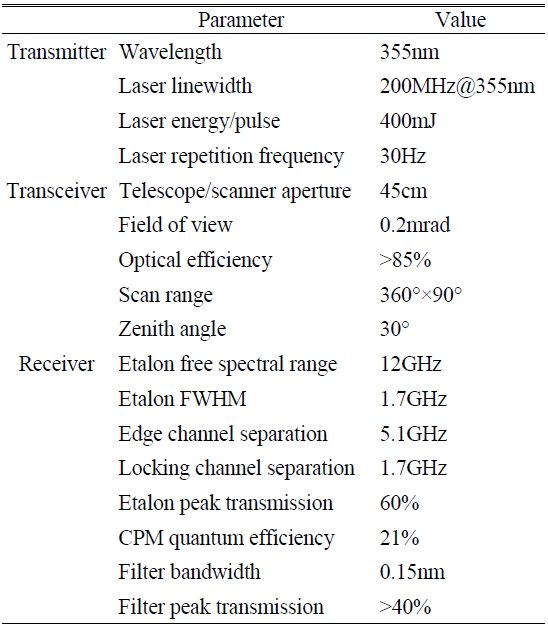
Rayleigh Doppler LIDAR system paramters
IV. EXPERIMENTS OF DOPPLER WIND LIDAR
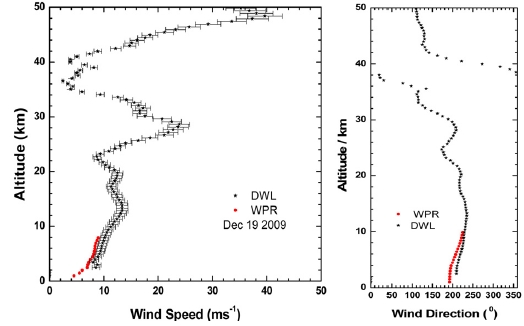
From the same location on the evening of December 18 2009 and on the morning of December 19 2009, an intercomparison experiment was held between the DWL and the wind profile radar (WPR, has operating frequency 450 MHz, detection range from 150 m to 12 km in good weather and vertical resolution 150m or 300 m when detection altitude is below 6 km or above 6 km, respectively. It has a wind velocity measuring range from 0 to 60 m/s and wind velocity measuring precision of 1m/s or 1.5 m/s when wind velocity is less than or greater than 6 m/s, respectively.). The principal goal was to compare horizontal wind profiles from the WPR and the DWL operated nearly coincidentally in space and time. The wind speed and direction accuracies of WPR are expected to be better than 1m/s and 10° respectively, with about 250 m spatial resolution and 30 min temporal resolution. We performed the inter-comparison experiment of wind measurements from 22:00pm on December 18 2009 to 05:00am on December 19 2009. During the experiment, we obtained vector data by rotating the scanner to measure line-of-sight wind profiles at four azimuth angles with a fixed elevation angle of 60°. The three photo-counting PMTs are binned with an about 285m range resolution below the altitude of 20 km and binned with about 570 m range resolution above the altitude of 20 km and integrated for 12600 shots in 7 minutes at each line of sight. The four direction radial wind profiles were combined to retrieve the horizontal wind speed and direction every 30min.
Fig. 3 shows a summary of the comparison of wind speed and direction from 2 km to about 8 km due to the limitation of WPR. Five-point stars represent the DWL measured results along with error bars. The crosses are the WPR measurement results. In order to get higher signalto- noise ratio, we accumulated more pulses than usual for the high altitude wind measurement. The wind speed and direction data from the DWL and the WPR show good consistency from 2 km to 8 km,but there are some differences between the two results. The difference of wind speed and direction at the altitude of 2 km could be due to the nonlinearity of the detectors operating in photoncounting mode. Wind speed and direction errors range from 0.8 m/s and 15.1° at 3 km to 1.3 m/s and 5° at 8 km. The maximum values of errors are 1.8 m/s and 16° in the compared range of 2 km~8 km at wind speed and direction respectively. These errors include both instrumental effects and atmospheric variability during the 30min measurement period. Since the meteorological conditions are relatively stable during the experiment, the results of comparison were useful for examining the instrumental errors.
In order to measure the atmospheric wind field in the stratosphere, a Rayleigh Doppler wind LIDAR system based on a triple Fabry-Perot etalon is being built in Hefei, China and will be finished at the end of this year. Now, the assembling of the LIDAR system has been done and the primary measuring result has been obtained. The result indicates that the detection range of the LIDAR system can reach at 50 km attitude under good weather conditions, and there is good consistency between the wind measurement result of DWL and WPL at low attitudes (from 2 km to about 8 km). In the future, the wind retrieval method and the analysis of the measurement errors will be further explored.