Aerosols and clouds significantly influence atmospheric climatic conditions through the scattering and absorption of incoming solar and outgoing thermal radiation [1,2]. An accurate measurement of the optical parameters of aerosols and clouds, such as the extinction coefficient, volume backscatter coefficient, and LIDAR ratio is required for modeling studies of the atmospheric dynamics [3].In particular, the LIDAR ratio is related to the size distribution, shape, and chemical composition of the particles [3]. A Mie scattering LIDAR has been used for retrieval of the optical parameters. However, the accurate measurement of the optical parameters of aerosols and clouds is limited by the requirement of an assumption about the relationship between the extinction and backscatter coefficients as in the Klett inversion method [4-7].
The Raman LIDAR Technique has the capability of overcoming the shortcoming of the Mie LIDAR and of achieving accurate measurement of the LIDAR ratio. In a Raman scattering LIDAR, the extinction coefficient of aerosols and clouds is measured by detecting the Raman backscatter signal from air molecules, assuming the vertical profiles of atmospheric density. [8, 9] The atmospheric density model can be assessed by using standard atmospheric models with the measured ground temperature and pressure [8].
Also, an aerosol extinction coefficient cannot be derived from a LIDAR signal without assuming an Ångstrom coefficient if we use the vibrational Raman signal and elastic signal. This assumption causes systematic errors because the Ångstrom coefficient of aerosol also depends on the type of aerosol [10].
A high-spectral-resolution LIDAR(HSRL) can provide direct observations of the LIDAR ratio of atmospheric aerosols. An HSRL separates the particulate scattering signal by aerosols or clouds and the Rayleigh scattering signal from atmospheric molecules with means of a narrow-spectral-bandwidth rejection filter. Though this system does not require an assumption about the relationship between the extinction and backscatter coefficients of aerosol and cloud, the system is complex to use. Recently, Kim and Cha have suggested a fiber-based rotational Raman LIDAR technique [11]. In this method, the extinction coefficient of aerosol and cloud is measured by detecting the rotational Raman signal and elastic signal from the atmosphere, without any assumptions about the Ångstrom coefficient.
II. THEORETICAL BACKGROUND AND EXPERIMENTAL SETUP
In this section, we describe the rotational Raman algorithm and how it estimates the LIDAR ratio from return signals. The algorithm employs Kim and Cha's paper [11]. Using this algorithm, we can obtain the aerosol backscattering coefficient without any assumption. The data processing of the Raman method for retrieving the aerosol extinction coefficient was described in Ref. [8-9] in detail. The Raman LIDAR equation can be written as
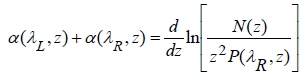
Where α is the range dependent total extinction coefficient at wavelength λL (elastic channel) and λR (Raman channel), respectively. N(z) is the atmospheric number density of the Raman scatter and P is the power received from distance z . Splitting the extinction coefficient into the aerosol and molecular parts, which will be denoted by αaer and αmol, respectively, and then assuming a wavelength dependence of the aerosol extinction αaer(λ,z)(특수문자)λ-k, Eq. (1) can be solved for the aerosol extinction at the emitted laser wavelength as
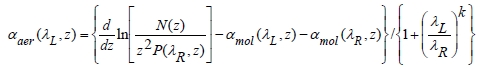
Where, k is the Ångstrom exponent. In the case of rotational Raman LIDAR processes, the value of λL/λR is 1. So, the extinction coefficient of aerosols and clouds is measured by detecting the rotational Raman signal and elastic signal from the atmosphere, without any assumptions about the Ångstrom coefficient.
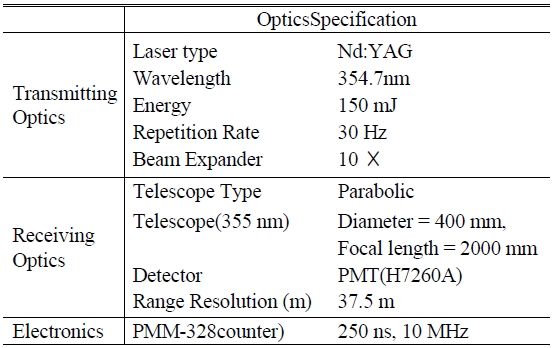
[TABLE 1.] The specification parameters of the fiber-based rotational Raman LIDAR system.

The specification parameters of the fiber-based rotational Raman LIDAR system.
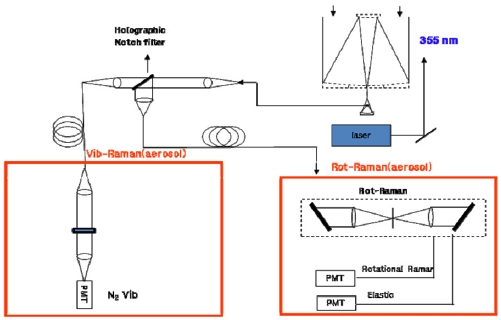
A schematic diagram of the fiber-based rotational Raman LIDAR system is shown in Fig. 1. A Nd:YAG pulsed laser is employed as the light source, which produces 6-ns pulses at 30 Hz repetition rate and maximum energy of 150 mJ per pulse at 354.7 nm after third-harmonic generation. The laser beam diameter is 10 mm and is expanded to 100 mm with a 10 times beam expander which reduces the beam divergence. The LIDAR signal from a telescope is the input of the double monochrometer. The fiber-based double monochrometer is composed of two gratings, collimating lenses, and optical fibers. In the double monochrometer, the position of the input fiber is higher than the optical axis of the 1st lens and the grating, so the diffracted signal is below the optical axis of the 1st grating and the lens. The first output image plane is another input of the 2nd monochrometer, which is composed of lens and grating. In this image plane, all the wavelengths are dispersed by the grating, passed through the slit, and are diffracted by another grating. A detailed description of the fiber-based rotational Raman LIDAR system is given in Ref [11]. Three PMTs detect the optical signals for the elastic and inelastic wavelengths. The signals are recorded with a time-bin width of 250 ns. The specifications of the fiber-based rotational Raman LIDAR system are given in Table 1.
The fiber-based rotational Raman LIDAR system has been operated to measure the aerosol optical properties at the Korea Atomic Energy Research Institute (36.20°N, 127.26 °E). The backscattered signals were collected with a temporal resolution of 6 min and a spatial resolution of 37.5 m. To subtract atmospheric background signals, we have collected the background signals up to 5 μs before shooting of the laser pulse. Since the cross section of the Raman scattering is about three orders of magnitude smaller than that of the Rayleigh scattering, the Raman detection channel requires a strong suppression of the Rayleigh-Mie-line. In our case, a fiber-based double grating monochrometer and a notch filter are used simultaneously for receiving LIDAR signals. The rejection factor is at least 10-8 for the double grating monochrometer and 10-4 for the notch filter.
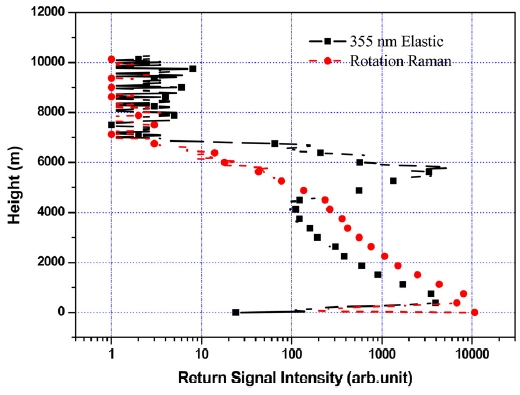
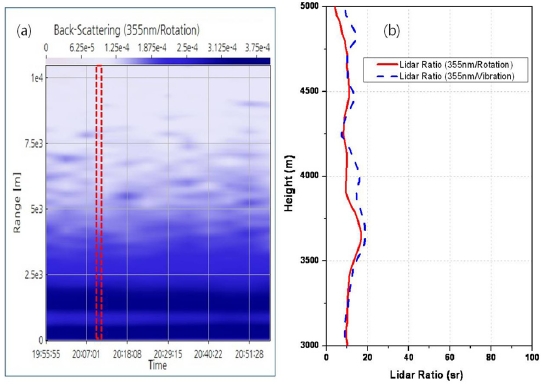
Figure 2 shows the measured rotational Raman and the elastic LIDAR signals. As shown in the figure, the strong elastic backscatter signal was measured in the presence of clouds at around 6 km, while the rotational Raman signal disappeared in this region. These results show that the elastic signals were not affected in the rotational Raman channel. A time height intensity (THI), which is an aerosol backscatter coefficient derived from the rotational Raman signal, is shown in Fig. 3 (a). Most aerosols were detected below an altitude of 2 km during the measurement as shown in Fig. 3(a). The overlap height of the LIDAR system was higher than 2 km because the telescope is far from the laser source. For this reason, the aerosol extinction coefficient and LIDAR ratio were measured above a height of 3 km. Fig. 3(b) show the LIDAR ratios which were retrieved from the rotational Raman and the vibrational Raman signals. Because the optical property is measured in clear weather, the profiles of the LIDAR ratio are similar to each other at all altitudes. However, the profiles are not agreement. It is believed that is caused by using different methods for obtained the backscattering coefficient and by the assumption of the value of the Ångstrom exponent in the vibrational Raman process.
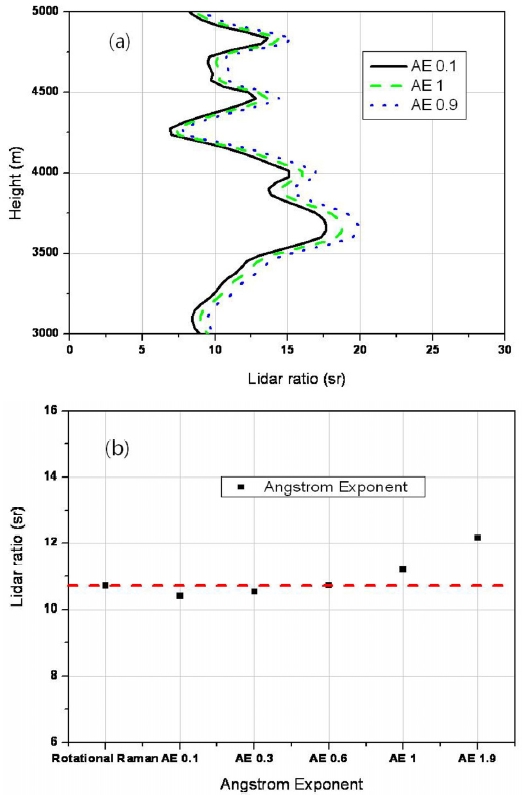
Fig. 4 (a) shows the profiles of the LIDAR ratios measured by the vibrational Raman signal with changes in the Ångstrom exponent values. As shown in the figure, the difference in the LIDAR ratio values with changes in the Ångstrom exponent values have appeared. The average values of the LIDAR ratio were taken in the height of 3-5 km with the varied values of the Ångstrom exponent (Fig. 4(b)). The range-integrated Ångstrom exponents from the vibrational Raman LIDAR observations were compared with those derived from the rotational Raman LIDAR measurements. As shown in Fig 4(b), the LIDAR ratio obtained from the vibrational Raman process at an Ångstrom exponent value of 0.6 correspond to that of the rotational Raman. This value is varied depending on atmospheric conditions because the Ångstrom exponent depends on the aerosol type, the humidity and so on [12].
A fiber-based Raman system operated at a wavelength of 354.7 nm was built for the observation of aerosol optical properties. By using the system, we can measure the profiles of the LIDAR ratio from the vibrational Raman and the rotational Raman signals within a range of 3-5 km are similar. Additionally, the Ångstrom exponent could be obtained as a function of altitude easily. The Ångstrom exponent value is 0.6 in the height of 3-5 km in a clean condition. In the future, we have plan to measure the LIDAR ratio variation for different atmospheric conditions, and to verify the measured values with another instruments, such as a sun photometer and with satellite data.