Joint transform correlator (JTC) has shown remarkableachievements and is a useful alternative to the other opticalsystems [1-3] for pattern recognition and target trackingapplications. The typical advantages of the JTC is that ituses a type of real time optical system which quantitativelycompares images by measuring correlation peaks andpeak signal-to-noise ratios (PSNR). However, it has someproblems on nonlinearity of the optical component such asa digital camera and on weak correlation discriminationcaused by noise.
Recently, many kinds of methods for solving such problems in the JTC have been studied. Among them, the nonlinear joint transform correlator (NJTC) and the binary NJTC which can solve a problem of the nonlinear and digital components in the JTC system may be the most typical [4-7]. In spite of such efforts, a weak correlation peak and noise problems still remain. The weak correlation peak and noise problems originate from the interference fringes constructed with Fourier transformed reference and sample images in the Fourier transform plane. Some useful work has been done to solve these problems. Phase and amplitude threshold and fringe adjustment in the spatial or Fourier domains are the most typical methods [8-11].
Unlike the phase threshold technique, which uses thephase information multiplied by a simple phase functionand adds a binarization step in the Fourier plane [9], wepropose a new method of random and additional phaseadjusted binary NJTC. The proposed new method utilizesa random phase adjustment in the first step to adjust thephase difference between the reference and input signal,and also an additional phase adjustment in the second stepto minimize the total phase error. This new method showsconsiderably increased correlation peaks and PSNR comparedwith the former techniques of phase threshold multipliedby a simple phase function. Simulated results are presentedto show the optimum condition of adjusting the phasefunction to minimize the total phase difference, and finallyits effects on the correlation peaks, noise reduction and thelevel of discrimination.
In the following sections, the proposed new method ofrandom and additional phase-adjusted binary NJTC systemis described in detail. Section III describes simulationresults and discusses the pattern recognition enhancement,and finally some comments are contained in the conclusionsection.
II. NEW RANDOM AND ADDITIONAL PHASE ADJUSTMENT
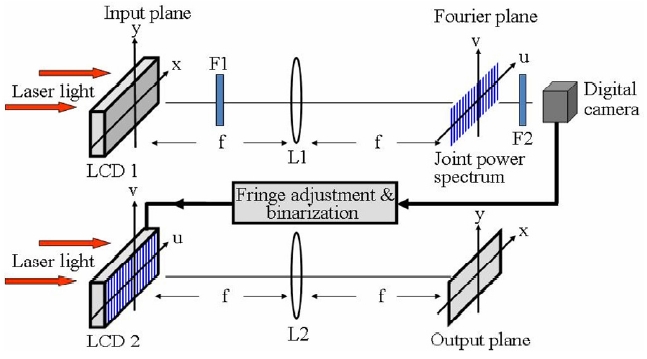
Figure 1 shows the optical structure of the new random and additional phase-adjusted binary NJTC system which phase compensates to produce the enhanced performance compared to the conventional binary NJTC. Generally, the
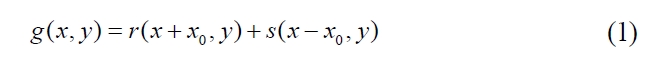
JTC has a two-stage process. In both stages the image ofa coherently illuminated input passes through a lens totake its Fourier transform. In the first stage of the JTC thebasic operation is to get the information of the object Fouriertransformed by Fourier transform lens L1 onto Fourierplane. Let us call the reference image r(x, y) and the inputimage s(x, y) and assume that those two inputs areseparated by 2xo. Then, the input joint images g(x, y) canbe expressed as
The information acquired on the Fourier plane is shownas mutually interfered fringe pattern between the Fouriertransformed value R(u, v) of the reference image r(x, y)and the Fourier transformed value S(u, v) of the inputimage s(x, y). The Fourier transformed signal of the inputjoint images can be expressed as
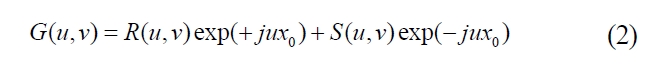
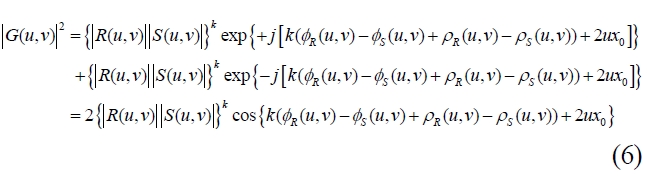
The intensity of this interference fringe pattern is calledthe joint power spectrum (JPS) and can be expressed as
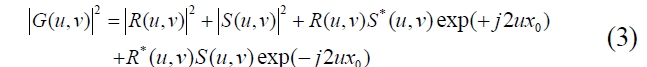
Here, * is the phase conjugate, u and v are independent spatial frequency variables scaled by a factor of 2π/λ, where λ is the wavelength of input collimated light and f is the focal length of the Fourier transforming lenses L1 and L2. The first and second terms in Eq. (3) are DC components which degrade the correlated signal obtained on the output plane in the second stage. DC components reconstructing a strong zero-order peak in the output plane are blocked and non-linearity parameter k, compensating the non-linear component problem such as a digital camera are included to obtain a well-correlated signal. Equation (4) indicates the JPS excluding the DC terms and including the non-linearity parameter
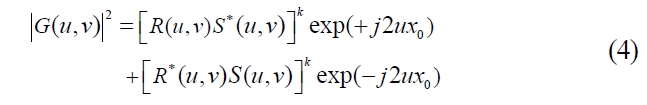
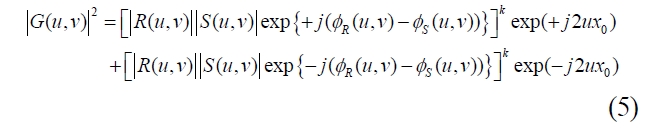
Actually the JPS contains an amplitude and phaseinformation of the reference and the input signals. Thus,Eq. (4) can be expressed as involving the amplitude andthe phase of the Fourier transformed reference and inputsignals as
Here 'G(
Here,

Here, the adjusting random phase of the reference andthe input signal are assumed to be equal. Thus in the caseof two identical images, the correlation output in theoutput plane, namely the inverse Fourier plane, shows onlytwo strong impulse signals separated by a distance of 4x0.On the other hand, in the case of two different images, thecorrelated output shows two weak impulse signals causedby the phase difference shown in Eq. (6).
However, in the case of two identical images it is notobvious that the correlation peaks are a maximum value inspite of the random phase adjustment as expressed in Eq.(7). Thus, the components of the phase difference expressedin Eq. (6) must be considered to calculate the correlationoutput. Let’s consider first Eq. (4) excluding the DCterms. The output, inverse Fourier transform of Eq. (4),can be expressed as
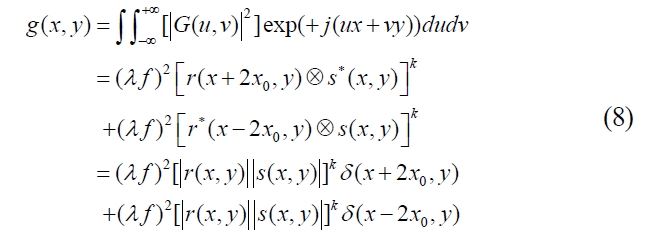
Here, ⓧ is the correlation operator. If the reference image perfectly matches the input image and there is no phase error between the reference image and the input image, the output can be expressed as
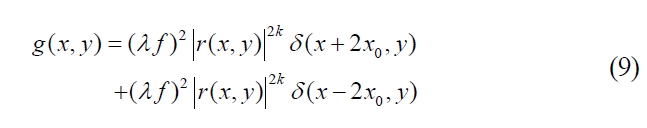
Thus, if we use the phase terms as shown in Eq. (6),Equation (8) can be expressed as
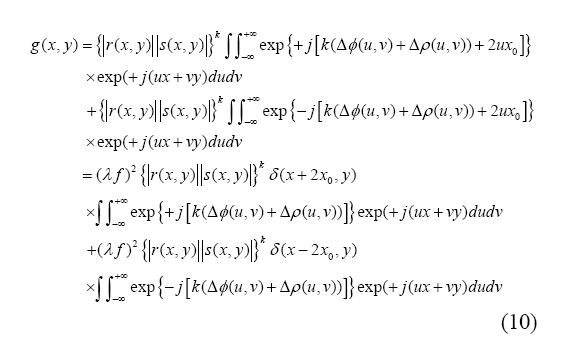
Here,
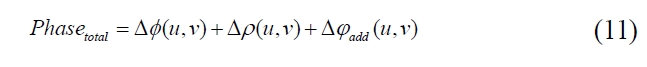
The purpose of this paper is to minimize this totalphase difference to zero to obtain the maximum correlationpeaks and PSNR by reducing the phase noise involved inEq. (10) to zero. In the next section, we present the simulatedresults by using the mathematical model shown in Eq.(10) and (11).
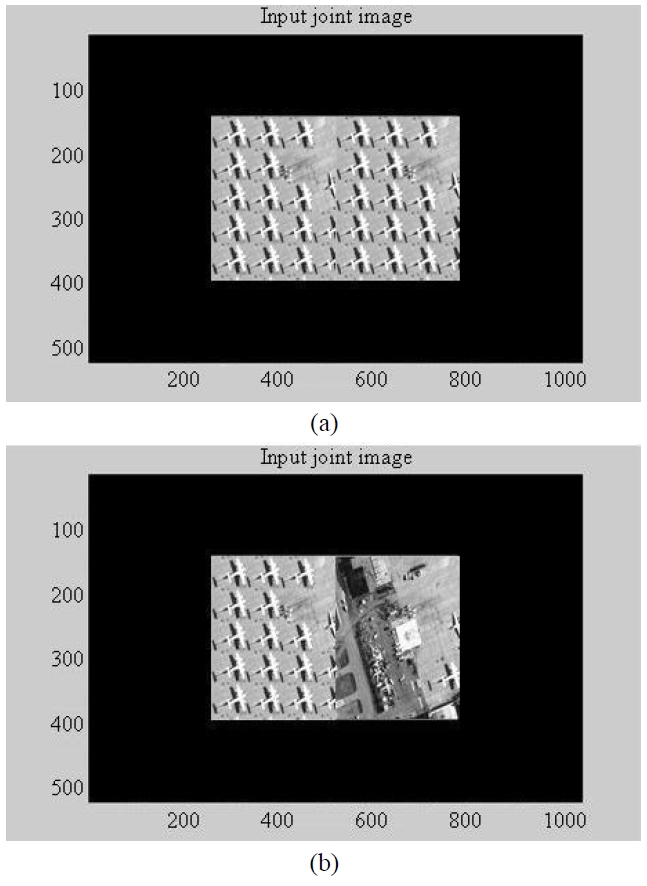
To evaluate the performance of the proposed new technique of random phase adjustment in the spatial domain and additional phase adjustment in the Fourier plane, we prepared two types of 256 × 256 gray images of an airfield. Figure 2 shows input joint images of the reference and the input sample image. In Fig. 2, the upper part is for the matched case and the bottom part is for the mismatched case. In this paper, we introduced two widely used parameters; the correlation peaks and PSNR. Correlation peak
is defined as the peak magnitude of the correlated signal and PSNR is defined as the ratio of correlation peaks to the average noise around the correlation peaks. If we let the correlation peaks equal 'P(x,y)', then the PSNR can be defined as.
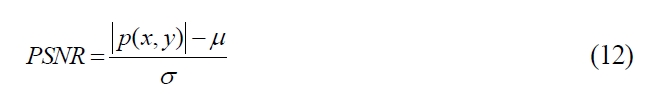
Where μ represents the mean value, and represents the standard deviation around the peak in the correlation output plane.
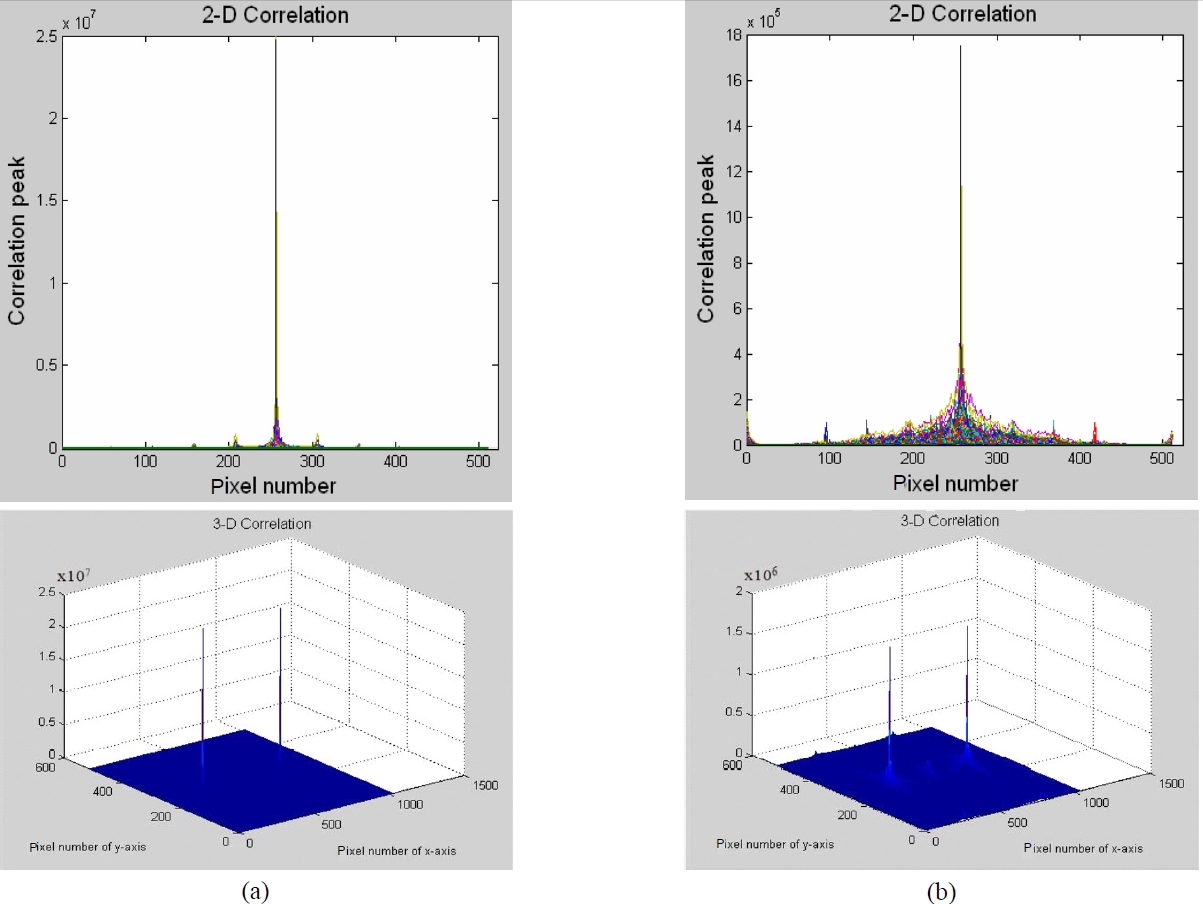
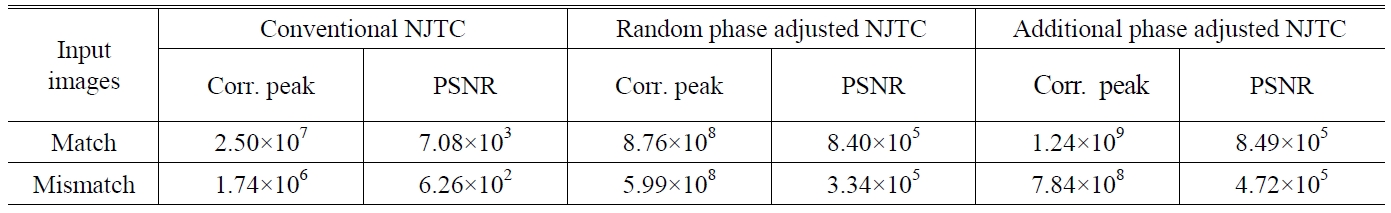
Table 1 shows the comparison of the simulation results for correlation peaks and PSNR, where k=0.5. The comparison was done between the conventional binary JTC and our new random phase and additional phase adjusted binary JTC. First, Table 1 indicates the correlation peaks and PSNR in the case of using the conventional binary NJTC. When the reference image is identical with the input image, namely for the matched case, the value of the correlation peaks and PSNR are 2.50×10⁷ and 7.08×10³, respectively. In contrast, when the two images are different each other, namely for the mismatched case, the value of the correlation peaks and PSNR are 1.74×10⁶ and 6.26×10², respectively.
Second, concerning about using the proposed random phase adjustment in the spatial domain, Table 1 indicates that the whole of the correlation peaks and PSNR increased considerably when the random phase adjustment was used in place of the conventional binary NJTC. When the two images are identical each other, the value of the correlation peaks and PSNR are 8.56×10⁸ and 8.40×10⁵, respectively. In contrast, when the two images are different each other, the value of the correlation peaks and PSNR are 5.99×10⁸ and 3.34×10⁵, respectively.
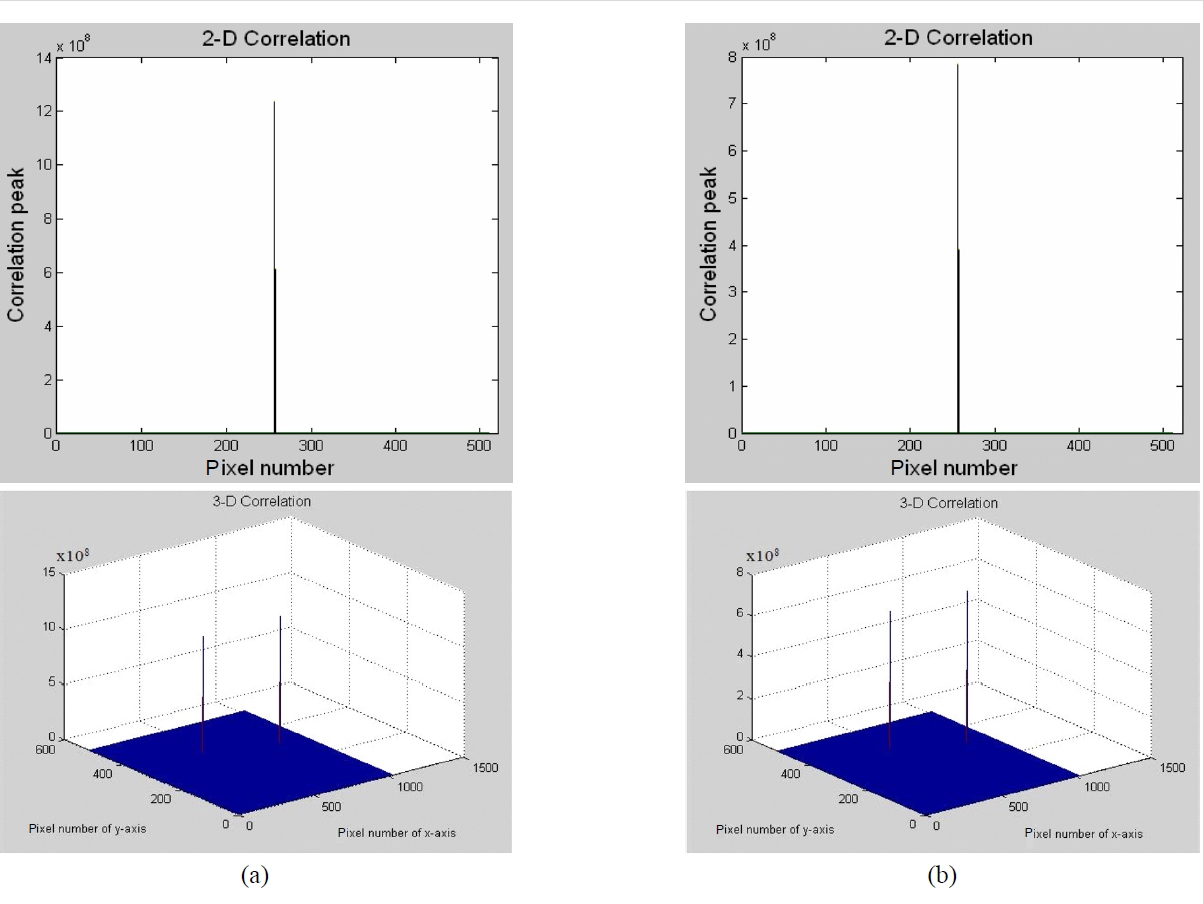
Next, concerning using the additional phase adjustment in the Fourier domain in addition to the random phase adjustment in the spatial domain, Table 1 indicates that all of the correlation peaks and PSNR increased. When the two images are identical to each other, the value of the correlation peaks and PSNR are 1.24×10⁹ and 8.49×10⁵, respectively. In contrast, when the two images are different fromeach other, the value of the correlation peaks and PSNR are 7.84×10⁸ and 4.72×10⁵, respectively. Let us pay attention to the values obtained for the correlation peaks and PSNR. From the results obtained we can find that if the conventional binary NJTC is modified with a random phase adjustment and even more with the additional phase adjustment, the correlation output shows highly improved amplitude and phase characteristics. Therefore, this result greatly improves the interference fringe pattern, and finally the correlation peaks and PSNR show more rapidly increased values. In addition, we can say finally that the noise contained in the interference fringe pattern are reduced considerably through the random and additional phase adjustment process.
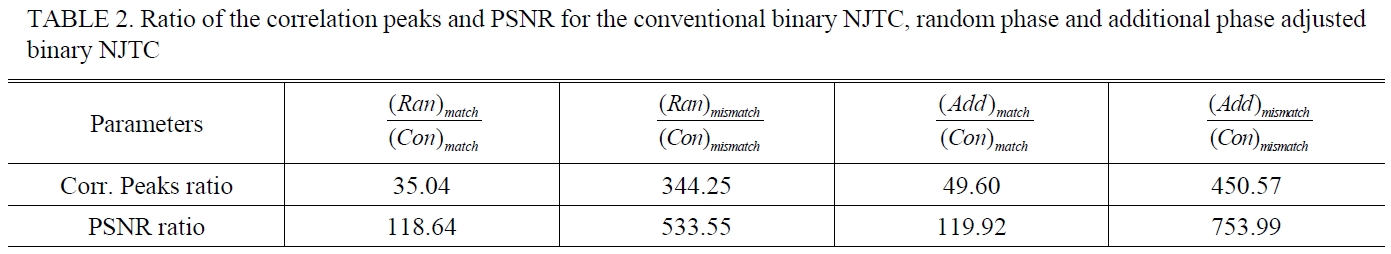
Table 2 proves these facts more strongly by comparing the ratio of the correlation peaks and PSNR obtained by using both the conventional binary NJTC and the random and additional phase adjusted binary NJTC. First, in the case of the random phase adjustment, when the two images are identical, the ratio of the correlation peaks and PSNR are 35.04 and 118.64, respectively. In contrast, when two images are different from each other, the ratio of the correlation peaks and PSNR are 344.25 and 533.55, respectively. These results reveal that PSNR shows better improvement than the correlation peaks, thus it is clear that the sidelobe noise around the correlation peaks is reduced considerably. Again, these results reveal that the discrimination ratio,
Correlation peak and PSNR for the conventional binary NJTC, random phase and additional phase adjusted binary NJTC

Ratio of the correlation peaks and PSNR for the conventional binary NJTC, random phase and additional phase adjustedbinary NJTC
by which is meant the mismatching decision, was improved considerably. Second, in the case of the additional phase adjustment, when the two images are identical, the ratio of the correlation peaks and PSNR are 49.60 and 119.92, respectively. In contrast, when two images are different each other, the ratio of the correlation peaks and PSNR is 450.57 and 753.99, respectively. These results reveal the important fact that although the total phase difference of the JPS expressed in Eq. (6) is reduced to zero as expressed in Eq. (7), there still remain some phase problems. Therefore, this kind of remaining phase problem can be removed by additional phase adjustment, and thus finally it brings an additional improvementto the correlation peaks and PSNR.
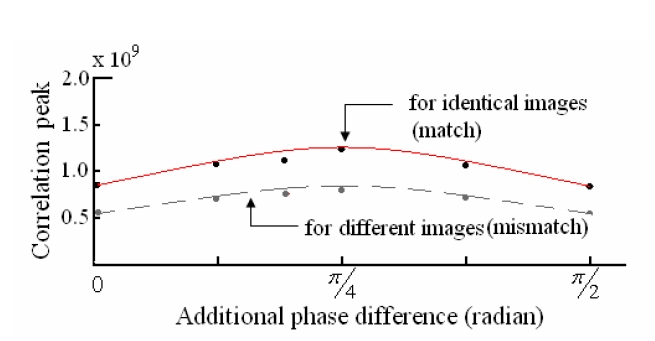
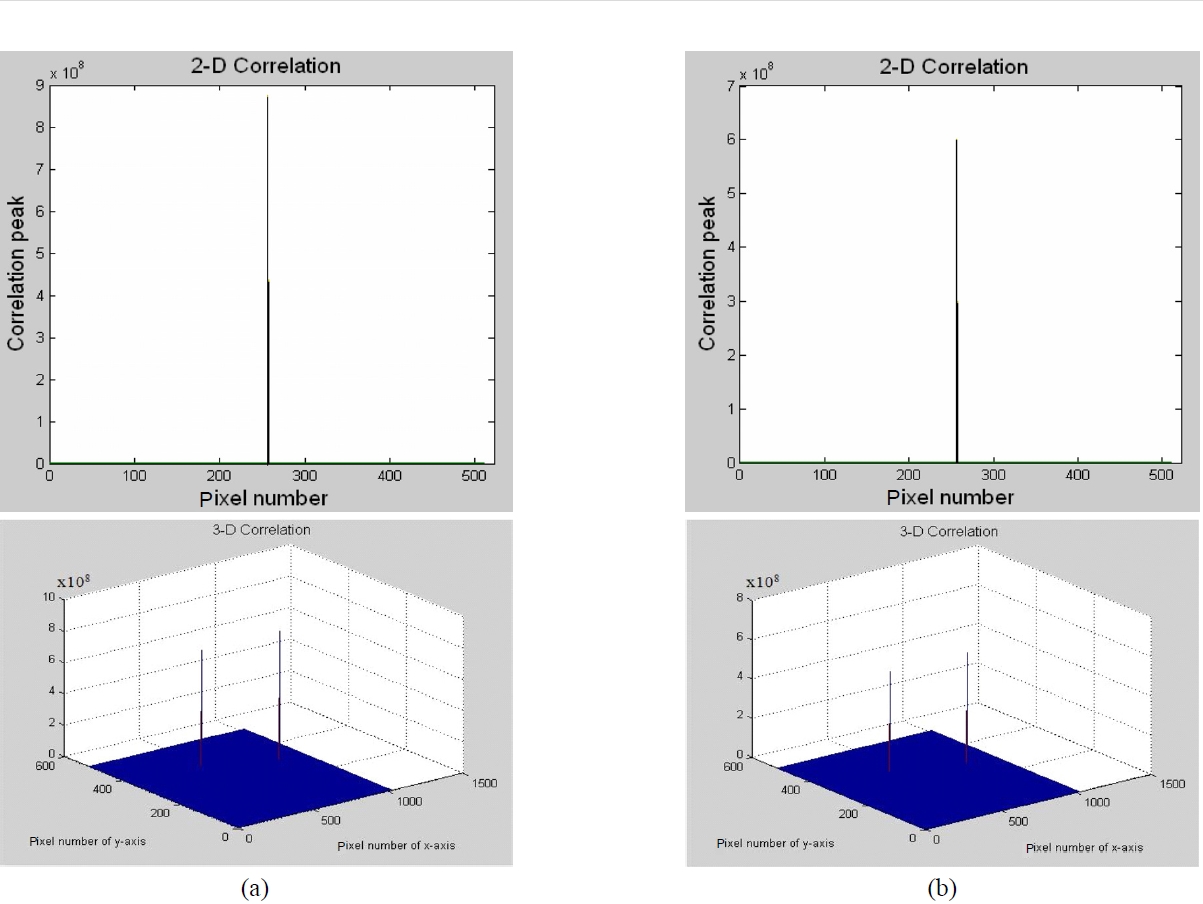
Figure 3 shows these results from a graphical point of view. In this paper, the optimum additional phase adjustment for the maximum correlation peaks is π/4 for both matched and mismatched case. Figure 4, Fig. 5 and Fig. 6 show the two and three dimensional pictures of the correlation peaks of the matched and mismatched cases, respectively, for the conventional binary NJTC, random and additional phase adjusted binary NJTC. Two dimentional pictures in these figures represent only one of two correlation peaks separated by the distance of 4x0.
IV. CONCLUSION
In this paper, we presented a new technique of modificationof the binary NJTC by adopting the random phaseadjustment in the spatial domain and additional phase adjustmentin the Fourier domain. Experimental results were presentedto show that the proposed phase adjustment technique cansuccessfully increase the correlation peaks, PSNR. In addition,final results reveal that PSNR shows more improvement thanthe correlation peaks, thus it is clear that the side-lobe noisearound the correlation peaks is reduced considerably by usingthe two steps of the newly proposed phase adjustment.