Together with the development of femtosecond lasers, temporal characterization techniques are intensively investigated. Autocorrelation methods have been widely used for their simplicity, but they cannot provide detailed specific information on pulse shape and dispersion characteristics. Spectrographic methods, such as frequency-resolved optical gating (FROG) [1], can provide complete information on a given pulse. This class of techniques, however, requires an iterative reconstruction of the pulse shape; so, there is a trade-off between the accuracy of reconstructed results and the speed of the reconstruction. The spectral phase interferometry for direct electric field reconstruction (SPIDER) method [2-3] in principle utilizes a combination of interferometry and spectral shearing to retrieve the phase information without using any iterative algorithm. As a result, the SPIDER method provides a fast and robust technique to reconstruct the temporal profile of the pulse. SPIDER is capable of operating in real-time which is extremely useful for fast optimization of femtosecond laser pulses. Furthermore, SPIDER techniques improved measurement speed and characterized individual laser pulses [4-5], but they focused on the measurements themselves. In this paper, we present a comprehensive design of a SPIDER apparatus that can rigorously provide the temporal characterization of a femtosecond Ti:Sapphire laser [6]. We also present the implementation of SPIDER for the real-time control of laser parameters to achieve specific laser performance.
II. PRINCIPLE OF THE SPIDER METHOD
It is well known that the Fourier transform opens up a possibility of reconstructing the temporal profile of a given pulse, if its spectrum and spectral phase are known. The spectrum can be obtained using a well-calibrated spectrometer. For spectral phase measurement, both SPIDER and direct optical spectral phase measurement (DOSPM) [7] were developed. Despite the fact that both of them can obtain the spectral phase with high accuracy, the complicated setup of DOSPM and the potential of single-shot operation of SPIDER had made SPIDER more appropriate for temporal characterization, especially for ultrashort laser pulses. Basically, SPIDER is a self-referencing variant of spectral interferometry [8] which is based on spectral shearing interferometry. Depending on the geometries of the shearing interferometry, several variants of SPIDER have been developed, such as the homodyne optical technique [9], zero-additional phase [10], and spatially encoded arrangement [11]. Most of these variants introduced additional components to make it a self-calibrating setup or to minimize the negative effect due to the disper sion of the additional optics. However, an improved conventional SPIDER [12] can still provide great performance over a broad range of measurable pulse durations, limited mostly by the conversion bandwidth of a nonlinear crystal used in its setup. In a conventional SPIDER, an interferometric setup is established and the interference signal is obtained from the sum frequency generation (SFG) of two beams: one temporally stretched beam, which is created by a grating stretcher or a block of dispersive glass, and the other beam containing two replicas of the pulse which can be generated either from a Michelson’s interferometer or by using an etalon glass. For a given sufficiently large stretching, the pulse will be dispersed strongly and, hence, each temporal slice of the stretched pulse is considered to be monochromatic. As a result, each of the replicas interacts with different spectral components of the stretched pulse. Furthermore, since each beam contains all of its phase information, the obtained interference signal is not only the interference of two time-delayed pulses, but it contains also the phase-difference information. Consequently, by applying Fourier transform, it is possible to retrieve the phase-difference information, or subsequently the phase information.
Given two spectrally sheared electric fields of the incident pulse and where is the spectral shear between the two fields, we have the interference signal given by
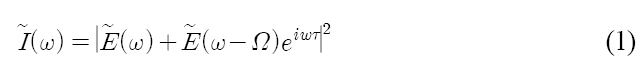
where τ is the time delay between the two pulses. By expanding the above equation, the interference signal is then rewritten as a combination of a DC signal and a modulating component defined by a phase-difference information φ(ω) - φ(ω-Ω) + ωτ. For obtaining this phasedifference information, we employ the Fourier transform analysis introduced by M. Takeda et al. [13]. If we let [Equation Ommited] (this is the background signal) and [Equation Ommited](These are the phase dependence parts.), Eq. (1) is then described as
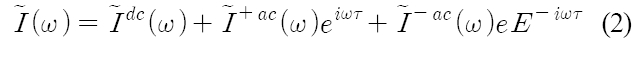
Thus the Fourier transform of this spectral intensity provides three components at times t = 0, ±τ. If we gate one of the sidebands to get only the τ component and do an inverse Fourier transform, the phase information φ(ω) - φ(ω-Ω) + ωτ. can be found in the argument of the transformed result. Then the measurement of the phase information without spectral shear (Ω = 0) gives the calibration phase ωτ. In order to find out the phase information φ(ω) from the phase-difference information φ(ω) - φ(ω-Ω), several different reconstruction methods have been developed. C. Dorrer et al. [14] proposed the reconstruction by integration (midpoint rule, Simpson’s rule and higher-order approximations) and by concatenation. In this paper, we adopt the concatenation method because the phase can be perfectly reconstructed if the sampling of interferogram satisfies the sampling theorem: for a pulse with compact temporal support T (Its energy is completely contained within a time window T.), the spectrum needs to be sampled with a maximum angular frequency 2π/T. In other words, the sampling theorem puts an upper limit on the shear: Ω ≤ 2π/T. Likewise, for a given spectral shear Ω, the maximum pulse duration that can be measured is determined by Tmax = 2π/Ω. Thus this formula could be derived that the spectral shear should be as small as possible so that one can characterize ultrashort pulses. Nevertheless, a small spectral shear can have the drawback of reducing the accuracy of the reconstruction due to noise and shot-to-shot instabilities. Consequently, for a SPIDER with a fixed shear, there is a trade-off between the range of the pulse duration that can be measured and the accuracy of reconstruction.
III. IMPLEMENTATION OF A REAL-TIME SPIDER AND ITS RESULTS
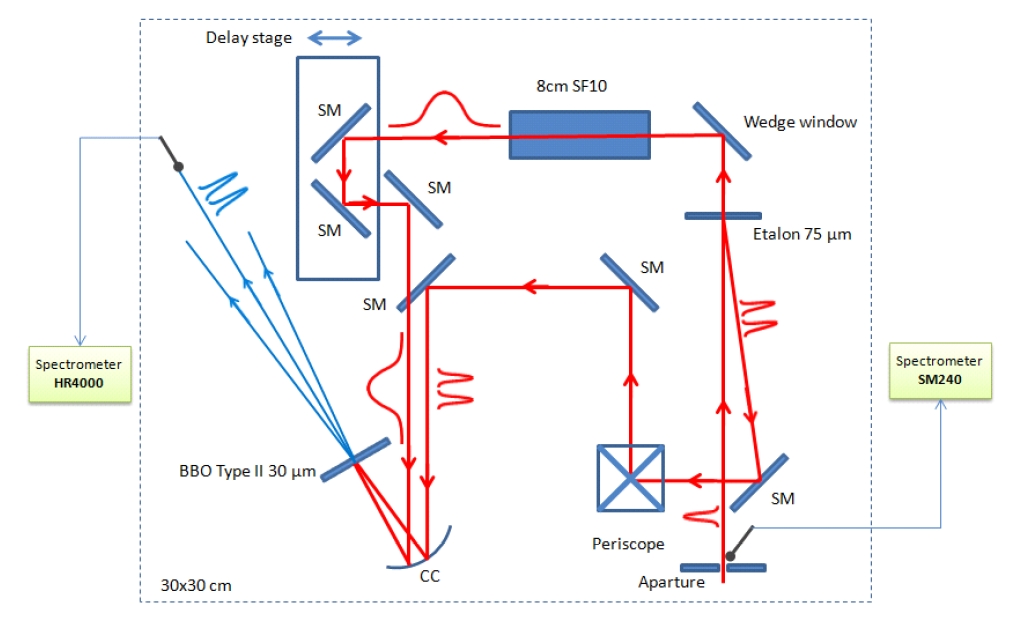
We have constructed a compact SPIDER apparatus for real-time temporal characterization of laser pulses from a kHz femtosecond Ti:Sapphire laser, as shown in Fig. 1. Our laser system consists of a long-cavity oscillator working at 27 MHz, a four-pass grating pulse stretcher, two multi-pass amplifiers, and finally a double-pass grating compressor. Typically, this laser system delivers pulses with energy of about 4 mJ and has the spectral width of about 40 nm centered at 810 nm. The laser pulse duration is expected to be about 30 fs. The parameters of the SPIDER apparatus are carefully chosen for maximum performance over the expected operating regime of our laser system. Furthermore, we tried to establish the SPIDER apparatus in a relatively compact package (30×30 cm), along with two external handy spectrometers. In our apparatus, an etalon glass with a thickness of 75 ㎛ provides two replicas of the incident pulse from the front and back reflections. The small reflectivity, 4%, at the two surfaces of the etalon makes the two replicas have almost equal intensities. The time delay, τ, between the two replicas is estimated to be about 0.75 ps. The transmitted beam through the etalon is stretched in an 8-cm SF10 glass block, creating the stretched beam. Due to the group delay dispersion (GDD), 12500 fs2/rad2, of the SF10 glass block at 810 nm, the duration of the stretched pulse is elongated to about 4 ps, making τ a reasonable value of time delay. The third order dispersion (TOD) generated by this crystal (8000 fs3/rad3) is not a big issue because for such a crystal, the TOD effect is very small, compared to that created by GDD. For example, the 10000 fs3/rad3 of TOD broadens the 30 fs pulse to the same pulse duration as the 200 fs2/rad2 of GDD does. This
amount of GDD corresponds to less than 1.5 mm of SF10 crystal. Therefore, the effect of the TOD of this crystal can be neglected. From the time delay and the GDD given above, our spectral shear is determined to be 6×10¹³ rad/s. This imposes a limit on measureable temporal window of about 100 fs. This spectral shear is, thus, an appropriate value for a measurement of femtosecond laser pulses of which duration is ~ 30 fs. The stretched pulse is then propagated through a delay stage, and together with the two replicas they are focused by a gold coated spherical concave mirror onto a type II beta barium borate (BBO) crystal with a thickness of 30 ㎛. This crystal thickness is found to be sufficient for the measurements of 30 fs pulses. Typically, it provides the second harmonic generation (SHG) conversion bandwidth of about 188 nm - full width at half maximum (FWHM) (centered at 810 nm), while the spectral bandwidth of 30 nm can support a transform limited pulse of 30 fs. (Note that the process of SFG is analogous to that of second harmonic generation (SHG), except that in SFG the two input waves are at different frequencies [15]; thus, the process of SHG corresponds to SFG with identical input frequencies). With the conversion bandwidth about 6 times higher than the transform limited requirement, the spectral components in our laser pulse can be up-converted uniformly. As a result, we can extract the spectral phase information correctly from the result of the SFG process. In addition, our laser pulse power is very high so that even a small part of the beam can make SFG effectively for such a thin crystal. Consequently, the SPIDER setup is well prepared for our measurements of femtosecond laser pulses.
The most important factor in our experiment which distinguishes our experimental apparatus from that of the earlier works is that the SPIDER interferogram and the incident laser spectrum are measured at the same time. In order to obtain a temporal profile using SPIDER, one should measure the laser spectrum, SPIDER interferogram and calibration interferogram. All three components should be acquired at the same time for correct reconstruction. In particular, for real-time operation, this problem should be carefully addressed in order not to make the real-time operation meaningless. However, acquiring three spectra at the same time might be complicated, because the data acquisition and processing will take the same amount of effort for each. Most SPIDER works, thus, measure only the SPIDER interferogram under an assumption that the spectrum and the calibration interferogram do not change much over an experimental run. In our work, we measured both SPIDER intereferogram and laser spectrum at the same time, making only one assumption of the calibration data. Since the calibration interferogram simply gives the constant spectral phase. If the grating position does not change, the constant spectral phase does not change much. As a consequence we can measure the temporal profile of our femtosecond laser in real-time without assumig a constant laser spectrum.
In order to acquire spectra for the calibration and the SPIDER interferogram signals, two spectrometers are used. One spectrometer (Spectral Products SM240, CVI) has 2048 effective pixels covering the spectral range from 276.2 to 1120 nm. Correspondingly, it offers the resolution of 0.41 nm/pixel. This resolution is adequate for spectrum measurements. For the purpose of recording the calibration and SPIDER interferograms, the other spectrometer (Ocean Optics HR4000) has been used. This spectrometer provides 3648 effective pixels with the spectral range from 198.5 to 655.8 nm; its resolution is 0.12 nm/pixel. Then based on the Nyquits limit (sampling theorem) and the distance between two fringes (2π/τ in the frequency domain), the estimated maximum etalon thickness to clearly distinguish fringes is 215 ㎛ (this value is calculated at the central SFG wavelength of 405 nm). Thus the interferograms recorded by this spectrometer can be precisely sampled without any ambiguity for any etalon thinner than the maximum thickness. Obviously, our choice of the etalon with 75-㎛ thickness sufficiently satisfies the sampling theorem. Nevertheless, one can claim that the replica created by the back reflection of an etalon undergoes an extra propagation in the etalon, while the replica created by the front reflection does not; subsequently a positive GDD is accumulated in that pulse, making the two pulses slightly different. An estimation of the dispersion, however, shows that the added GDD in the etalon is about 6 fs2/rad2, which broadens 30-fs pulses by less than 0.1 fs. As a consequence, this effect can be safely neglected.
The recording process is divided into two parts. The first part is to record calibration data. We block the stretched arm to allow only two replicas to focus on the crystal. The crystal is rotated to obtain strong SHG (not SFG). The spectrometer is then adjusted so as to record the spectral interferograms for the case of Ω = 0. The phase constructed from the Fourier transform corresponds to the ωτ component plus a constant spectral phase. Measuring SPIDER interferograms is the second part of the recording process. We unblock the stretched arm and carefully adjust the delay stage to make two beams overlapped temporally. Careful alignment of the crystal position, crystal angle, last silver mirror, and the optical fiber of the spectrometer can give the spatial overlapping of two beams and, subsequently, the maximum SFG signal. Here, the SFG signal provides the phase component φ(ω) - φ(ω-Ω) + ωτ plus a constant spectral phase.
Due to the fast reconstruction algorithm coming from the one-dimensional data set, SPIDER possesses the capability of real-time measurements. We developed a LabVIEW program for real-time SPIDER that controlled two spectrometers and the reconstruction process simultaneously, providing the real-time operation. Due to the processing time, the averaging time of the spectrometers is set to 20 ms, enabling a SPIDER speed up to 50 Hz. In this case, hardware triggering is not required because the internal trigger of the spectrometers can be used. Furthermore, the acquisition time is much longer than the repetition rate of the 1 kHz Ti:Sapphire laser; then averaging is considered to be useful. Obviously, one can apply a hardware trigger to operate the SPIDER in a single-shot operation, but at this speed, another problem, coming from damage of the BBO crystal due to increased laser energy on the crystal for sufficient signal level, arises. A small energy/pulse is enough for 20 ms acquisition time, but for 1 ms acquisition time, a higher energy is required. For real-time operation, the speed of the central processing unit (CPU) also limits the reconstruction speed; hence the overall measurement speed is reduced. Optimization is done by reorganization of the reconstruction code, removing the unnecessary items and displays, optimizing the calculation. As a result, the processing time is reduced to about 200 ms from 300 ms, setting the overall speed to be 3.5 Hz mainly due to the CPU speed of a typical laptop. Moreover, in this work we tried to reach a balance between the speed of the real-time operation and its usefulness. We set parameters and functions (for example, GDD, TOD calculations of the reconstructed spectral phase) to take full advantage of our SPIDER setup so that we can perform the optimization of femtosecond laser pulses rapidly.
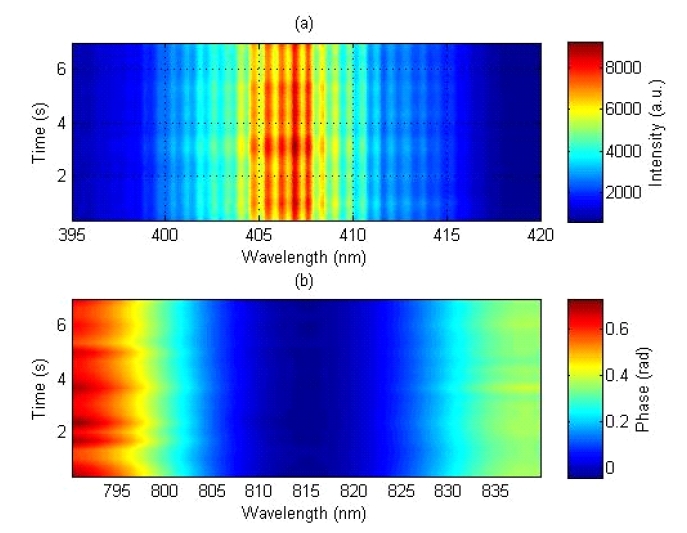
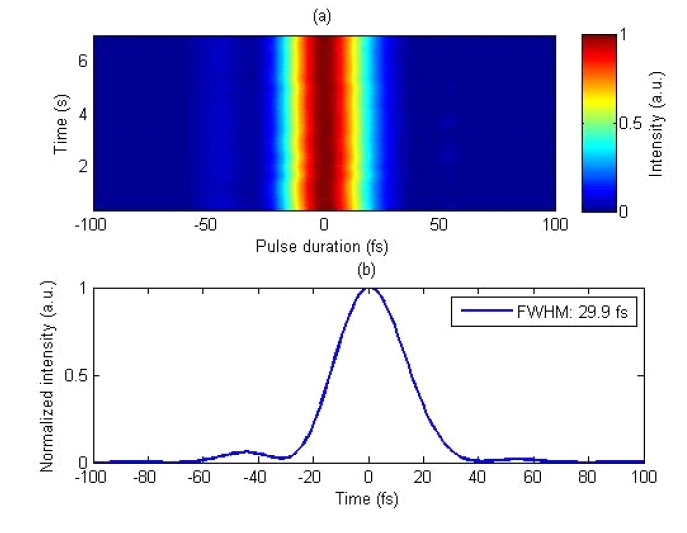
Figure 2 shows the acquired SPIDER interferograms and
reconstructed spectral phases of a 1 kHz femtosecond Ti:Sapphire laser. Figure 3 shows the time evolution of temporal profiles, measured for 7 s at the speed of 3.5 Hz, which exhibits stable laser operation. The pulse duration (FWHM) is measured to be 29.9 fs with the standard deviation of 0.1 fs. For comparison, the FROG measurement for comparable laser pulses is also carried out, obtaining a pulse duration of 29 fs (± 1 fs). The comparison of the results of the two methods shows good consistency, confirming the reliability of our SPIDER measurements. Furthermore, it is obvious that the reconstructed temporal profiles of the SPIDER measurements are visualized intuitively. As a result, this enables very fast adjustment of optical components and real-time optimization of laser pulses. The measured temporal profiles and pulse durations appear to be reasonably stable. This may come from the 20-ms integration time of the spectrometer. Though the spectral interferograms are acquired with 20-ms accumulation, all of the data is taken for much longer than the integration time; thus, it confirms the stability of the laser system.
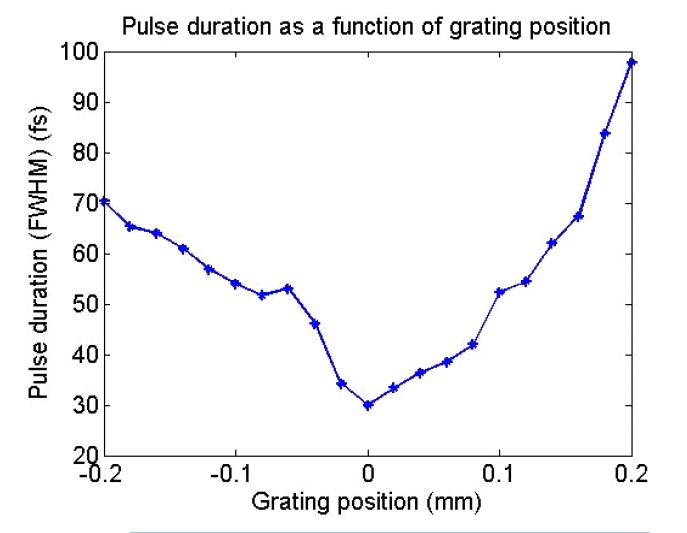
In addition, the effectiveness of this real-time SPIDER can be demonstrated plainly by applying it to optimize the pulse duration of femtosecond laser pulses. In a chirped pulse amplification laser, a grating compressor is used to recompress stretched pulses and also to compensate for the positive GDD generated by a stretcher and other optics. By varying the position of one grating, we can change the amount of GDD compensation, thus optimizing the pulse duration and the pulse profile. Figure 4 shows the pulse duration measurement with the grating scan after setting the position of the chirp-free condition to zero. As another application, the real-time SPIDER is applied to optimize the TOD of the femtosecond laser by adjusting the grating angle. Thanks to the fast operation, the high order spectral dispersions are calculated and displayed at the same time as the temporal profiles. Consequently, optimization can be
performed by changing a parameter such as grating position and observing the corresponding change in the displayed dispersion. The optimization is performed conveniently on the displayed dispersion. Typically, this is done by reducing the TOD from 4×10⁴ fs3/rad3 to 1×10⁴ fs3/rad3. Since the 30-fs pulses are injected into the hollow core fiber compressor to produce the shorter pulses, the smaller the high order spectral dispersions of the input pulses, the better the temporal profiles of the compressed pulses. Hence, the optimization by this real-time SPIDER makes the 30-fs pulses to be almost Gaussian and the compressed pulses to have the shortest possible duration.
A comprehensive real-time compact SPIDER apparatus is implemented. The apparatus is capable of measuring the pulse duration as short as 3.5 fs. The parameters are optimized for the maximum performance, improving the accuracy of the results. This experimental setup provides a fast and robust measurement. Furthermore, this apparatus is versatile and convenient to use with very high stability. Additionally, the real-time measurement makes the optimization of a femtosecond laser much easier and faster than before. This SPIDER will be utilized also for the temporal characterization of few-cycle laser pulses [16], making it a powerful tool for ultrafast science.