Blood consists mainly of red blood cells, white blood cells, platelets and a liquid component called plasma. The volumetric concentration of red blood cells is the highest among the components with concentration reaching 40-45%. Due to their high concentration in blood volume, the biophysical behaviors of red blood cells are important factors for determining the fluid dynamics of blood flow in the circulatory system. The blood flow is characterized as a non-Newtonian, elastic and solid-liquid phase flow that involves cell-free layers near the wall and also deformation of the red blood cells [1]. These dynamical and rheological features of blood flow determine the characteristics of the micro-vascular circulation that includes the flow in arterioles, venules, and capillaries. It has been reported that micro-vascular blood flow is crucial to maintaining metabolic balance in tissues, and the characteristics of blood flow can be used as indicators for the risk of circulatory diseases such as diabetics, hypertension and stroke [2-6].
Because of the importance of blood flow in the vascular network, various technologies have been used for in vivo and in vitro measurement of the velocity profile and volume of blood flow. The ultrasonic Doppler flow meter has been used in clinics and biology laboratories to measure the velocity of blood flow [7]. The photometric dual slit method based on the intravital microcopy was originally proposed by Wayland and Johnson in the 1960s, and it has been commonly used to measure blood flow [8]. Laser Doppler Velocimetry(LDV) has been employed to measure the in vivo blood velocity [9, 10]. LDV uses the light back-scattered from the blood flow to get the Doppler shift of the frequency. The shift is determined by the velocity of the blood flow. Recently, Doppler tomography was introduced to monitor blood velocity using an optical interference signal [11, 12].
From conventional flow visualization methods, we can obtain qualitative flow structure and information. Recently, however, large amounts of quantitative flow structure data are needed, including spatial distribution information. With the help of rapid advances in computers, optics and digital image processing techniques, instantaneous velocity fields can be extracted using a specially implemented Particle Image Velocimetry (PIV) technique. PIV is based on tracer particles which are seeded in the flow and assumed to follow the flow motion. A typical PIV system consists of a camera and a high power laser which are used to get tracer particle images. The fluid motion through a thin laser light sheet is investigated. It is possible to calculate a displacement vector for each particle for each window with the help of signal processing and autocorrelation or cross-correlation techniques. The displacement vectors can be converted to a velocity using the physical pixel distance and time interval information of a digital camera system. Nowadays, the PIV method is regarded as a reliable velocity field measurement technique and as a well-established optical measurement method for fluid visualization [13, 14]. Recently, due to the small dimensions of MEMS devices and to the needs of bio-technology applications, small flow field measurement can be applied by implementing the specific optical technique of micro-PIV, which overcomes the limitation of laser light sheet illumination [15, 16]. In biological applications, micro-PIV is very useful for determining rheological properties and behaviors of bio-fluids. Okuda et al [17] carried out in vitro blood flow measurement through a micro-round tube and compared the flow velocity profile with that of water flow.
The laser scanning confocal microscope was first developed by Minsky in the 1950s in order to overcome the limitations of the conventional wide field microscope, which could not be used for acquiring the sub-surface images [18, 19]. A laser source is focused to a point in the imaging plane and the back-scattered light from the focal point is reflected back to an optical detector. By employing a confocal pinhole (which is located at the conjugate focal point of the light source) in front of the detector, the detector could collect the light exclusively from the focal point of the imaging laser. The name ‘confocal’ stems from this geometrical configuration which uses two conjugated focal points. This confocal imaging scheme makes it possible to observe features beneath the surface of thin tissue samples. Because laser scanning confocal microscopy is based on point detection, either the laser beam or the sample should be scanned to acquire 2D or 3D images of the sample. While the lateral resolution of wide field microscopy is determineddeterminedsolely by the point spread function of the lightemitted from the sample, the lateral resolution of confocalmicroscopy is determined by the multiplication of pointspread functions of the illumination source and the emittedlight. This results in the superior resolution of confocalmicroscopy over wide field microscopy.
Kenneth Kihm’s group first employed confocal microscopy for micro-PIV in a micro channel [20]. They imaged fluorescent particles in the flow of a working fluid using confocal microscopy. By using a sequence of acquired images, they were able to get the velocity profile of the flow at different depths of the channel. Rui Lima et al. demonstrated confocal microscopy based micro-PIV for the blood flow in a micro-channel [21]. They mixed micron-size fluorescent spheres in the blood, and the fluorescent spheres were used as the tracing particles for PIV.
In this study, we demonstrate confocal microscopy micro- PIV of the blood flow using the blood cells as the tracing particles. The previous confocal microscopy PIV studies had been performed using the fluorescence of the exogenous particles which served as the tracing particles. We performed the confocal micro-PIV without using exogenous fluorescent particles, instead the blood cells serve as the tracing particles. A video rate confocal laser scanning microscope (CLSM) in reflection mode was employed to observe the motion of the blood cells. Micro-PIV was performed using the sequential images of the blood cells in the micro-channel.
2.1 Video-rate Confocal Laser Scanning Microscopy
In order to observe an optically sectioned fluorescent image of the skin sample, a home-built Confocal Laser Scanning Microscope (CLSM) was employed as the imaging apparatus. The home-built CLSM is based on the confocal detection utilizing a single pinhole in front of the photomultiplier tube (Hamamatsu, R3896, Japan). The diameter of the confocal pinhole was set to 75 ㎛. An Argon/Krypton laser (Edmund, 643-AP-A01,USA) was used as the excitation light source. The source laser operates on all lines in the visible range with maximum power as much as 20 mW in a TEM00 mode.
Fast raster scanning was conducted using a 36 facet polygon mirror (Lincoln Laser, DT-36-290-025, USA) that allowed us as many as 17,000 line scans with approximately 500 rotations per seconds. Slow axis scanning was implemented with a galvanometer mirror (Cambridge Technology, 6240H, USA) that has a mechanical scanning angle of ±10 with 20Hz repetition rates. Two mechanical scanners (the polygon mirror and the galvanometer mirror) were synchronized with a home-built synchronizer based on a laser diode, a bi-cell photo-diode, a TTL logic counter, timer and OP Amp. The synchronizer was designed to generate the HSYNC signal that indicated the start of the horizontal line scan and the VSYNC signal that indicated the start of a new frame.
Upon irradiation by the excitation light, the back-scattered light from the sample was collected by the objective lens and delivered to the PMT by retracing the optical path of the excitation light. The microscope was of the inversion type and the excitation laser power on the sample surface was measured as about 1 mW. We used a water-immersing objective lens from Zeiss (C Apochromat 40X) with Numerical Aperture of (NA) 1.2. The working distance of the objective lens is 170 ㎛, which can cover the whole image depth of current study. Given the specification of the objective lens, we were able to adjust the field of view by changing the focal length of the tube lens which is right before the objective lens. For the current study, an apochromatic lens with focal length of 200mm was used to allow us a total field of view of 500 ㎛ by 300 ㎛. The axial resolution of the CLSM can be defined as the axial position at which the detected intensity drops to half of that at the focal plane. The measured axial resolution was about 1.2 ㎛; i.e. the CLSM optically sectioned the image plane with slices of about 4 ㎛ thickness.
The analog signal from the photomultiplier tube was fed into a frame grabber (Active Silicon, Snapper-24, UK) along with the synchronization signals (HSYNC and VSYNC) from the synchronizer. The digitally converted signal from the frame grabber was used to acquire a snapshot image of the sample and a movie clip by using C-language based home-written software. More details on the home-built confocal microscope can be found in the literature [22].
2.2 Micro-channel and Pumping system and Particle Image Velocimetry
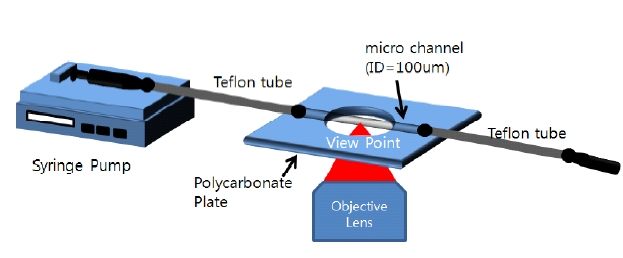
In order to image blood flow with the CLSM, a blood suspension was fed into a circular micro-channel using a micro-pump (FIG. 1.) We employed a syringe type pump (Harvard, Pump 11 Pico Plus, USA) and a round microchannel made of Borosilicate glass with 100 ㎛ inner dimension (Vitrocom, USA). Each end of the micro-channel was connected to a Teflon tube, and the Teflon tubes were connected to syringes. One syringe was connected to the pump to supply the working fluid into the channel and the other syringe worked as the drain reservoir. All joints of each part were bonded by using a glue stick that prevented fluid leakage by sealing the entire joint. The micro-channel module was attached to a polycarbonate plate which secured the channel to the stage of the microscope. Reflection from the surface of the micro-channel was reduced by employing diluting glycerol as a refractive index matching medium. In the present study, a two-frame cross-correlation PIV technique was employed to quantitatively measure the velocity fields based on blood cell tracing. Approximately 150 PIV measurements, corresponding to a period of about 5 seconds, were ensemble averaged. The interrogation window size was 25 × 25 pixels, and it overlapped 50% with a spatial resolution of 12.5 ㎛. Details of the micro-PIV method including measurement technique are described in Park et al [23].
3.1 CLSM imaging of blood cells in the flow of the blood suspension
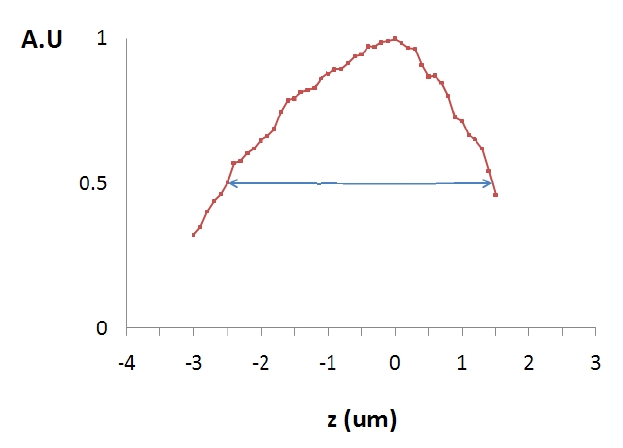
The axial resolution of the CLSM can be defined as the axial position at which the detected intensity drops to half of that at the focal plane of the objective lens. In order to measure the axial resolution of the CLSM, an aluminum mirror was placed on the image stage (polycarbonate plate in FIG. 1) prior to the PIV measurement. The reflection intensity from the mirror surface was measured as a function of the distance from the focal plane. Five measurements were made and the average value is presented in FIG. 2. The axial resolution was measured as about 4 ㎛: i.e. the CLSM is optically sectioning the image plane with 4 ㎛ thickness.
The flow of the blood suspension in the circular microchannel was observed using video-rate CLSM. The imaging plane was placed inside of the micro-channel and the images were acquired every 33msec, corresponding to a frame rate of 30 frames per second. A blood sample with 10% hematocrit was pumped into the micro-channel.
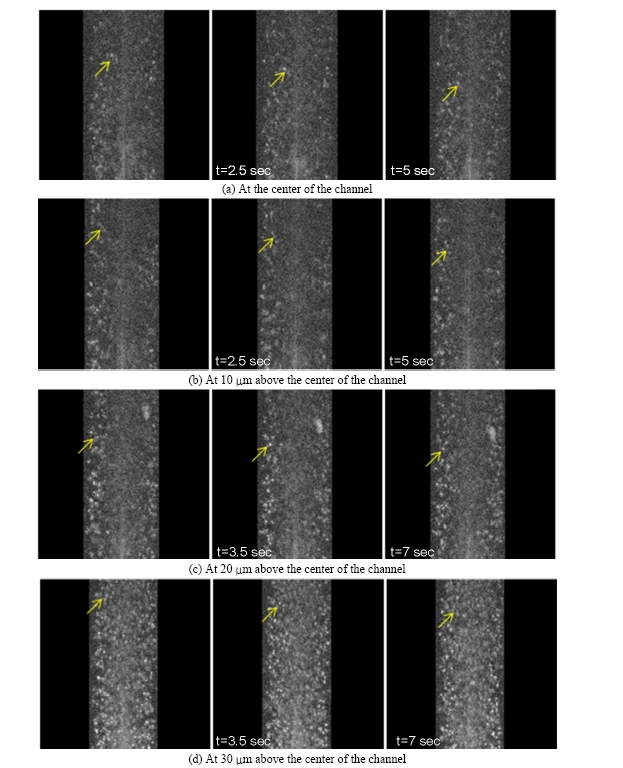
The sequential images of the blood flow at different depths of the channel (at the center and at 10 ㎛, 20 ㎛, 30 ㎛ above the center) are presented in FIG. 3. The images were taken in the reflection mode without employing exogenous fluorescent particles. The refractive index mismatching at the membrane of the blood cells made them observable due to the enhanced back-scattering at the membrane. Not surprisingly, we were able to observe the cells at 30 ㎛ above the center most clearly (FIG. 3.(a)). As the imaging plane gets closer to the center of the channel, the cell image is blurred due to the reduced intensity of the laser source and the back-scattered light.
In the sequential images, the individual cells were distinguishable and the dynamic behavior of the cells could be monitored. Some cells marked with arrows in the first frame were traceable in the subsequent frames because they remained in the image plane. However, some cells disappeared from the field of view because they flowed out of the image plane. It was obvious that the cells in the middle of the channel traveled faster than cells near the wall, as expected. The actual velocity of the cells was calculated using micro-PIV techniques.
3.2 Particle Image Velocimetry using the CLSM blood flow images
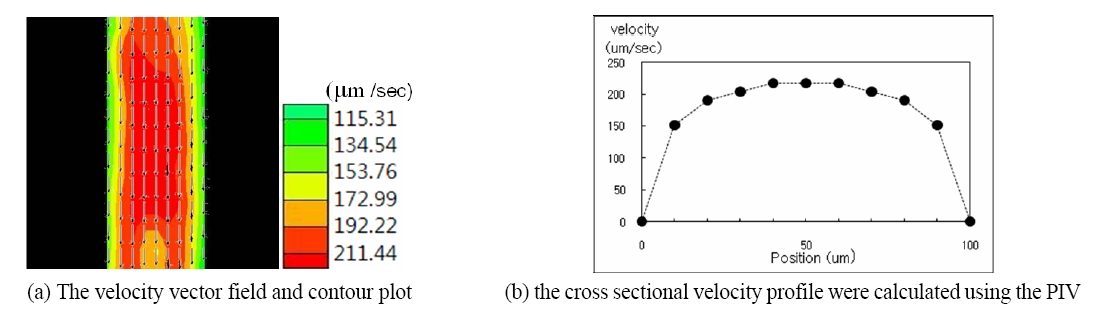
The velocity field of the blood suspension in the microchannel was calculated using micro-particle imaging velocimetry. The typical velocity profile in the horizontal plane in the middle of the micro-channel is shown in FIG. 4. FIG. 4.(a) shows the stream-wise mean velocity vector field and contour plots. FIG. 4.(b) shows the cross-sectional velocity profiles at the center of the y axis (Marked as the dashed line). As expected from the sequential raw images, the velocity in the middle of the channel shows the maximum velocity with approximately 200 ㎛/sec and the velocity gradually decreases when the wall of the channel is approached. The velocity profile has parabolic shape around the central section of the micro-tube, which is the characteristic feature of laminar flow in the low speed regime.
Since the working fluid used in this study is non-Newtonian blood, the flow can have shear-thinning viscosity characteristics. It is clearly observed in the velocity profile in FIG. 4.(b). As the shear rate increases near the wall regime, the viscosity decreases and the flow speed is relatively accelerated. In contrast, around the central region where the shear rate is small, the flow speed is reduced due to an increase in blood viscosity. Therefore, the velocity profile shape is a little blunter than that of Newtonian fluid.
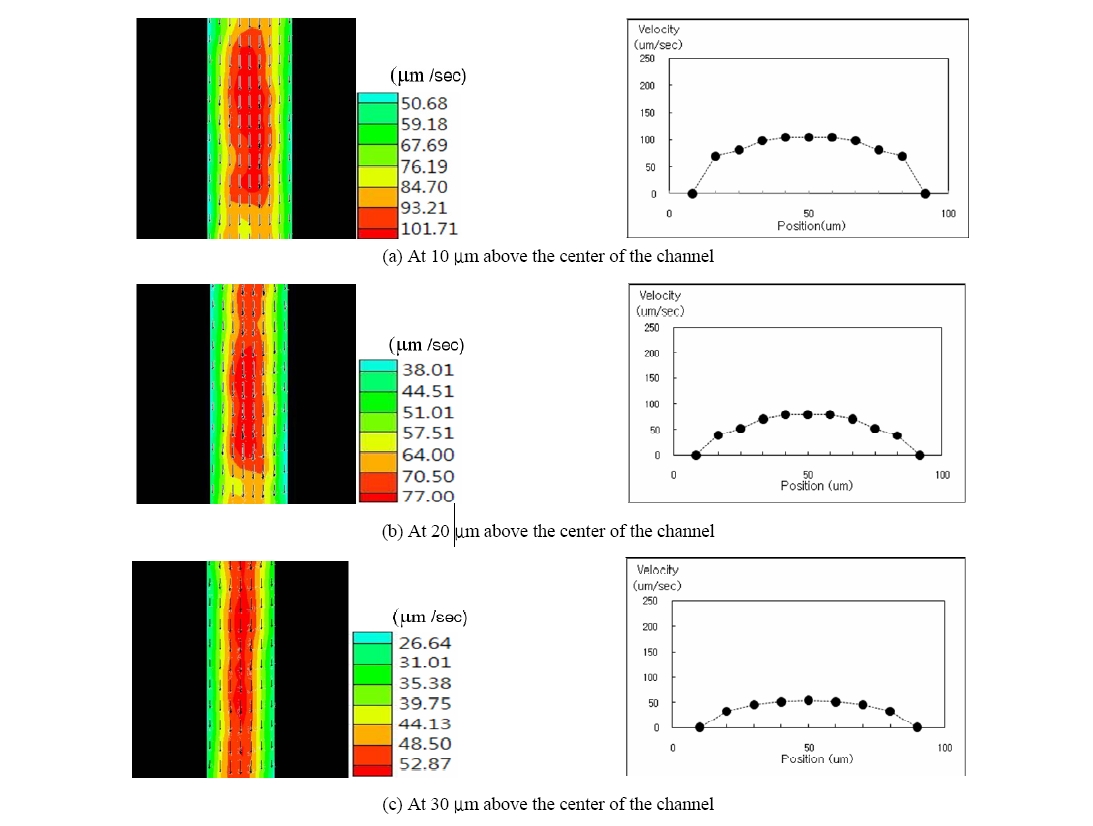
Based on the above peculiar flow characteristics, the blood flow at various depths of the micro channel was observed using the optical sectioning ability of the CLSM. The cross-sectional velocity profile for various depths was acquired using the PIV from the sequence of the CLSM images. FIG. 5 presents the cross-sectional velocity profile at various depths. It is obvious that the average velocity decreases as the optically sectioned plane gets closer to the wall due to the effect of the shear force from the wall.
The blood flow in the micro channel was observed using a home-built video-rate confocal laser scanning microscope. The blood suspension with hematocrit of 10% was pumped into a circular micro-channel with inner diameter of 100 ㎛. The blood flow in the micro-channel was observed with a confocal scanning laser microscope that allowed us to take images every 33ms. The individual blood cells could be distinguished from others, and the trajectory of each cell could be monitored in the sequential images. This indicates that the frame rate of the video rate CLSM (30 frames per second) is fast enough to trace the cells in the raw image.
The optical sectioning ability of the CLSM makes it possible to image the blood stream at different depths of the micro-channel with sectioning depth of 4 ㎛. Since the confocal microscope is designed to collect the back-scattered light of the focal plane exclusively, the blood stream for a particular depth could be monitored by adjusting the focal plane of the CLSM. In this study, the velocity profile at four different depths was measured and compared. We also can observe that there exists some irregularity in the velocity contour distribution due to the presence of many RBCs in the solution. It is basically attributed to the fact that the blood cells can show three-dimensional tumbling which will cause out-of plane motion. However, the velocity defect compared with entire mean velocity distribution is relatively small. Parabolic velocity profiles were observed at all measured depths. This means that near the tube wall regime there could be more possibility of three-dimensional cell motion because of abrupt shear rate variations. Therefore, we can see that the velocity contour defect is relatively increased at these depths as shown in FIG. 5.
Raw confocal microscopy images were used to get the velocity profile by employing micro-particle image velocimetry. It should be note that we have used blood cells as the tracing particles while the previous micro-PIV studies had employed exogenous particle as the tracing particles. We demonstrated that the micro-PIV of the blood flow in the micro-channel can be performed using the reflectance image of the blood cell instead of using fluorescent micro/nano particles.
The micro-PIV determined the cross-sectional velocity of the blood suspension. Under the pumping conditions used in this study, the velocity near the center of the channel was measured to be a few hundred ㎛/sec and the velocity near the wall was about tens of ㎛/sec. The velocity of the blood stream in the capillaries of live animals is reported to be in the range of 100 ㎛/sec ~ 1mm/sec. Since the confocal micro-PIV technique used in the study can measure a blood velocity of a few hundreds ㎛/sec, it is expected that the present technique can be applied for the in vivo blood flow measurement in animal capillaries. The velocity of blood cells can be measured as long as the penetration depth of microscopy is not limited.