Optical fiber laser gas sensors based on intra-cavity spectroscopy has attracted considerable interest due to their desirable features: inherent fiber compatibility, narrow linewidth, low detection limit, low noise and compact configuration [1]. High sensitivity Inter-Cavity Absorption Gas Sensor (ICAGS) can be achieved by inserting a gas cell into the fiber laser cavity [2]. In an ICAGS, usually Erbium-Doped Fiber (EDF) is used as the gain medium that its broad gain bandwidth covers absorption lines of pollutant gases of interest such as acetylene (C2H2) and permits multi-gas detection without changing light source. Moreover, the EDF based laser source usually exhibits nearly constant output power across a wide tuning range, high signal-to-noise (SNR) ratio, excellent power stability, and high tuning speed for fast modulation and/or detection.
In practical applications, in order to further enhance the sensitivity, other supplemental techniques are often utilized. Zhang et al. applied wavelength modulation technology(WMT) to ICAGS [3]. Ryu
The performance of an EDF based ICAGS is closely linked to the output signal power, tuning range and sensitivity which are determined by a number of critical parameters: intra-cavity loss, pump power, EDF length, output coupler ratio, etc. Optimal values of these parameters are to be determined, based on appropriate theoretical modeling, for the best system performance. Zhang et al investigated the sensitivity enhancement in EDF based ICAGS using rate equations only [6]. However, the relationship between the ICAGS system sensitivity / performance and the system parameters has not been duly investigated using both rate equations and propagation equations that takes into full consideration of the dynamics of doped atoms, pump, signal, cavity loss and feedback, etc.
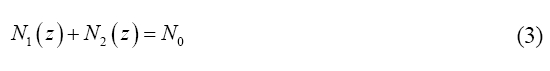
In this paper, we first investigated the sensitivity of ICAGS based on 980 nm pumped EDF ring laser, taking into consideration of the dynamics of doped atoms (in both ground and excited states), optical pump and signal, cavity loss and feedback, EDF length and gas absorption. Our analysis and simulation are carried out using the coupled rate equations and propagation equations. Firstly the output characteristics of the gas sensing system are briefly discussed. Then the gas detection sensitivity and spectral characteristics of the system are systematically investigated. Moreover, experiments are conducted to examine the sensitivity enhancement factor of the system under different intra-cavity losses and to evaluate ICAGS in acetylene detection. The experimental results agreed well with those of simulations and showed the ICAGS system could realize high sensitivity gas detection.
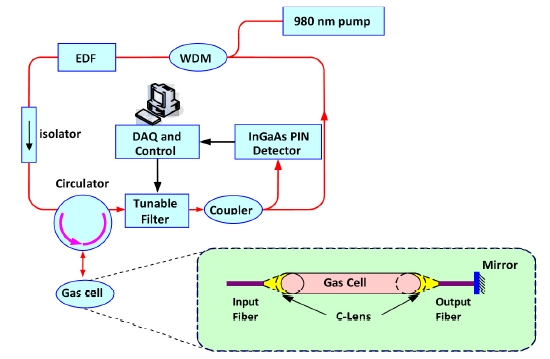
The schematic diagram of the gas sensor is shown in Fig. 1, including the following components: a 980 nm diode pump, a 980/1550 WDM coupler, an EDF, an isolator, a optical circulator, a gas cell, a pigtailed Fabry-Perot tunable filter (TF), a fiber coupler and a tunable attenuator. The isolator and the circulator are used to realize the one-direction transmission of the beam and they help to avoid spatial hole-burning. The bandwidth and the free spectral range (FSR) of the TF are 1.25 GHz and 11.23 THz respectively. The effective length of the gas cell is 10 cm, it is made by aligning a pair of commercial pigtailed selfoc lenses, which enable the gas cell with more favorable performance such as longer working distance and lower insertion losses. The attenuation of the signal induced by the gas is proportional to the gas concentration according to the Lambert-Beer’s law, and to be determined by the system.
An EDF fiber laser can be regarded as a two-level system pumped by a 1480 nm diode laser, or as a three-level system pumped by a 980 nm laser. When it is pumped by 980 nm diode, the ions absorb the pump power, transit to the high level, stay for a period (τ3) and then jump to the metastable state. Due to the value of τ3 is very small, it is reasonable to omit it and simplify the three-level system as two-level system. In our paper, the whole modeling is based on the two-level assumption.
III. RATE EQUATIONS AND PROPAGATION EQUATIONS
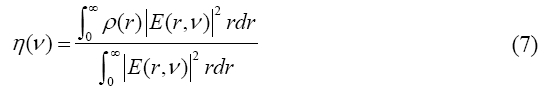
The rate equations are used to describe the effects of absorption, stimulated emission and spontaneous emission on the ions populations of the ground and metastable states. Based on the homogeneously broadened two-level assumption, the high energy level is assumed to be unpopulated. The atomic population densities of the ground and metastable states,
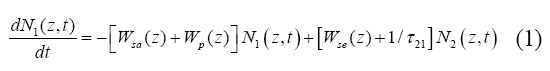
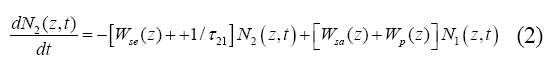
where τ21 is the spontaneous emission lifetime, N0 the dopant density of the EDF,
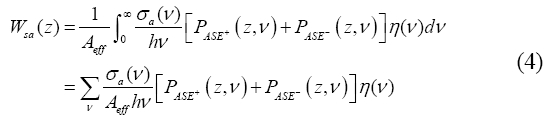
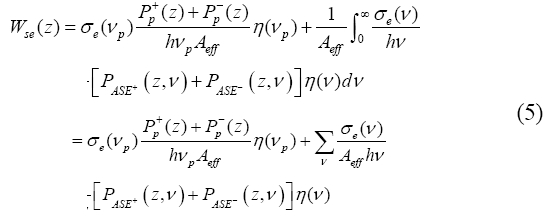
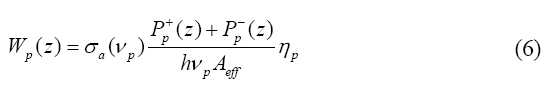
In Eq.4-6, σa is the absorption cross-section of EDF, σe is the emission cross-section of EDF,
The steady state photon number on the two-level can be obtained from Eq.1-3 by setting
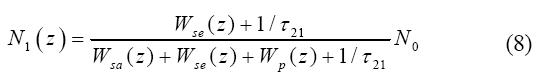
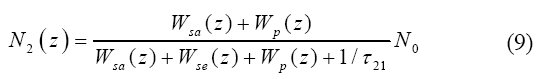
In combination with Eq.4-7, we can get expression of
We can assume light in the EDF amplifier propagates as a number of optical beams of frequency bandwidth Δν centered at the wavelength λ = c/ν. All emission and absorption cross sections included in the model are spectrally resolved. The spectral region from 1480 to 1600 nm is subdivided into 700 slots with Δλ=0.2 nm.
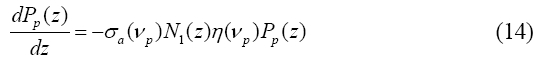
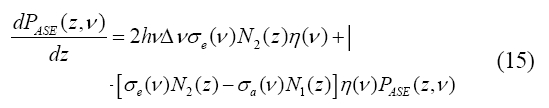
The propagation equation of the pump power Pp±(z) and ASE power PASE±(z,γ) is described by the following propagation equations [11-13]:
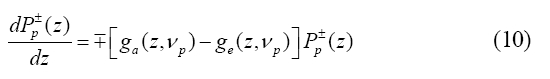
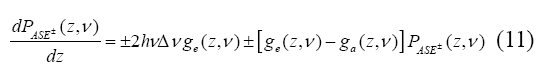
where ge(z,ν) and ga(z,ν) are the emission and absorption factors given by Eq.12 and 13. The term 2


Due to the isolator and single pump we use in the system, the pump and ASE light can be assumed to only transmit in the forward direction as follows (when the pump wavelength is 980 nm, σe(νp) = 0:
In order to model the ring laser operation, the output signals of the EDF amplifier are carried back to the input. Initially, the ASE power generated during the first step becomes the input signal of the second run and the signal obtained at the end of EDF is amplified in each run.
An iterative solution of the rate equations and propagation equations for the pump and both the forward and backward propagating amplified spontaneous emission powers was implemented using a fourth-order Runge-Kutta routine. Convergence can be reached in a few iterations. Based on the configuration shown in Fig. 1, appropriate boundary conditions are imposed at the beginning and at the end of the active fiber (z=0, L) on the pump power and the individual spectral components of forward and backward ASE and pump powers generated in the EDF. The powers are filtered by the tunable filter and attenuated by the loss of the intra-cavity and part of it is output via a 50:50 coupler. The boundary conditions for the pump and ASE powers are defined as follows:


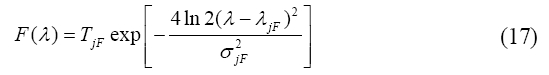
where Pp0 is the initial pump power coupled into the EDF, the upper index k denotes the iteration number, δring represents the total loss of the cavity, the coupler and the losses of other optical components. αcoup is the ratio of the coupler and F(ν) expressed in Eq.17 is the relative transmittance of the optical band-pass filter.
In the above equation,
The absorption spectroscopy is described based on Lambert-Beer’s law which is given as below [14]:

where I
IV. THEORETICAL AND EXPERIMENTAL STUDY
4.1 Theoretical results and discussions
4.1.1 Pump threshold
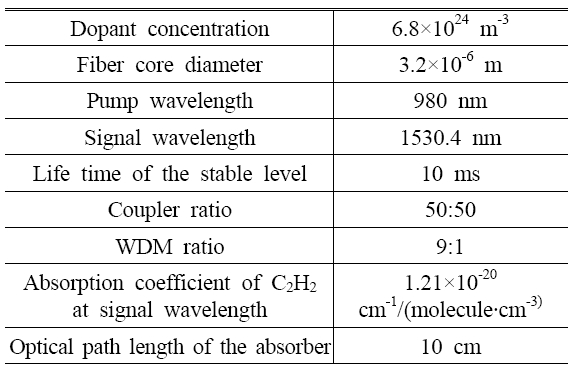
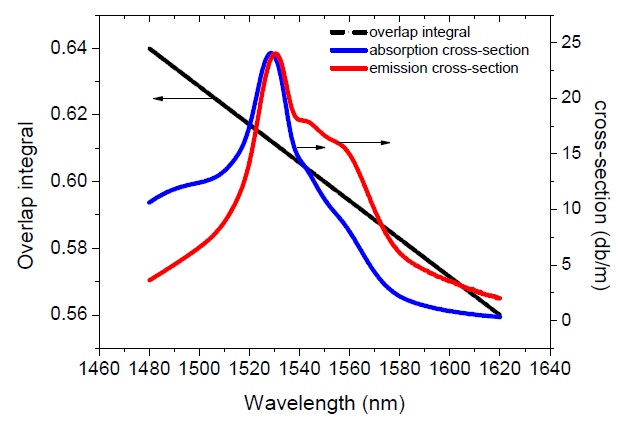
An EDF from Nufern is to be used in our experiment. Its absorption/emission coefficients are 23 dB/m and 24 dB/m respectively. The dopant concentration of the EDF is 6.8×1024 ions/m3, the core diameter is 3.2 μm and the numerical aperture is 0.25. The absorption and stimulated emission coefficient and overlap integral between the optical mode and the erbium ions of the EDF are shown in Fig. 2. From the simulations we found that the pump threshold is closely related to the difference between the absorption cross-section and emission cross-section. The overlap integral and the dopant concentration also affect the value of the pump threshold.
The TF we use in experiment is from Micron Optics with a bandwidth of 10 pm. The peak transmission of the TF is about 0.8. Other parameters we used which we don't specify can be found in Table.1.
Using the coupled rate equations and propagation equations established in the previous section and the parameters given above, in the following we will first investigate the pump threshold characteristics of the gas sensing system and then present a detailed investigation of the gas detection sensitivity and spectral characteristics of the system.
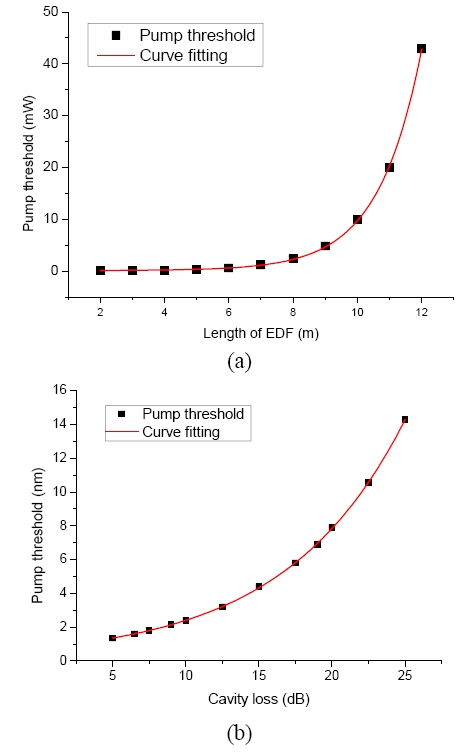
The effects of length of EDF and intra-cavity loss on the pump threshold have been determined and shown in Fig. 3. In Fig. 3(a), the cavity loss is set at 10 dB and the solid line is the fitted curve of the simulated results. It is obvious that the threshold pump changes in exponential relationship with the length of the EDF. In Fig. 3(b), the pump power is set at 2.4 mW, and the fitted curve also shows an exponential profile. From the results, we can see that, the pump threshold goes up with the increase of the EDF length and intra-cavity loss.
[Table. 1] Parameters used in numerical simulations

Parameters used in numerical simulations
4.1.2 Sensitivity enhancement
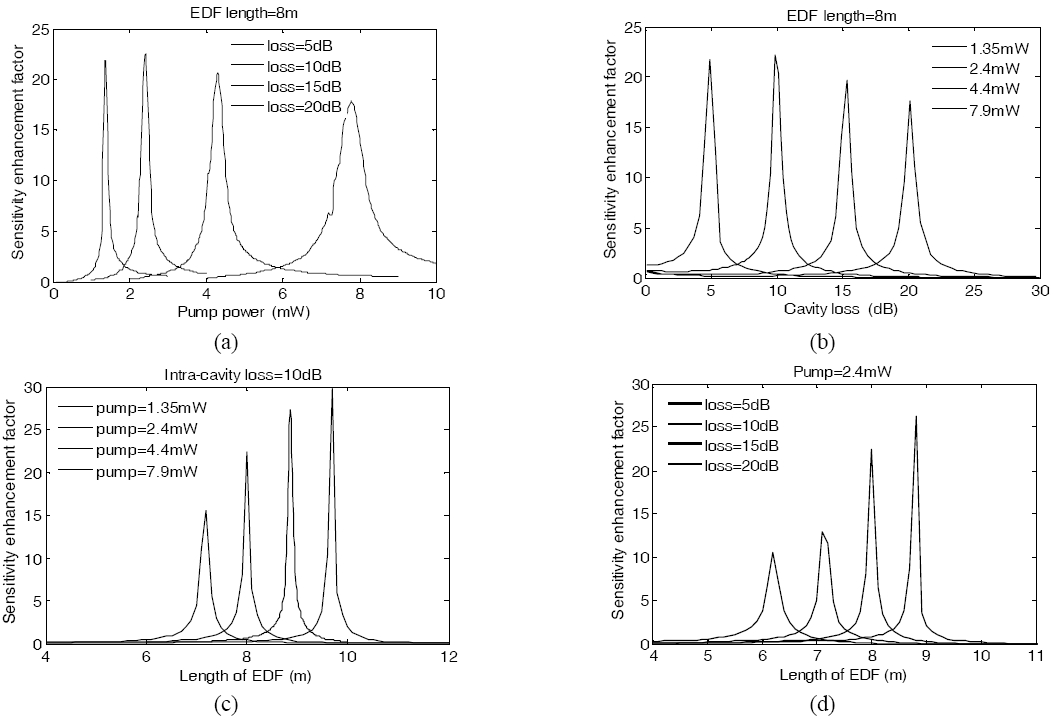
In Fig. 4 we show the theoretical results of the influences of pump power, cavity loss and EDF length on the sensitivity enhancement factor.
From Fig. 4(a) and (b), we can find that the highest sensitivity is achieved at the pump threshold and the cavity loss threshold. Increasing the pump power and decreasing the cavity loss have the same effects on the sensitivity enhancement factor of the gas sensor. Higher cavity loss means higher pump threshold and higher pump power means lower cavity loss threshold when the EDF length is constant. We can also find that, the value of the peak sensitivity varies with the pump power and cavity loss. In Fig. 4(a), among four different cavity losses, the highest sensitivity can be obtained when the cavity loss is 10 dB and the pump power is at its threshold of 2.4 mW. In Fig. 4(b), for four different pump powers, the highest sensitivity can be achieved when pump power is 2.4 mW and the cavity loss is at its threshold of 10 dB. Due to the laser is usually not stable working right at the threshold, in practical application, we should make the system running a little beyond the threshold to have both high sensitivity and high stability.
In Fig. 4(c), when the intra-cavity loss is 10 dB, the system reaches its peak sensitivity with different EDF lengths and at different pump powers. Higher pump power leads to shorter EDF length required to achieve its peak sensitivity. In addition, higher pump power also results in higher peak sensitivity enhancement factor when the intra-cavity loss is constant. Among the four pump powers we considered, the greatest peak sensitivity is obtained when pump power is 7.9 mW. In Fig. 4(d), when the pump power is 2.4 mW, the optimal EDF length varies with different intra-cavity losses. We can conclude that the higher the cavity loss is, the lower the peak sensitivity will be. If the cavity loss is decreased under the same pump power, a longer EDF is required to achieve the peak sensitivity. It is clear that the optimal lengths of EDF under different pump power and cavity loss need to be investigated before conducting experiments.
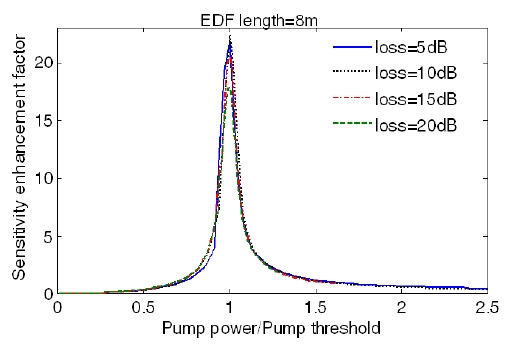
In order to establish the relationship between the pump power and the sensitivity enhancement factor with regard to the pump threshold, we introduce the ratio of pump power over the pump threshold in Fig. 5. It is obvious that the sensitivity varies with the ratio and reaches its maximum exactly at 1. This means that the peak sensitivity enhancement is always peaked at the pump threshold, regardless the values of intra-cavity loss, although the magnitude of the peak sensitivity changes with the value of intra-cavitylosses.
4.1.3 Spectral characteristics
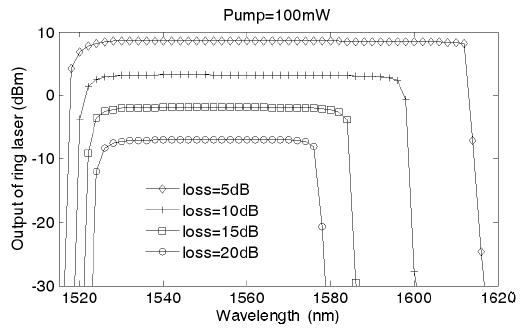
Fig. 6 shows the output power and tuning (operating) range of the system as a function of wavelength of 8-meter-long EDF at 100 mW pump power, with four intra-cavity losses: 5 dB, 10 dB, 15 dB and 20 dB respectively. It is obvious that the output power and tuning wavelength range are very sensitive to the intra-cavity loss. Both the output power and the tuning range increase significantly if the intra-cavity loss reduces. When the intra-cavity loss is high, e.g. 20 dB, the tuning bandwidth covers C band only. However, with a lower intra-cavity loss, e.g. 5 dB, a much larger tuning wavelength band (C+L) can be obtained. It is clear that tuning range is more sensitive to intra-cavity loss at the long wavelength side than at the short wavelength side. When the cavity loss increases from 5 dB to 15 dB, the range at the long wavelength side decreases nearly 40 nm, while at the short wavelength side decreases less than 10 nm. These results reveal that low intra-cavity loss is necessary if large tuning wavelength range and high output power are desired.
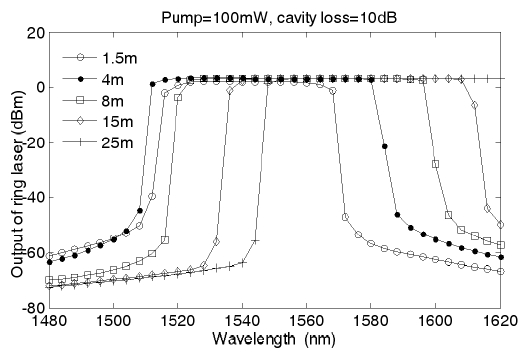
To investigate the effect of EDF length on the tuning wavelength range and the output power, we set the intra-cavity loss at 10 dB and the pump power at 100 mW for five EDF lengths (1.5 m, 4 m, 8 m, 15 m and 25 m). The simulation result is shown in Fig. 7. It can be seen that, for the EDF length equals 1.5 m, the tuning bandwidth is narrow (about 40 nm) and the center wavelength is near 1540 nm. With an increase of EDF length (from 4 m to 8 m), the tuning bandwidth becomes broader and the center wavelength shifts to the longer wavelength band, the output power also increase a little. With the EDF length longer than 15 m, the tuning range and output power reach their maximum and become quite stable.
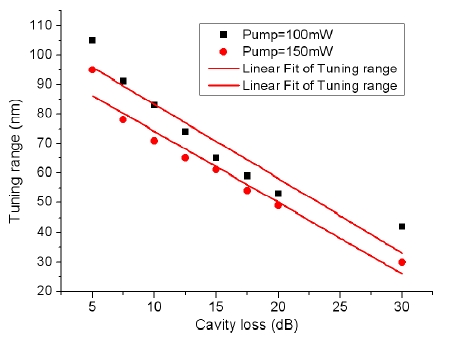
The effect of cavity loss on the tuning (operating) range of the system is analyzed for a piece of 8m EDF with pump power of 100 mW and 150 mW respectively. We show the results and the fitted curves of the results in Fig. 8. The tuning range decreases nearly linearly with the increase of the cavity loss if the pump power is fixed. When the cavity loss is the same, higher pump power means wider tuning range. From the figure, we can safely conclude that increasing the pump power and decreasing the cavity loss are two effective methods to make the tuning range of the system broader.
4.2 Experimental results and discussions
4.2.1 Sensitivity enhancement
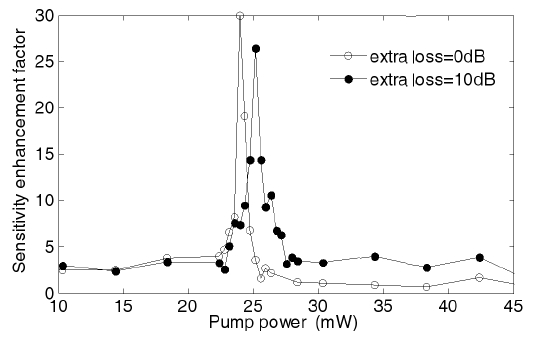
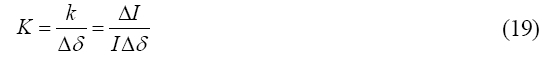
The sensitivity enhancement factor can be tested by experiments. Measurements are conducted using a similar system as shown in Fig. 1. The dependence of the sensitivity enhancement factor on the pump power is measured and shown in Fig. 9. The EDF we use in the experiment is different with the one we use in the simulation. The experimental EDF has a length of 2.5 m. The intra-cavity loss is about 10 dB. The measurement is conducted twice, without and with an extra loss equals 10 dB. The amplitude of the output power was collected for 15 times and then averaged, with Δδ=0.1 dB (as defined in Eq.19). It is obvious that the experimental results are in accordance with the theoretical expectation. The highest sensitivity can be obtained at the pump threshold. The greater intra-cavity loss leads to the higher pump threshold. The peak sensitivity of the system without extra loss is higher than that with extra loss.
4.2.2 Gas detection with ICAGS
Gas sensing experiments are also conducted with the system setup shown in Fig. 1. The resolution of the tunable attenuator is 0.01 dB. The gas cell is made by aligning a pair of commercial pigtailed selfoc lenses. This design of the gas cell could have long path length and low insertion loss. The length of the gas cell is about 10 cm. The parameters of the TF are the same with that we use in the theoretical analysis.
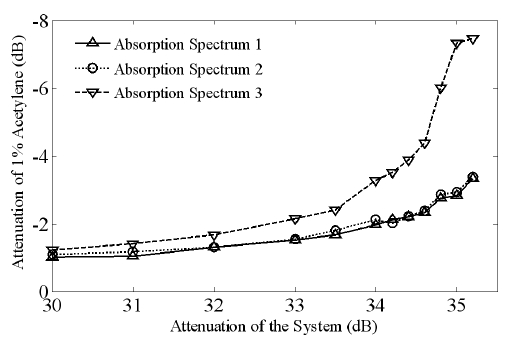
There are three strong absorption lines of acetylene near 1530 nm and we define they are Spectrum1, Spectrum 2, Spectrum 3 which are at 1531.588 nm, 1530.371 nm and 1529.180 nm respectively [5]. From the HITRAN database, we can get the absorption cross-sections of the three absorption lines are 1.17×10⁻²⁰ cm-1/(molecule·cm-3), 1.21×10⁻²⁰ cm-1/(molecule·cm-3), 1.14×10⁻²⁰ cm-1/(molecule·cm-3) [16]. By adjusting the voltage applied on the TF, we can scan the three absorption line in 90 s and get the average value.
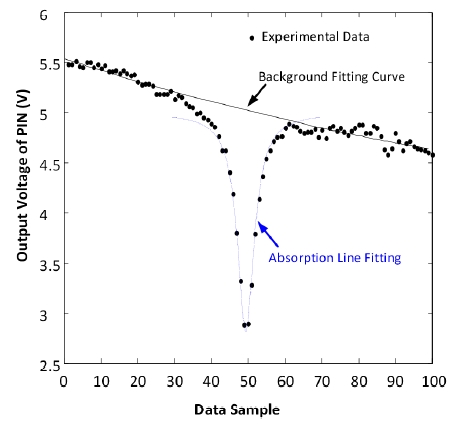
The experimental data we got were scattered data requiring further processing to get the exact position of the absorption peak and calculate the attenuation induced by the gas absorption. Under room temperature and normal pressure, the absorption line shape is Lorentzian profile. With the data processing method shown in Fig. 10, the experimental data can be curve-fitted by Lorentzian function and the position of the peak of the Lorentzian profile is used as the position of the absorption line.
The system can be used to realize gas detection and the amplitude of the absorption signal is proportional to the concentration of the gas. When the gas cell was filled with 1% acetylene and the pump driving current was set to 80 mA, the relationship between the absorption signal and the system attenuation is shown in Fig. 11. Of the three absorption lines, the strongest absorption happens at 1529.180 nm, and the attenuation of the other two absorption signals is similar. For the strongest absorption line, the maximum of the absorption signal was about 7.5 dB, corresponding to an enhancement of more than 30 times over the singlepass absorption loss of only 0.2 dB. This means that the sensitivity is greatly enhanced in our ICAGS system.
We have theoretically and experimentally studied the operation and performance of fiber ring laser based ICAGS, using a 980 nm diode pumped EDF. Our theoretical analysis and simulation are carried out using the coupled rate equations and propagation equations, taking into consideration of the dynamics of doped atoms (in both ground and excited states), optical pump and signal, cavity loss and feedback, EDF length and gas absorption. The sensitivity enhancement and spectral characteristics of the system are systematically investigated with respect to the pump power, the intra-cavity loss and the EDF length. From our theoretical analysis, we draw the following conclusions: The peak sensitivity (enhancement) is reached exactly at the pump threshold or the cavity loss threshold; The peak sensitivity varies with both the pump power and cavity loss, i.e. for fixed values of the pump power and cavity loss, we can find an optimal EDF length and achieve a peak sensitivity; With a fixed value of the pump power, both the optimal EDF length and the peak sensitivity decrease with the increase of cavity loss; With a fixed value of the intra-cavity loss, both the optimal EDF length and the peak sensitivity increase with the increase of cavity loss; Both the tuning (or operating) range and output signal power are sensitive to the pump power and cavity loss. Higher pump power and lower intracavity loss would have broader tuning range and greater output signal power; The EDF length also affects the tuning range and output signal power, i.e. with the increase of EDF length, the tuning range and output power increase.
The experiment to measure the sensitivity of ICAGS is conducted and the results agree well with the theoretical predictions. Using WST, real time gas sensing is realized with the ICAGS and 1% acetylene is tested. In our experimental ICAGS, the signal absorption is significantly enhanced in comparison to that of the single-pass absorption gas sensor, thus demonstrating that the ICAGS system could realize high sensitivity gas detection.